
ABSTRACT
While regulatory T cells (Tregs) and macrophages have been recognized as key orchestrators of cancer-associated immunosuppression, their cellular crosstalk within tumors has been poorly characterized. Here, using spontaneous models for breast cancer, we demonstrate that tumor-associated macrophages (TAMs) contribute to the intratumoral accumulation of Tregs by promoting the conversion of conventional CD4+ T cells (Tconvs) into Tregs. Mechanistically, two processes were identified that independently contribute to this process. While TAM-derived TGF-β directly promotes the conversion of CD4+ Tconvs into Tregs in vitro, we additionally show that TAMs enhance PD-1 expression on CD4+ T cells. This indirectly contributes to the intratumoral accumulation of Tregs, as loss of PD-1 on CD4+ Tconvs abrogates intratumoral conversion of adoptively transferred CD4+ Tconvs into Tregs. Combined, this study provides insights into the complex immune cell crosstalk between CD4+ T cells and TAMs in the tumor microenvironment of breast cancer, and further highlights that therapeutic exploitation of macrophages may be an attractive immune intervention to limit the accumulation of Tregs in breast tumors.
Introduction
An important barrier for effective anti-tumor immunity in breast cancer is cancer-associated immunosuppression.Citation1–3 Within breast tumors, cancer cells and host cells including stromal cells, innate and adaptive immune cells, cooperate to limit the infiltration, proliferation, and function of T cells with anti-tumor capacity.Citation4 A key cell type involved in cancer-associated immunosuppression is the FOXP3+CD4+ regulatory T cell (Treg). Due to their immunosuppressive nature, Tregs play an essential role in immune homeostasis, but can be hijacked by tumors. Clinical studies in the context of breast cancer have shown that elevated levels of intratumoral Tregs correlate with high tumor grade and poor survival.Citation5,Citation6 In line, preclinical data show that Tregs can interfere with anti-tumor immunity and immunotherapy response in mouse models for breast cancer.Citation7–10 Molecular insights into how Tregs accumulate inside tumors may set the stage for the development of novel therapeutic interventions aimed at reducing Treg numbers in breast tumors.
Functional, immunosuppressive Tregs can develop via two distinct routes. The main route is through a specialized thymic developmental program that selects single positive CD4+ thymocytes with a high-affinity TCR recognizing tissue-restricted self-antigen. These Treg precursor cells further develop into mature, thymic-derived FOXP3+ Tregs (tTregs) under influence of cytokine stimulation of IL-2/IL-15,Citation11 which coordinates the suppression of detrimental auto-immune responses directed toward self-antigen. In addition, peripherally induced Tregs (pTregs) can arise in the periphery through induction of FOXP3 in non-regulatory CD4+ conventional T cells (Tconvs).Citation12 This latter process is mediated by TGF-β-induced SMAD3, which can bind an enhancer located in intron 2 (CNS1) of FOXP3, leading to its expression.Citation13,Citation14 Preclinical research using CNS1−/− mice that lack these peripherally induced Tregs (pTregs) have demonstrated a vital role for these cells in preventing excessive immune responses in the gut, by providing tolerance to commensal microbiota.Citation15,Citation16
In addition to the indispensable role of TGF-β for the extrathymic differentiation of Tregs, this process can be fine-tuned by other factors, including PD-1 signaling.Citation17 Signaling through PD-1 in CD4+ T cells can enhance TGF-β-mediated conversion of CD4+ Tconvs by inactivation of STAT1-mediated inhibition of FOXP3, or by improving the stability of FOXP3 in induced Tregs.Citation18,Citation19 While PD-1-mediated conversion of CD4+ Tconvs into Tregs is critical for the prevention of graft rejection in a mouse model for graft versus host disease (GvHD),Citation18 the importance of PD-1 for the induction of Tregs within the tumor microenvironment, where PD-1 is often highly expressed on infiltrated T cells,Citation20 is unclear.
Tregs have been shown to accumulate in murine tumor models through chemotaxis-mediated recruitment, most notably via CCL2, CCL4, CCL8, and CCL17,Citation21–23 but emerging data suggest that intratumoral conversion of CD4+ Tconvs into Tregs may additionally increase the intratumoral presence of Tregs in breast cancer.Citation24 However, the underlying immune cell crosstalk that drives this process remains poorly understood. Interestingly, in vitro studies have shown that tumor-associated myeloid cells, such as dendritic cells and macrophages, induce the conversion of conventional CD4+ T cells into Tregs,Citation24–26 but the relevance of this crosstalk with myeloid cells in the context of spontaneous mammary tumors has not been characterized, despite the high abundance of particularly macrophages in human breast cancer.Citation27
In the current study, we used the transgenic K14cre;Cdh1F/F;Trp53F/F (KEP) mouse model of invasive mammary tumorigenesis Citation28 to investigate the functional significance of crosstalk between tumor-associated macrophages (TAMs) and CD4+ T cells in intratumoral accumulation of Tregs. We demonstrate that TAMs promote the intratumoral accumulation of immunosuppressive Tregs by driving the conversion of CD4+ T cells into Tregs in vivo. In vitro studies showed that this process is dependent on TAM-derived TGF-β. In addition, we find that TAMs regulate PD-1 expression on intratumoral FOXP3− and FOXP3+CD4+ T cells. This facilitates Treg conversion as genetic ablation of PD-1 on conventional T cells reduces their conversion into FOXP3+ Tregs in vivo. Combined, this study reveals a novel interaction between TAMs and conventional CD4+ T cells, that drives the intratumoral accumulation of Tregs in breast cancer, and thereby contributes to increased understanding of the immune interactions at play in breast cancer.
Results
Regulatory T cells accumulate in de novo KEP mammary tumors and correlate with tumor-associated macrophages.
To study immune cell crosstalk between Tregs and TAMs in a model that closely recapitulates human breast tumor formation, we made use of the transgenic KEP mouse model, which spontaneously develops mammary tumors at 6–8 months of age.Citation28 Analysis of the infiltration of Tregs, identified by FOXP3 staining, showed that Tregs are more abundant in end-stage KEP mammary tumors (225 mm2), as compared to healthy mammary gland (). The immunosuppressive potential of intratumoral Tregs was determined by assessing their ability to suppress the proliferation of CD3/CD28-stimulated splenic CD4+ and CD8+ T cells ex vivo. T cell proliferation was significantly decreased in the presence of Tregs in an effector:target ratio-dependent manner (), indicating that Tregs isolated from mammary KEP tumors have potent suppressor activity.
Figure 1. Characterization Tregs and TAMs in the TME of KEP tumors. (a) Representative image of immunohistochemical staining of FOXP3 in mammary tumors (225 mm2) of KEP mice (top), or healthy mammary glands of WT littermates (bottom). Red arrows indicate FOXP3+ cells. (b) Quantification of data shown in (A). n = 3–5 mice/group. Per sample, 5 times 40x fields of view were averaged. (c) Division index of CTV labeled CD4+CD25− and CD8+ splenic T cells isolated from WT mice, co-cultured with various numbers of CD4+CD25+ Tregs isolated from mammary tumors (225 mm2) of KEP mice in indicated ratios for 96 hours (data pooled from 3 independent experiments, mean ± SEM shown). (d) Representative dot plot depicting TAMs (CD11b+, F4/80high) gated on CD45+ cells in mammary (225 m2) tumors of KEP mice. (e) Frequencies of intratumoral CD45− and CD45+ immune cell subpopulations of total live cells in (225 m2) mammary tumors of KEP mice (n = 5). Percentage of TAMs (CD45+CD11b+F4/80high), neutrophils (CD45+CD11b+Ly6G+Ly6Cint), CD11b− lymphocytes (CD45+CD11b−), Ly6Chigh monocytes (CD45+CD11b+F4/80−Ly6G−Ly6ChighSSC-alow), eosinophils (CD45+CD11b+F4/80low/intLy6G−SiglecF+SSC-Ahigh, other CD11b+ (% CD11b+ – % TAMs, neutrophils, Ly6Chigh monocytes, eosinophils) are quantified. (f) Scatter plot depicting correlation between FOXP3 versus CSF1R mRNA expression log2(norm_count+1) in tumors of the TCGA human breast cancer cohort (n = 1218 patient samples). (g) Scatter plot depicting correlation between Foxp3 versus Csf1r mRNA expression (normalized read counts) in mammary tumors obtained from 16 different GEMMs for mammary tumor formation, as previously described Citation29 (n = 145).
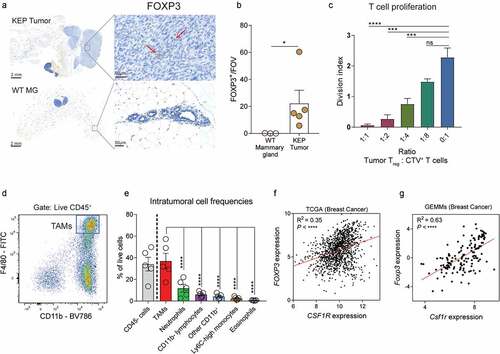
To investigate an association between Tregs and macrophages in breast tumors, we first characterized the infiltration of TAMs in end-stage KEP tumors. As we have published previously,Citation30 TAMs (CD11b+ F4/80high, ) are the most abundant immune cell population observed in KEP tumors (), and orchestrate systemic immunosuppression via the release of IL-1β.Citation29 In line with this immunosuppressive character, TAMs in KEP tumors are negatively enriched for IFN-y and IFN-α signaling compared to macrophages from healthy mammary glands, indicative of reduced immunostimulatory activity (Figure S1A). Analysis of mRNA expression levels of FOXP3 (Tregs) and CSF1R (TAMs) in the human breast cancer cohort of The Cancer Genome Atlas using the Xena platform Citation31 revealed a positive correlation between FOXP3 and CSF1R (). Likewise, this positive correlation between FOXP3 gene and CSF1R gene expression could be validated in a RNAseq dataset previously published by our lab, consisting of 120 tumors derived from 16 different GEMMs representing distinct subtypes of breast cancer Citation29 (), thereby showing that these correlations exist across species and tumor models, raising the question whether Tregs and TAMs functionally interact in breast tumors.
TAMs promote Treg accumulation in the tumor microenvironment by inducing the conversion of CD4+Tconvs into Tregs in vivo
To elucidate whether TAMs are causally involved in the accumulation of Tregs in mammary tumors, we assessed the impact of macrophage depletion in tumor-bearing KEP mice on intratumoral Tregs (). For this, a chimeric mouse IgG1 antagonistic antibody (clone 2G2) that binds to mouse CSF1R with high affinity was used,Citation32 which blocks the interaction between CSF1 and CSF1R, thereby depleting macrophages which are dependent on CSF-1.Citation30,Citation33 Indeed, in line with previous findings,Citation30 anti-CSF1R treatment strongly reduced the F4/80high CD11b+ macrophage population in KEP mammary tumors (). In parallel, a strong reduction in the frequency and absolute counts of FOXP3+ Tregs was observed in anti-CSF1R-treated mice compared to control-treated mice, which was limited to the TME, and not observed in other tissues (, S1B). The phenotype of the remaining Tregs, as assessed by their expression of CD103, ICOS, CD25, and CD69, was not altered upon anti-CSF1R treatment (Figure S1C). Of note, macrophage depletion did not significantly impact tumor burden or alter the frequency of conventional CD4+ or CD8+ T cells, (Figure S1D-E). Together, these data indicate that TAMs play a role in the accumulation of Tregs in mammary tumors.
Figure 2. TAMs promote the conversion of CD4+Tconvs into Tregs. (a) Schematic overview of study. KEP mice bearing 25 mm2 mammary tumors received weekly treatment of anti-CSF1R or control, until analysis at a cumulative tumor size of 225 mm2. (b) Frequency of F4/80highCD11b+ cells of CD45+ cells in mammary tumors of KEP mice treated with anti-CSF1R or control (n = 5 mice/group). (c) Frequency of FOXP3+ cells of CD4+ cells in mammary tumors of KEP mice treated with anti-CSF1R or control (n = 5 mice/group). (d) Immunohistochemical quantification of FOXP3+ cells in mammary tumors of mice treated with anti-CSF1R or control (n = 7 mice/group). (e) Correlation plot matrix plot showing Spearman coefficient between transcriptional profiles of Tregs and Tconvs (n = 3) isolated from indicated tissue of KEP mice bearing end-stage mammary tumors and healthy mammary glands of WT littermates (n = 4). (f) Representative dot plots of FOXP3 expression in live CD4+CD25− T cells isolated from spleens of tumor-bearing KEP mice after co-culture with, or without TAMs (CD3−F4/80high) for 72 hours. (g) Percentage of FOXP3+ cells in CD4+ Tconvs (CD45+CD3+CD4+CD25−) isolated from spleens of tumor-bearing KEP mice after co-culture with, or without TAMs (CD3−F4/80high) for 72 hours (data pooled from 3–4 independent in vitro experiments). (h) Schematic overview of study. TdTomato+ CD4+CD25− T cells were FACS sorted from spleens of ROSAmT/mG mice, activated in vitro for 96 hours, and subsequently adoptively transferred into KEP mice bearing 25 mm2 mammary tumors that received weekly treatment of anti-CSF1R or control. 7 days later, mice were analyzed. (i) Representative dot plots depicting FOXP3 expression on adoptively transferred TdTomato+ CD4+ Tconvs in draining lymph nodes and tumors of control and anti-CSF1R-treated mice. (j) Frequencies of FOXP3+ cells within adoptively transferred TdTomato+ CD4+ Tconvs in draining lymph node, blood, spleen and tumors of control, and anti-CSF1R-treated mice (n = 4/mice group).
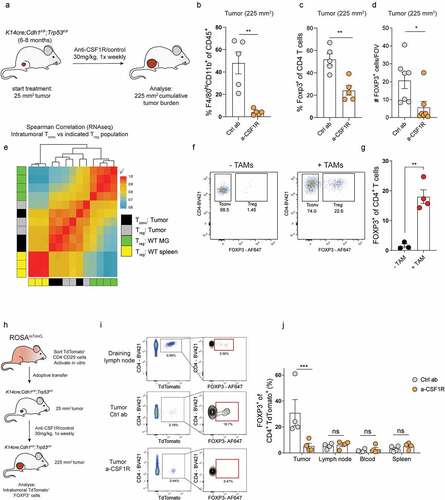
We then set out to assess how TAMs promote the intratumoral accumulation of Tregs in KEP mammary tumors. Since we previously reported that Tregs in KEP tumors show limited expression of Ki-67, similar to Tregs in healthy mammary glands where TAMs are not present, it is unlikely that TAMs facilitate intratumoral Treg accumulation by enhancing their proliferation.Citation8 Others have reported that macrophages can release chemokines such as CCL17 and CCL22 that contribute to recruitment of Tregs,Citation25,Citation34,Citation35 however, we did not observe altered gene expression of these chemokines, or other chemokines involved in Treg recruitment into tumors,Citation36–39 in tumors treated with control antibody or anti-CSF1R (Figure S1F), suggesting that TAMs promote Treg accumulation in KEP mammary tumors via a different mechanism. We hypothesized that TAMs may promote Treg accumulation by inducing the conversion of CD4+ Tconvs into Tregs. To test this hypothesis, gene expression profiles of Tregs isolated from end-stage mammary tumors, WT mammary glands or WT spleen were compared with the gene expression profiles of CD4+ Tconvs (CD4+CD25−) isolated from end-stage mammary tumors. Correlation analysis suggests that intratumoral Tregs are transcriptionally more similar to intratumoral CD4+ Tconvs than to Tregs isolated from WT mammary gland or spleen (), perhaps suggesting that there might be a relationship between intratumoral Tregs and CD4+ Tconvs, that may arise through conversion of CD4+ Tconvs into Treg cells.
To test whether TAMs are functionally involved in conversion of CD4+ Tconvs into Tregs, CD4+CD25− Tconvs isolated from spleen and lymph nodes of tumor-bearing mice were cultured with or without TAMs FACS-sorted from KEP tumors (Figure S1E). After 72 hours of co-culture, we found a significant increase in FOXP3 expression in CD4+CD25− Tconvs cultured with TAMs compared to CD4+CD25− Tconvs cultured without TAMs, indicating that TAMs have the potential to drive conversion of CD4+ Tconvs into Tregs under in vitro conditions (, S1H). In these cultures, we also observed increased viability of CD4+ T cells co-cultured with TAMs, suggesting TAMs might also support CD4+ T cell survival (Figure S1I).
Next, we set out to investigate whether TAMs also mediate Tconv-Treg conversion in vivo, and thus might explain the observed reduction of intratumoral Tregs in anti-CSF1R-treated KEP mice (). CD4+ Tconvs (CD4+CD25−) cells were FACS-sorted from naïve mTmG mice, which have continuous and ubiquitous expression of TdTomato, allowing for their in vivo tracing. Following in vitro activation to improve CD4+ Tconvs homing into tumors, CD4+ Tconvs (~98% purity post activation, S1J) were adoptively transferred into KEP mice bearing de novo mammary tumors (). Analysis of tumor-bearing mice, 7 days after adoptive transfer, revealed that TdTomato+ cells could be retrieved from blood and multiple tissues, including spleen, draining lymph nodes and tumors (). Transferred CD4+CD25− TdTomato+ cells in non-tumor tissues lowly expressed FOXP3 (~7% in draining lymph node, <5% in blood and spleen), whereas ~33% of transferred cells found in KEP tumors expressed FOXP3, indicating that TdTomato+ conventional CD4+ T cells undergo conversion into Tregs in vivo (). Strikingly, macrophage depletion in parallel to adoptive transfer of FOXP3− CD4+ TdTomato+ cells into tumor-bearing KEP mice () significantly reduced the frequency of FOXP3+ cells within the transferred TdTomato+ population in tumors but not in draining lymph nodes, spleen, or blood when compared to control antibody-treated mice (). Combined, these data indicate that TAMs promote the intratumoral accumulation of Tregs, which can at least partly be explained through the potential of TAMs to drive the conversion of CD4+ Tconvs into Tregs.
TAM-mediated in vitro conversion of CD4+Tconvs into Tregs is mediated by TGF-β.
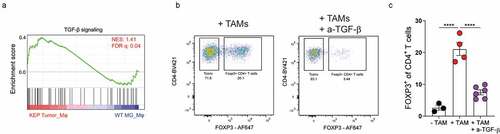
Next, we set out to explore the underlying mechanism of TAM-mediated induction of Tregs. We first focussed on the potential role of TAM-derived TGF-β, as TGF-β is well known to be indispensable for the conversion of CD4+ Tconvs into Tregs.Citation14 Gene set enrichment analysis (GSEA) of macrophages isolated from mammary tumors of KEP mice and healthy mammary glands of WT littermates using a previously published dataset Citation40 revealed that TAMs are enriched (FDR < 0.05) for genes involved in TGF-β signaling, compared to macrophages from healthy mammary glands (). To test whether TAM-derived TGF-β might contribute to conversion of CD4+ Tconvs into Tregs, CD4+CD25− T cells isolated from spleen and lymph nodes were co-cultured with TAMs isolated from KEP tumors in the presence or absence of anti-TGF-β. Indeed, blockade of TGF-β significantly reduced TAM-mediated induction of Tregs, indicating that TAMs can promote the conversion of CD4+ Tconvs into Tregs in vitro in a TGF-β-dependent manner (, S2A). This process did not require an antigen-specific interaction, as in vitro blockade of MHC-II did not modulate Treg induction (Figure S2B). Furthermore, in vitro exposure of splenic CD4+ Tconvs to conditioned medium obtained from TAMs did not induce FOXP3 (Figure S2C), suggesting close proximity of both CD4+ Tconvs and TAMs is required for TGF-β-mediated induction of FOXP3 in CD4+ Tconvs.
Figure 3. TAM-derived TGF-β promotes Tconv-Treg conversion. (a) GSEA comparing gene expression of KEP TAMs and WT mammary gland macrophages Citation40 with TGF-β signaling gene set from.Citation41 Normalized enrichment score (NES) and false discovery rate (FDR) indicated. Data obtained using a previously published dataset.Citation40 (b) Representative dot plot of FOXP3 expression in CD4+ Tconvs isolated from spleens of tumor-bearing KEP mice after co-culture with TAMs (CD3−F4/80high) and 50 µg/mL anti-TGF-β for 72 hours. (c) Percentage of FOXP3+ cells in CD4+ Tconvs (CD45+CD3+CD4+CD25−) isolated from spleens of tumor-bearing KEP mice after co-culture with TAMs (CD3−F4/80high) and 50 µg/mL anti-TGF-β for 72 hours (data pooled from 3–6 independent in vitro experiments).
TAMs promote PD-1 expression on intratumoral CD4+ T cells
The peripheral conversion of CD4+ Tconvs into Treg cells is dependent on TGF-β, but can be additionally enhanced by various contact-dependent mechanisms, such as PD-1 signaling, which has become clear from in vitro studies and studies using murine models for experimental colitis and experimental graft versus host disease.Citation18,Citation19,Citation42 However, in breast cancer, it is largely unclear whether PD-1/PD-L1 signaling in tumors contributes to the conversion of intratumoral CD4+ Tconvs into Tregs, even though high expression of PD-1 has been observed on intratumoral T cells in breast cancer patients.Citation20 To gain insight into this, we analyzed PD-L1 expression in the TME and found that PD-L1 is most highly expressed by TAMs (). Furthermore, analysis of PD-1 expression on CD4+ T cells that were co-cultured with TAMs revealed that TAM-induced FOXP3+ Tregs have significantly higher expression of the co-inhibitory molecule PD-1 as compared to non-converted FOXP3− CD4+ T cells (), which was also observed in the context of anti-TGF-β (Figure S2D). Interestingly, by assessing the intratumoral distribution of TAMs, identified by Iba1 staining, Tregs, CD4+ T cells and PD-1, we identified that these populations can cluster together in KEP tumors (Figure S2E). Combined, these observations raise the question whether TAMs can modulate PD-1 expression on CD4+ T cells that convert into Tregs.
Figure 4. TAMs modulate PD-1 expression of CD4+ T cells. (a) Representative histogram depicting PD-L1 expression on indicated cell populations in mammary tumors (225 m2) of KEP mice. (b) Quantification of PD-L1 MFI in indicated populations depicted in A (n = 3 mice/group). (c) Quantification of PD-1 expression in FOXP3− and FOXP3+ sorted CD4+ Tconvs isolated from spleens of tumor-bearing KEP mice that were co-cultured with TAMs for 72 h with 300 U/mL IL-2 and 20 ng/mL M-CSF. Data pooled from 8 independent in vitro experiments. (d-e) Frequencies of PD-1 expression gated on FOXP3− (d) and FOXP3+ (e) CD4+ T cells in indicated tissues of KEP mice bearing (225 m2) mammary tumors versus WT littermates (n = 3–8 mice/group). (f-g) Frequency of PD-1+ cells of CD4+FOXP3− (f) CD4+FOXP3+ (g) T cells in mammary tumors of mice treated with anti-CSF1R or control (n = 5 mice/group). (h) Quantification of PD-1 expression in PD-1posCD4+CD25− T cells isolated from KEP mammary tumors cultured with CD45+ F4/80high macrophages for 72 h with 300 U/mL, IL-2 and 20 ng/mL M-CSF. Data pooled from 2–3 independent in vitro experiments. (i) Scatter plot depicting correlation between PDCD1 versus CSF1R mRNA expression log2(norm_count+1) in tumors of the TCGA human breast cohort (n = 1218 patient samples). (j) Scatter plot depicting correlation between Pdcd1 versus Csf1r mRNA expression (normalized read counts) in mammary tumors obtained from 16 different GEMMs for mammary tumor formation, as previously described Citation29 (n = 145).
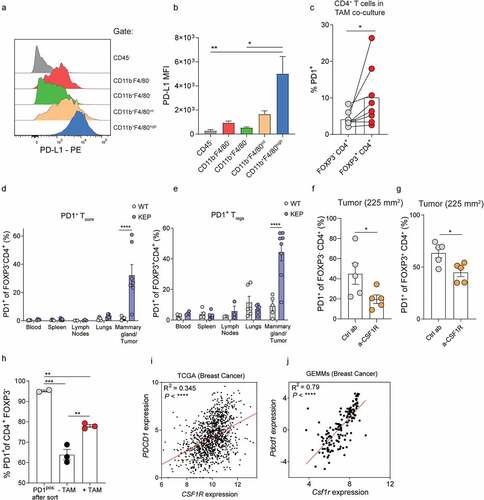
To investigate a potential link between TAMs and PD-1 that may impact the conversion of CD4+ Tconvs into Tregs in vivo, we characterized PD-1 expression on FOXP3− and FOXP3+ CD4+ T cells in tumor-bearing KEP mice and WT littermates. This revealed that PD-1 was significantly increased on both CD4+ subtypes in mammary tumors as compared to healthy mammary glands of WT littermates (). Increased PD-1 expression in tumor-bearing KEP mice was specific to the TME, and not observed in blood, spleens, lungs or draining lymph nodes on Tregs and CD4+ Tconvs in KEP versus WT mice. Next, PD-1 expression on T cells in KEP tumors treated with anti-CSF1R or control antibody was analyzed. Strikingly, macrophage depletion reduces PD-1 expression on both FOXP3− and FOXP3+ intratumoral CD4+ T cells (), but not on CD8+ T cells (Figure S2F). To investigate whether PD-1 expression on intratumoral conventional CD4+ T cells could be directly modulated by TAMs, PD-1neg and PD1pos CD4+CD25− T cells isolated from KEP tumors were cultured with or without FACS-sorted TAMs (Figure S1G, S2G). After 72 hours of culture, TAMs were found to significantly induce PD-1 on PD-1neg sorted cells (Figure S2H). PD-1 expression of PD-1pos sorted CD4+CD25− T cells was reduced to 64% after 72 hours, which was partially abrogated by addition of TAMs (), indicating that TAMs can induce and maintain PD-1 expression on intratumoral CD4+ T cells. In line with these findings, a positive correlation between CSF1R and PDCD1 was identified in both the TCGA breast cancer dataset (),Citation31 and our GEMM RNAseq dataset ().Citation29 Together, these data indicate that TAMs can positively regulate PD-1 expression on CD4+ T cells in breast tumors.
PD-1 expression on CD4+ Tconvs contributes to their intratumoral conversion into Tregs, independent of tumor-associated macrophages
Our findings show that TAMs promote the intratumoral conversion of CD4+ Tconvs in Tregs via release of TGF-β (), and also promote PD-1 expression on intratumoral CD4+ T cells (). To gain insight into the hypothesis that increased PD-1 signaling might promote the conversion of intratumoral CD4+ Tconvs into Tregs in vivo, we first explored the relationship between PD-1 and FOXP3 in the TME of breast cancer. Analysis of PDCD1 and FOXP3 gene expression in the TCGA breast cancer cohort Citation31 and our previously described breast cancer GEMM RNAseq dataset Citation29 identified a positive correlation between these two genes (). In addition, PD-1 protein expression on intratumoral CD4+ Tconvs positively correlates with Treg accumulation in KEP tumors (), further suggesting that PD-1 expression on CD4+ Tconvs might be linked to Treg accumulation.
Figure 5. PD-1 promotes intratumoral conversion of CD4+Tconvs into Tregs. (a) Scatter plot depicting correlation between FOXP3 versus PDCD1 mRNA expression log2(norm_count+1) in tumors of the TCGA human breast cohort (n = 1218 patient samples). (b) Scatter plot depicting correlation between Foxp3 versus Pdcd1 mRNA expression (normalized read counts) in mammary tumors obtained from 16 different GEMMs for breast cancer (n = 145). (c) Scatter plot depicting correlation between PD-1 expression on CD4+ Tconvs and % CD4+FOXP3+ of total T cells in KEP mammary tumors (n = 12 mice). (d) Representative dot plot of mCherry (left) and PD-1 (middle, right) expression in CD4+ Tconvs transduced with indicated pRubic vector, after 4 days of culture with IL-2. (e) Quantification of PD-1 expression on CD4+ Tconvs transduced with indicated pRubic vector (data pooled from 3 in vitro independent experiments). (f) Schematic overview of study. CD4+CD25− cells from ROSACAS9-GFP mice were purified, activated and transduced with pRubic-sgPD-1 or pRubic-Ctrl and adoptively transferred into mice bearing 25 mm2 KEP cell line tumors. After 7 days, mice were analyzed. (g) Quantification of PD-1 expression on CD4+ mCherry+ cells in KEP cell line tumors of mice receiving adoptive transfer of pRubic-sgPD-1 or pRubic-Ctrl CD4+ Tconvs (n = 3 mice/group). (h) Quantification of FOXP3 expression on CD4+ mCherry+ cells in KEP cell line tumors of mice receiving adoptive transfer of pRubic-sgPD-1 or pRubic-Ctrl CD4+ Tconvs (n = 3 mice/group). (i) Graphical representation describing findings presented in this study. TAMs can directly promote Treg conversion by release of TGF-β but can also, in a distinct fashion, “prepare” CD4+ Tconvs for conversion through induction of PD-1.
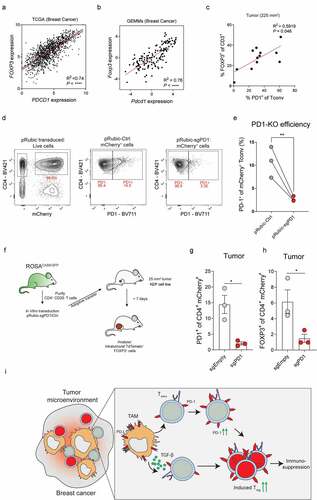
Next, we set out to investigate whether PD-1 plays a functional role in the conversion of CD4+ Tconvs into Tregs in vivo. For this, we first treated tumor-bearing KEP mice with PD-L1 blocking antibodies until end-stage tumor size was reached, but we did not find an effect on intratumoral Treg accumulation (Figure S3A). Notably, previous studies have shown that antibody-mediated blockade of PD-1/PD-L1 signaling can reinvigorate PD1+ Tregs, thereby inducing their proliferation.Citation43–46 To circumvent this potential confounding mechanism of antibody-induced Treg proliferation as a result of broadly targeting PD-1/PD-L1 signaling, we next applied an approach specifically targeting CD4+ Tconvs instead. For this, a CRISPR-Cas9-based approach was used to edit PD-1 in CD4+ Tconvs isolated from splenocytes of ROSAGFP-CAS9 mice, which have constitutive and ubiquitous expression of CAS9.Citation47 CD4+CD25− were purified from splenocytes by magnetic bead isolation, reaching a purity of 98% CD4+CD25− FOXP3− cells of total live cells (Figure S3B). Following in vitro activation for 48 hours using CD3/CD28 coated beads, CD4+ Tconvs were transduced with a modified pRubic retroviral vector encoding mCherry and a guideRNA targeting exon 2 of PDCD1, or control vector. Successful editing of the PDCD1 gene in pRubic-sgPD-1 transduced CD4+ Tconvs was confirmed by TIDE analysis Citation48 on pRubic-sgPD-1 and pRubic-Ctrl transduced cells (Figure S3C). In line, PD-1 protein expression was strongly reduced on pRubic-sgPD-1 CD4+ Tconvs as compared to pRubic-Ctrl CD4+ Tconvs, analyzed 4 days after transduction (). To evaluate the function of PD-1 in the intratumoral conversion of CD4+ Tconvs into Tregs in vivo, CD4+ Tconvs were transduced with pRubic-sgPD-1 and pRubic-Ctrl and adoptively transferred into mice bearing orthotopically injected KEP cell-line tumors (). Of note, PD-1 was lowly expressed on both pRubic-sgPD-1 and pRubic-Ctrl CD4+ Tconvs prior to adoptive transfer (Figure S3D). Analysis of tumors by flow cytometry 7 days after transfer showed similar infiltration of both sgPD-1, and sgEmpty mCherry+ CD4+ Tconvs cells (Figure S3E) but revealed that control CD4+ Tconvs upregulate PD-1 in the TME, which was not observed for PD-1 edited CD4+ Tconvs, confirming that successful editing of the PD-1 gene is maintained in vivo (). Strikingly, PD-1 edited CD4+ Tconvs showed reduced conversion into Tregs, as indicated by a significant lower expression of FOXP3 as compared to control CD4+ Tconvs in tumors (). No differences were observed in PD-1 or FOXP3 expression in non-tumor tissues including blood, spleen, or draining LN or blood (S3F). Combined, these data confirm that PD-1 expression on conventional CD4+ T cells promotes intratumoral conversion into Tregs.
Finally, we studied whether TAMs are directly involved in promoting conversion of CD4+ Tconvs into Tregs via PD-1 signaling, or whether this is primarily mediated by TGF-β. Despite high expression of PD-L1 by TAMs in the TME of KEP tumors (), blockade of PD-L1 in vitro did not reduce TAM-mediated conversion of CD4+ Tconvs into Tregs (Figure S3G) This indicates that TAMs can directly promote Treg conversion by release of TGF-β, but can also, in a distinct fashion, “prepare” CD4+ Tconvs for TAM-independent conversion through induction of PD-1 ().
Discussion
High intratumoral infiltration of immunosuppressive Tregs is associated with poor prognosis of breast cancer patients.Citation6 Insights into the mechanisms underlying the intratumoral accumulation of Tregs may set the stage for the development of novel therapeutic interventions. In the current study, we demonstrate that TAMs play a critical role in the accumulation of immunosuppressive Tregs in primary mammary tumors of the preclinical KEP mouse model. By studying the fate of endogenous CD4+ T cells and adoptively transferred CD4+ Tconvs in spontaneous mammary tumors in the context of anti-CSF1R, we show that TAMs support the intratumoral conversion of CD4+ Tconvs into FOXP3+ Tregs in vivo. Mechanistically, two independent processes were identified that contribute to this process (). Firstly, in vitro co-culture studies with TAMs and CD4+ Tconvs revealed that TAM-derived TGF-β promotes the conversion of CD4+ Tconvs into Tregs. Secondly, analysis of CD4+ Tconvs in the context of anti-CSF1R revealed that TAMs promote PD-1 expression on intratumoral CD4+ T cells. By studying adoptively transferred PD-1KO CD4+ Tconvs in mammary tumors in vivo, we demonstrate that PD-1KO CD4+ Tconvs have reduced potential to convert into Tregs in tumors in vivo, showing that PD-1 further augments the conversion of CD4+ Tconvs into Tregs. Combined, this study reveals the importance of TAMs for the intratumoral conversion of CD4+ Tconvs into immunosuppressive Tregs in de novo mammary tumors, highlighting the importance of myeloid-lymphoid immune cell crosstalk in the tumor microenvironment.
Despite their distinct precursors, distinguishing thymic derived-, from peripheral Tregs has been obscured by the lack of a protein-based marker to differentiate between tTregs and pTregs in vivo. Instead, their identification has relied on epigenetic analysis of regions in the FOXP3 gene that are uniquely demethylated and accessible in tTregs but not pTregs, and analysis of TCR repertoire overlap in suspected pTregs with CD4+ Tconvs. Due to the complexity of these analyses, it has been poorly characterized whether conversion of FOXP3− CD4+ T cells in the tumor microenvironment (TME) substantially contributes to intratumoral accumulation of Tregs. Nonetheless, being able to differentiate tTregs from pTregs in tumors is important, as preclinical studies have suggested that pTregs have specific properties that may prove valuable for clinical exploitation to alleviate intratumoral immunosuppression. For example, pTregs have been shown to be unstable in inflammatory milieus that lack TGF-β, resulting in loss of FOXP3 and immunosuppressive function,Citation49,Citation50 suggesting that targeting TGF-β might affect pTregs. In addition, tTregs and CD4+ Tconvs, the precursor cells of pTregs, are recruited into tumors through different chemotactic signals,Citation51 suggesting that independent therapeutic approaches are required to both block the intratumoral recruitment of tTregs, and the intratumoral conversion of pTregs. In the current study, we show that intratumoral conversion of CD4+ Tconvs into Tregs in spontaneous KEP mammary tumors is supported by TAMs, suggesting that therapeutic targeting of TAMs may be an alternative approach to reducing intratumoral Tregs. One potential limitation of this study is that despite careful isolation of highly pure Tregs and Tconvs, cells were not isolated using a Foxp3-reporter system which would, by definition, be a more pure approach for isolation of Tconvs and Tregs. Important to note here is that anti-CSF1R treatment reduced intratumoral Tregs, but did not increase CD8+ T cells or impact tumor burden, despite the potent suppressor function of Tregs in vitro. This suggests that additional layers of immunosuppression may be present in the microenvironment of KEP mammary tumors. In line with this, previous research in our lab has shown that neutrophils additionally suppress anti-tumor immunity in the absence of TAMs.Citation30 Thus, it is likely that combination strategies are necessary to alleviate the multiple immunosuppressive pathways at play in the tumor microenvironment. Although we have not deeply explored the anti-tumor effects of combination treatments in the current study, the fundamental insights gained from dissecting separate layers of intratumoral immunosuppression could form the basis for novel treatment combinations.
TAMs make up an important part of breast tumors, which has both been observed in human breast cancers, as well as in preclinical models of breast cancer.Citation27,Citation40 It is important to realize that TAMs have high plasticity, characterized by diverse phenotypes, activation states and biological functions.Citation52 Despite this diversity, TAMs are often associated with suppression of anti-tumor immune responses, and poor prognosis in cancer.Citation53 In line with this, preclinical research using the KEP model has shown that targeting macrophages with anti-CSF1R enhances chemotherapy efficacy of platinum-based drugs by unleashing type I interferon response.Citation30 Interestingly, in vitro studies using human monocyte-derived macrophages reported that macrophages contribute to conversion of human CD4+ Tconvs into Tregs through their release of TGF-β.Citation26 Vice versa, Tregs have also been shown to promote TAM infiltration in the context of indoleamine 2,3-dioxygenase-expressing murine B16 cell-line tumors.Citation54 Furthermore, macrophages have been described to release a plethora of chemokines,Citation52,Citation55,Citation56 including CCL4, CCL22, and CCL17 which have been implicated in the recruitment of Tregs in tumors.Citation25 In light of this, we here investigated the importance of TAMs for intratumoral Treg accumulation in breast tumors in vivo. We show that TAMs play a pivotal role in the accumulation of Tregs in a transgenic mouse model for spontaneous mammary tumorigenesis. Mechanistically, we found that TAMs promote CD4+ Tconv conversion into Tregs via release of TGF-β, but also by enhancing PD-1 expression on conventional CD4+ T cells. These data are in line with two recent studies that also identified a link between macrophages and Tregs in the context of non-small cell lung cancer (NSCLC). Lung tissue-resident macrophages (TRM) were found to promote Treg accumulation in a murine model for NSCLC.Citation25 TRMs were shown to express high levels of Ccl17 and Tgfb1, which were hypothesized to contribute to the recruitment and expansion of Tregs in this model. Secondly, antiangiogenic therapy in NSCLC was shown to facilitate the infiltration of PD-1+ Tregs into the TME, which were further supported by TAMs that created a TGF-β rich environment.Citation57
Previous studies have shown a role for PD-1 in the extrathymic differentiation of Tregs in non-tumor tissue.Citation18,Citation19,Citation42,Citation58,Citation59 In mice, PD-1 deficiency did not impact thymic development of Tregs, nor their suppressive potential in vitro, but PD-1 deficiency on CD4+ Tconvs specifically reduced their differentiation into Tregs in lymphopenic Rag−/− mice.Citation58 In line, others showed that PD-L1-coated beads synergized with TGF-β to promote Treg conversion in vitro.Citation42 Mechanistically, PD-1/PD-L1 signaling in CD4+ T cells can promote Treg conversion by inactivation of STAT1-mediated inhibition of FOXP3, and by improving the stability of FOXP3 in induced Tregs.Citation18,Citation19 Despite these findings, the role of PD-1-mediated induction of Tregs in the context of cancer has been unclear, whereas PD-1 is highly expressed on intratumoral T cells in breast cancer patients.Citation20 We here show that PD-1 expression on CD4+ T cells, is directly involved in intratumoral conversion of CD4+ Tconvs into Tregs in vivo. Importantly, we found that TAMs primarily support the initial step of PD-1-mediated Treg conversion by inducing PD-1 on CD4+ Tconvs, but are not further supporting conversion of PD1+ CD4+ Tconvs via PD-L1 signaling in vitro. Since we found PD-L1 to be widely expressed in the TME of KEP tumors, an important topic of future research is to identify which PD-L1+ cell type drives PD-1 mediated conversion in KEP tumors, and whether additional signals from these cells are facilitating this conversion process.
Since PD-1 blockade is becoming increasingly standardized for the treatment of cancers, future studies should further address whether therapeutic blockade of PD-1 indeed reduces Tconv-Treg conversion in human tumors, and its relevance for treatment efficacy. One important aspect to consider is that several recent studies have shown that blockade of PD-1 or PD-L1 leads to reinvigoration of Tregs thereby inducing their activation and proliferation, like observed on effector T cells.Citation44–46 This opposing effect of PD-1/PD-L1 blocking strategies, which decreases conversion of CD4+ Tconvs into Tregs, but increases proliferation of PD-1+ and PD-L1+ Tregs, further complicates clinical assessment of Treg conversion, and suggests that future PD-1 blocking strategies should be optimally targeted at CD4+ Tconvs, but not Tregs.
Taken together, this study reveals a novel relationship between TAMs, PD-1 expression on CD4+ T cells and Treg conversion in breast cancer. These data provide insight into the interdependency between different members of the TME that cooperate to establish immunosuppression, but also highlight that therapeutic targeting of macrophages affects the immunosuppressive tumor microenvironment beyond macrophages itself, making it an attractive immune intervention strategy for cancer treatment.
Materials and methods
Mice
Mice were kept in individually ventilated cages at the animal laboratory facility of the Netherlands Cancer Institute under specific pathogen-free conditions. Food and water were provided ad libitum. All animal experiments were approved by the Netherlands Cancer Institute Animal Ethics Committee, and performed in accordance with institutional, national and European guidelines for Animal Care and Use. The study is compliant with all relevant ethical regulations regarding animal research.
The following genetically engineered mice have been used in this study: Keratin14 (K14)-cre;Cdh1F/F;Trp53F/F, ROSAmT/mG, and ROSACAS9-GFP. The generation and characterization of Keratin14 (K14)-cre;Cdh1F/F;Trp53 F/F model for spontaneous mammary tumorigenesis has been described before.Citation28 All mouse models were on FVB/n background, and genotyping was performed by PCR analysis on toe clips DNA as described.Citation28 Starting at 6–7 weeks of age, female mice were monitored twice weekly for the development of spontaneous mammary tumor development in all mammary glands. Upon mammary tumor formation, perpendicular tumor diameters were measured twice weekly using a calliper. In KEP mice, sizes of individual mammary gland tumors in one animal were summed to determine cumulative tumor burden. End-stage was defined as cumulative tumor burden of 225 mm2. Age-matched WT littermates were used as controls.
Intervention studies
Antibody treatments in tumor-bearing KEP mice were initiated at a tumor size of 25 mm2. Mice were randomly allocated to treatment groups and were intraperitoneally injected with chimeric (hamster/mouse) anti-CSF-1 R antibody (clone 2 G2, Roche Innovation Center Munich; single loading dose of 60 mg/kg followed by 30 mg per kg once a week); control antibody (IgG1, MOPC21, Roche Innovation Center Munich; single loading dose of 60 mg per kg followed by 30 mg per kg once a week); Rat anti-mouse PD-L1 (Clone 10 F.9G2; 200 µg once a week). Treatments were discontinued at cumulative tumor burden of 225 mm2 unless indicated otherwise.
Flow cytometry analysis and cell sorting
Draining lymph nodes, spleens, tumors, and lungs were collected in ice-cold PBS, and blood was collected in heparin-containing tubes. Draining lymph nodes, spleens, tumors were processed as previously described.Citation60 Lungs were perfused with ice-cold PBS post mortem to flush blood. Next, lungs were cut into small pieces and mechanically chopped using the McIlwain tissue chopper. Lungs were enzymatically digested in 100 µg/mL Liberase Tm (Roche) under continuous rotation for 30 minutes at 37°C. Enzyme activity was neutralized by addition of cold DMEM/8% FCS and suspension was dispersed through a 70 μm cell strainer. Blood was obtained via cardiac puncture for end-stage analyses. Erythrocyte lysis for blood and lungs was performed using NH4Cl erythrocyte lysis buffer for 2 × 5 and 1 × 1 min, respectively. Single-cell suspensions were incubated in anti-CD16/32 (2.4G2, BD Biosciences) for 5 minutes to block unspecific Fc receptor binding. Next, cells were incubated for 20 minutes with fluorochrome conjugated antibodies diluted in FACS buffer (2.5% FBS, 2 mM EDTA in PBS). For analysis of FOXP3, cells were fixed and permeabilized after surface and live/dead staining using the FOXP3 Transcription buffer set (Thermofisher), according to manufacturer’s instruction. Fixation, permeabilization and intracellular FOXP3 staining was performed for 30 minutes. Single-cell suspensions of mice that received adoptive transfer of pRubic-mCherry CD4+ Tconvs were additionally fixed in 2% PFA (ThermoFisher) for 30 minutes, prior to fixation using the FOXP3 Transcription buffer set to enhance simultaneous detection of FOXP3 and mCherry as previously described.Citation61 Cell suspensions were analyzed on a BD LSR2 SORP or sorted on a FACS ARIA II (4 lasers), or FACS FUSION (5 lasers). Single-cell suspensions for cell sorting were prepared under sterile conditions. Sorting of CD4+ Tconvs (Live, CD45+CD3+CD4+CD25−PD-1pos/neg from indicated tissues and TAMs (Live, CD45+CD3−F4/80high) isolated from spontaneous mammary KEP tumors (>100 mm2) was performed as previously described.Citation60 Gating strategies depicted in Figure S1 + 2. See supplementary table 1 for antibodies used.
mTmG CD4+ Tconvs adoptive transfer studies
For adoptive transfer studies, naïve CD4+ Tconvs (Live, CD3+CD4+CD25−CD44−) were FACS sorted from ROSAmT/mG mice, and activated in vitro using CD3/CD28 dynabeads (ThermoFisher) in a 1:2 bead:cell and 300 U/mL IL-2 (PeproTech) ratio in 24-wells plates. After 96 hours, Dynabeads were magnetically removed, cells were washed and resuspended in HBSS and intravenously injected into KEP mice bearing 25 mm2 mammary tumors (1.5–2.5*106 cells/mouse). After 7 days, mice were sacrificed, single-cell suspensions were prepared and adoptively transferred cells were analyzed by flow cytometry as described above.
CD4+Tconvs – macrophage co-culture in vitro assays
3*103-1.0*104 CD4+ Tconvs (PD-1pos/neg as indicated for intratumoral CD4+ Tconvs) obtained from indicated source were co-cultured with 1.5*104- 5.0*104 (1:5 T cell:TAM ratio) TAMs in a round bottom, tissue culture treated 96-wells plate in cIMDM supplemented with 300 U/mL IL-2 and 20 ng/mL M-CSF, and 50 µg/mL anti-TGF-β, 50 µg/mL anti-PD-L1 or 100 µg/mL anti-MHC-II as indicated. After 72 hours, cells were washed with FACS buffer, and prepared for flow-cytometric analysis as described above. Conditioned medium was collected from 1 to 2*105 TAMs cultured for 48 h in cIMDM supplemented with 20 ng/mL M-CSF in flat-bottom, tissue culture treated 12-wells plate. CD4+ Tconv culture with TAM conditioned medium were additionally supplemented with CD3/CD28 Dynabeads (1:5 bead:cell ratio).
Cloning of pRubic-PD-1 retroviral vector
Transduction of CD4+ Tconvs isolated from splenocytes of ROSACAS9-GFP mice was carried out using a modified retroviral pRubic-T2A-Cas9-mCherry vector (https://www.addgene.org/75347/) containing sgRNA targeting exon 2 of Pdcd1. sgRNA-PD-1 was assembled by annealing complementary oligonucleotides 5’-CACCGCAGCTTGTCCAACTGGTCGG-3’ and 5’-AAACCCGACCAGTTGGACAAGCTGC-3’, with BbsI overhangs. Annealed oligo’s were subsequently ligated into the BbsI-digested PxL vector, which provided U6 promotor and gRNA scaffold. Then, gRNA-PD-1, U6 promotor and gRNA scaffold were cloned into pRubic vector using BstBI isoschizomer SfuI and PacI, resulting in pRubic-PD-1 or control pRubic vector, without gRNA. Successful insertion of gRNA into pRubic backbone was confirmed by sanger sequencing on purified DNA using hU6-Forward primer (5’-GAGGGCCTATTTCCCATGATT-3’).
Generation of pRubic Retrovirus
For generation of pRubic-retrovirus, 2*106 HEK cells were plated in 10cm2 dishes. 24 hours later, HEK cells were transfected with 1.5 μg vector pRubic-PD-1/pRubic-empty vector, and 1.0 μg pCL-ECO vector, using X-tremeGENE 9 DNA Transfection Reagent (06365787001, Roche). Retroviral supernatants were harvested after 48 and 72 hours. Viral particles were concentrated by spinning at 20,000 rpm for 2 hours at 4°C using the Avanti J-30I centrifuge (Beckman Coulter). pRubic-PD-1 and pRubic-empty retroviral titers were determined by using the qPCR Retrovirus Titration kit according to manufacturer’s instruction.
CD4+ Tconvs transduction and adoptive transfer
For adoptive transfer studies of pRubic transduced Tconvs, Tconvs were purified from single cell suspensions prepared from splenocytes of ROSACAS-GFP mice. To specifically purify Tconv from splenocytes, the magnetic-based EasySep CD4+ T cell isolation kit (StemCell Technologies) was used to obtain CD4+ T cells through negative selection. Next, enriched CD4+ T cells were used as input for the Miltenyi CD4+CD25+ regulatory T cell isolation kit (Miltenyi Biotec) to separate CD25+ from CD25− cells. Purity of negatively selected CD4+CD25− cells was confirmed by flow cytometry, and used for transduction. Retroviral transduction of Tconv was performed as previously described by Kurachi et al.Citation47 In brief, Tconv cells were activated in vitro using CD3/CD28 dynabeads (1:5 bead:cell ratio) and 300 U/mL IL-2 for 48 hours. Activated cells were harvested and enriched using a 30–60% Percoll gradient, in which activated, blasting cells accumulate at the interface layer of the centrifuged Percoll gradient. Cells derived from the interface layer were washed, and transferred to a 96-wells plate coated with 20 µg/mL Retronectin (Takara) and supplemented with 600 U/mL of IL-2 and CD3/CD28 dynabeads (1:2 bead:cell ratio) and retroviral vectors (100 multiplicity of infection, pRubic-mCherry-sgPD-1 and pRubic-mCherry-Ctrl). Cells were spin-transduced at 2000 g, 30°C for 60 minutes. After spin-transduction, cells were incubated at 37°C, 5% CO2 overnight, and further used for in vitro analyses or adoptive transfer experiments.
TIDE analysis
The TIDE webtool Citation48 was used to assess Crispr-CAS9 editing efficiency of PDCD1 gene in pRubic transduced CD4+ Tconvs. After transduction, pRubic-sgPD-1 and pRubic-Ctrl transduced CD4+ Tconvs were cultured in cIMDM supplemented with 300 U/ml of IL-2. After 96 hours, DNA was isolated using QIAamp DNA Micro kit (56304, QIAGEN) according to the manufacturer’s instructions followed by PCR amplification of exon 2 of PDCD1 gene (forward 5’-TCAGTTATGCTGAAGGAAGAGC-3’, reverse 5’-GGCAGAGAGCCTAAGAGGTC-3’) using 2 μl 10x High Fidelity PCR Buffer (P/N 52045, Thermofisher), 0.6 μl (50 mM) MgSO4 (P/N 52044, Thermofisher), 0.4 μl (10 mM) dNTP mix (P/N y02256, Thermofisher), 0.25 μl Platinum Taq (DNA Polymerase High Fidelity; 11304–011, Thermofisher) and 1 μL of each primer. Amplified DNA was purified from an 1% agarose gel using Illustra GFX PCR DNA and Gel Band Purification kit. Next, DNA was sequenced by Sanger sequencing (PDCD1 exon 2 forward primer 5’-TCAGTTATGCTGAAGGAAGAGC-3’ and samples were analyzed using the TIDE webtool using gRNA sequence targeting PDCD1 exon 2 (‘5-CAGCTTGTCCAACTGGTCGG-3’) (http://tide.nki.nl), using DNA from pRubic-Ctrl as control sample. Default parameters were used and decomposition window was set from 304–450bp.
Adoptive transfer of pRubic-mCherry transduced CD4+ Tconvs
For adoptive transfer, CD3/CD28 Dynabeads were magnetically removed, cells were washed and resuspended in HBSS and intravenously injected into mice bearing 25 mm2 mammary tumors of orthotopically injected KEP cell-line (2*106 cells/mouse). After 7 days, mice were sacrificed, single-cell suspensions were prepared and adoptively transferred cells were analyzed by flow cytometry as described above.
The Cancer Genome Atlas (TCGA) and breast cancer GEMM gene expression correlation analysis
Gene expression data of FOXP3, PDCD1 and CSF1R (log2(norm_count+1)) were obtained from the TCGA breast cancer cohort (n = 1218, version 2017–10-13, accessible through https://tcga-xena-hub.s3.us-east 1.amazonaws.com/download/TCGA.BRCA.sampleMap%2 FHiSeqV2.gz. Correlation analysis was performed using University of California Santa Cruz’s XenaBrowser.net. Foxp3, Pdcd1 and Csf1r gene expression data from Breast cancer GEMMs were obtained and analyzed as previously described.Citation29
KEP TAM gene expression analysis
GSEA Citation62 was performed using GSEA software (v. 4.0.3) on mSigDB Hallmark gene sets Citation41 using normalized gene expression data of “WT-MG-KEP” and “TAM-KEP” datasets obtained from GSE126268, as previously described.Citation40 Permutations for each gene set was conducted 1000 times to obtain an empirical null distribution.
Immunohistochemistry
Immunohistochemical analyses were performed by the Animal Pathology facility at the Netherlands Cancer Institute. Formalin-fixed tissues were processed, sectioned, and stained as described.Citation63 In brief, tissues were fixed for 24 h in 10% neutral buffered formalin and embedded in paraffin. Slides were digitally processed using the Panoramic P1000 slidescanner, and analyzed in QuPath (V.03.0).
RNAseq of Tregs and CD4+ Tconvs
For transcriptome analysis of Tregs from end-stage (225 mm2) KEP tumors, WT mammary gland and spleen, single-cell suspensions were prepared as described.Citation8 A minimum of 70.000 Tregs (Live, CD45+, CD3+, CD4+, CD25high) or CD4+ Tconvs (Live, CD45+, CD3+, CD4+, CD25−) were sorted in RLT buffer with 1% β-mercapto ethanol. Due to low abundance of Tregs in WT mammary glands, tissue of 3 mice was pooled for each WT Treg sample prior to sorting. Library preparation was performed as previously described.Citation64 Total RNA was extracted using RNAeasy mini kit (Qiagen). RNA quality and quantity control was performed using Agilent RNA 6000 Pico Kit and 2100 Bioanalyzer System. RNA samples with an RNA Integrity Number > 8 were subjected to library preparation. The strand-specific reads (65bp single-end) were sequenced with the HiSeq 2500 machine. Demultiplexing of the reads was performed with Illumina’s bcl2fastq. regDemultiplexed reads were aligned against the mouse reference genome (build 38) using TopHat (version 2.1.0, bowtie 1.1). TopHat was supplied with a known set of gene models (Ensembl version 77) and was guided to use the first-strand as the library-type. As additional parameters – prefilter-multihits and – no coverage were used. Normalized counts from DESeqDataSet from the DESeq2 package were subjected to calculate correlation among the samples by using ‘cor’ function using spearman method in R language (version 4.0.2).
Treg suppression assays
Treg-T cell suppression assays were performed as previously described.Citation60 In brief, Tregs (Live, CD45+, CD3+, CD8− CD4+, CD25high) sorted from freshly isolated KEP mammary tumors (225 mm2) were activated overnight in IMDM containing 8% FCS, 100 IU/ml penicillin, 100 μg/ml streptomycin, 0.5% β-mercapto-ethanol, 300 U/mL IL-2, 1:5 bead:cell ratio CD3/CD28 coated beads (Thermofisher). Per condition, 5.0*105 cells were seeded in 96-wells plate, which were further diluted to appropriate ratios (1:1–1:8). Responder cells (Live, CD45+, CD3+, CD4+, CD25− and Live, CD45+, CD3+, CD8+) were rested overnight. Next, responder cells were labeled with CellTraceViolet, and co-cultured with Tregs in cIMDM supplemented with CD3/CD28 beads (1:5 bead cell ratio) for 96 hours (without exogenous IL-2).
Statistical analysis
Data analyses were performed using GraphPad Prism (version 8). The statistical tests used are described in figure legends. All tests were performed two-tailed. P-values < 0.05 were considered statistically significant. Sample sizes for mouse intervention experiments were pre-determined using G*Power software (version 3.1). Asterisks indicate statistically significant differences compared to WT. * P < .05, ** P < .01, *** P < .001, **** P < .0001.
Data availability
Available from the authors upon reasonable request.
Contributions
K.K. and K.E.d.V. conceived the ideas and designed the experiments. K.K., C.S. performed experiments and data analysis. M.D.W., D.A.M, provided technical assistance. M.A. performed bioinformatical analysis. K.K., D.K., K.V., C.-S.H., and L.R. performed animal experiments. C.H.R. and M.S. provided the anti-CSF-1R antibody and control antibody. K.E.d.V. supervised the study, K.E.d.V and K.K. acquired funding, K.K. and K.E.d.V. wrote the paper and prepared the figures with input from all authors.
Supplemental Material
Download Zip (10.9 MB)Acknowledgments
We acknowledge members of the Tumor Biology & Immunology Department, NKI for their insightful input. We thank the flow cytometry facility, genomics core facility, animal laboratory facility, transgenesis facility, and animal pathology facility of the Netherlands Cancer Institute for technical assistance. Components of the graphical abstract were prepared using Servier Medical Art, licensed under Creative Commons Attribution 3.0 Unported License.
Disclosure statement
K.E.d.V. reports research funding from Roche/Genentech and is consultant for Macomics. C.R is an employee of Roche and owns intellectual property for the use of CSF1R-inhibitors. M.S. is an employee of Roche.
Supplementary material
Supplemental data for this article can be accessed on the publisher’s website
Additional information
Funding
References
- Binnewies M, Roberts EW, Kersten K, Chan V, Fearon DF, Merad M, Coussens LM, Gabrilovich DI, Ostrand-Rosenberg S, Hedrick CC, et al., 2018. Understanding the tumor immune microenvironment (TIME) for effective therapy. Nat. Med. 24, 541–15. 10.1038/s41591-018-0014-x
- Garner H, de Visser KE, 2020. Immune crosstalk in cancer progression and metastatic spread: a complex conversation. Nat. Rev. Immunol. 20, 1–15. 10.1038/s41577-019-0271-z
- Vonderheide RH, Domchek SM, Clark AS, 2017. Immunotherapy for breast cancer: what are we missing? Clin. Cancer Res. 23, 2640–2646. 10.1158/1078-0432.CCR-16-2569
- Bates JP, Derakhshandeh R, Jones L, Webb TJ, 2018. Mechanisms of immune evasion in breast cancer. BMC Cancer 18, 1–14. 10.1186/s12885-018-4441-3
- Bates GJ, Fox SB, Han C, Leek RD, Garcia JF, Harris AL, Banham AH, 2006. Quantification of regulatory T cells enables the identification of high-risk breast cancer patients and those at risk of late relapse. J. Clin. Oncol. 24, 5373–5380. 10.1200/JCO.2006.05.9584
- Jiang D, Gao Z, Cai Z, Wang M, He J, 2015. Clinicopathological and prognostic significance of FOXP3+ tumor infiltrating lymphocytes in patients with breast cancer: a meta-analysis. BMC Cancer 15, 727. 10.1186/s12885-015-1742-7
- Bos PD, Plitas G, Rudra D, Lee SY, Rudensky AY, 2013. Transient regulatory T cell ablation deters oncogene-driven breast cancer and enhances radiotherapy. J. Exp. Med. 210, 2435–2466. 10.1084/jem.20130762
- Kos K, Aslam MA, Van De Ven R, Jacobs H, De Gruijl TD, De Visser KE, Duits DEM, van Pul K, Hau C-S, Vrijland K, 2022. Tumor-educated Tregs drive organ-specific metastasis in breast cancer by impairing NK cells in the lymph node niche. Cell Rep. 38, 110447. 10.1016/j.celrep.2022.110447
- Kos K, de Visser KE, 2021. The multifaceted role of regulatory T cells in breast cancer. Annu. Rev. Cancer Biol. 5. 10.1146/annurev-cancerbio-042920-104912 291–310
- Liu J, Blake SJ, Yong MCR, Harjunpää H, Ngiow SF, Takeda K, Young A, O’Donnell JS, Allen S, Smyth MJ, et al., 2016. Improved efficacy of neoadjuvant compared to adjuvant immunotherapy to eradicate metastatic disease. Cancer Discov. 6, 1382–1399. 10.1158/2159-8290.CD-16-0577
- Lee W, Lee GR, 2018. Transcriptional regulation and development of regulatory T cells. Exp. Mol. Med. 50, e456. 10.1038/emm.2017.313
- Josefowicz S, Lu L-F, Rudensky AY, 2012a. Regulatory T cells: mechanisms of differentiation and function. Annu. Rev. Immunol. 30, 531–564. 10.1146/annurev.immunol.25.022106.141623
- Xu L, Kitani A, Strober W, 2010. Molecular mechanisms regulating TGF-Β-induced Foxp3 expression. Mucosal Immunol. 10.1038/mi.2010.7 3 230–238
- Zheng Y, Josefowicz S, Chaudhry A, Peng XP, Forbush K, Rudensky AY, 2010. Role of conserved non-coding DNA elements in the Foxp3 gene in regulatory T-cell fate. Nature 463, 808–812. 10.1038/nature08750
- Campbell C, Dikiy S, Bhattarai SK, Mucida D, Bucci V, Rudensky AY, Hoyos B, Hanash A, Mucida D, Bucci V, 2018. Extrathymically generated regulatory T cells establish a Niche for intestinal border-dwelling bacteria and affect physiologic metabolite balance. Immunity 48, 1245–1257. 10.1016/j.immuni.2018.04.013
- Josefowicz S, Niec RE, Kim HY, Treuting P, Chinen T, Zheng Y, Umetsu DT, Rudensky AY, 2012b. Extrathymically generated regulatory T cells control mucosal TH2 inflammation. Nature 482, 395–399. 10.1038/nature10772
- Kanamori M, Nakatsukasa H, Okada M, Lu Q, Yoshimura A, 2016. Induced regulatory T cells: their development, stability, and applications. Trends Immunol. 37, 803–811. 10.1016/j.it.2016.08.012
- Amarnath S, Mangus CW, Wang JCM, Wei F, He A, Kapoor V, Foley JE, Massey PR, Felizardo TC, Riley JL, et al., 2011. The PDL1-PD1 axis converts human TH1 cells into regulatory T cells. Sci. Transl. Med. 3, 111ra120 LP–111ra120. 10.1126/scitranslmed.3003130
- Knight D, Bogyo M, Watts C, Amarnath S, Stathopoulou C, Fowler DH, Felizardo TC, Martinez-Fabregas J, Liniany LP, Shevach EM, et al., 2018. PD-1 inhibitory receptor downregulates asparaginyl endopeptidase and maintains Foxp3 transcription factor stability in induced regulatory T cells. Immunity 49, 247–263.e7. 10.1016/j.immuni.2018.05.006
- Du H, Yi Z, Wang L, Li Z, Niu B, Ren G, 2020. The co-expression characteristics of LAG3 and PD-1 on the T cells of patients with breast cancer reveal a new therapeutic strategy. Int. Immunopharmacol. 78, 106113. 10.1016/j.intimp.2019.106113
- Olkhanud PB, Baatar D, Bodogai M, Hakim F, Gress R, Anderson RL, Deng J, Xu M, Briest S, Biragyn A, 2009. Breast cancer lung metastasis requires expression of chemokine receptor CCR4 and regulatory T cells. Cancer Res. 69, 5996–6004. 10.1158/0008-5472.CAN-08-4619
- Plitas G, Konopacki C, Wu K, Bos PD, Morrow M, Putintseva EV, Chudakov DM, Rudensky AY, 2016. Regulatory T cells exhibit distinct features in human breast cancer. Immunity 45, 1122–1134. 10.1016/j.immuni.2016.10.032
- Sugiyama D, Nishikawa H, Maeda Y, Nishioka M, Tanemura A, Katayama I, Ezoe S, Kanakura Y, Sato E, Fukumori Y, et al., 2013. Anti-CCR4 mAb selectively depletes effector-Type FoxP3+CD4+ regulatory T cells, evoking antitumor immune responses in humans. Proc. Natl. Acad. Sci. U. S. A. 110, 17945–17950. 10.1073/pnas.1316796110
- Kaplanov I, Carmi Y, Kornetsky R, Shemesh A, Shurin GV, Shurin MR, Dinarello CA, Voronov E, Apte RN, 2019. Blocking IL-1β reverses the immunosuppression in mouse breast cancer and synergizes with anti–PD-1 for tumor abrogation. Proc. Natl. Acad. Sci. U. S. A. 116, 1361–1369. 10.1073/pnas.1812266115
- Casanova-Acebes M, Dalla E, Leader AM, LeBerichel J, Nikolic J, Morales BM, Brown M, Chang C, Troncoso L, Chen ST, et al., 2021. Tissue-resident macrophages provide a pro-tumorigenic niche to early NSCLC cells. Nat. 595 7868, 578–584. 10.1038/s41586-021-03651-8
- Schmidt A, Zhang XM, Joshi RN, Iqbal S, Wahlund C, Gabrielsson S, Harris RA, Tegnér J, 2016. Human macrophages induce CD4 + Foxp3 + regulatory T cells via binding and re-release of TGF-β. Immunol. Cell Biol. 94, 747–762. 10.1038/icb.2016.34
- Qiu SQ, Waaijer SJH, Zwager MC, de Vries EGE, van der Vegt B, Schröder CP, 2018. Tumor-associated macrophages in breast cancer: innocent bystander or important player? Cancer Treat. Rev. 70, 178–189. 10.1016/j.ctrv.2018.08.010
- Derksen PWB, Liu X, Saridin F, van der Gulden H, Zevenhoven J, Evers B, van Beijnum JR, Griffioen AW, Vink J, Krimpenfort P, et al., 2006. Somatic inactivation of E-cadherin and p53 in mice leads to metastatic lobular mammary carcinoma through induction of anoikis resistance and angiogenesis. Cancer Cell 10, 437–449. 10.1016/j.ccr.2006.09.013
- Wellenstein MD, Coffelt SB, Duits DEM, van Miltenburg MH, Slagter M, de Rink I, Henneman L, Kas SM, Prekovic S, Hau CS, et al., 2019. Loss of p53 triggers WNT-dependent systemic inflammation to drive breast cancer metastasis. Nature 572, 538–542. 10.1038/s41586-019-1450-6
- Salvagno C, Ciampricotti M, Tuit S, Hau CS, van Weverwijk A, Coffelt SB, Kersten K, Vrijland K, Kos K, Ulas T, et al., 2019. Therapeutic targeting of macrophages enhances chemotherapy efficacy by unleashing type I interferon response. Nat. Cell Biol. 21, 511–521. 10.1038/s41556-019-0298-1
- Goldman M, Craft B, Hastie M, Repečka K, McDade F, Kamath A, Banerjee A, Luo Y, Rogers D, Brooks A, et al., 2020. Visualizing and interpreting cancer genomics data via the Xena platform. Nat. Biotechnol. 38, 675–678. 10.1038/S41587-020-0546-8
- Ries CH, Cannarile MA, Hoves S, Benz J, Wartha K, Runza V, Rey-Giraud F, Pradel LP, Feuerhake F, Klaman I, et al., 2014. Targeting tumor-associated macrophages with anti-CSF-1R antibody reveals a strategy for cancer therapy. Cancer Cell 25, 846–859. 10.1016/J.CCR.2014.05.016/ATTACHMENT/F3D8FA6C-225D-4C36-AFE0-D118A8052AB2/MMC1.PDF
- Hume DA, MacDonald KPA, 2012. Therapeutic applications of macrophage colony-stimulating factor-1 (CSF-1) and antagonists of CSF-1 receptor (CSF-1R) signaling. Blood. 10.1182/blood-2011-09-379214 119 1810–1820
- Mizukami Y, Kono K, Kawaguchi Y, Akaike H, Kamimura K, Sugai H, Fujii H, 2008. CCL17 and CCL22 chemokines within tumor microenvironment are related to accumulation of Foxp3+ regulatory T cells in gastric cancer. Int. J. Cancer 122, 2286–2293. 10.1002/IJC.23392
- Ushio A, Arakaki R, Otsuka K, Yamada A, Tsunematsu T, Kudo Y, Aota K, Azuma M, Ishimaru N, 2018. CCL22-producing resident macrophages enhance T cell response in Sjögren’s syndrome. Front. Immunol. 9, 2594. 10.3389/FIMMU.2018.02594
- Loyher PL, Rochefort J, Baudesson De Chanville C, Hamon P, Lescaille G, Bertolus C, Guillot-Delost M, Krummel MF, Lemoine FM, Combadière C, et al., 2016. CCR2 influences T regulatory cell migration to tumors and serves as a biomarker of cyclophosphamide sensitivity. Cancer Res. 76, 6483–6494. 10.1158/0008-5472.CAN-16-0984
- Mailloux AW, Young MRI, 2010. Regulatory T-cell trafficking: from thymic development to tumor-induced immune suppression. Crit. Rev. Immunol. 30, 435–447. 10.1615/critrevimmunol.v30.i5.30
- Wang D, Yang L, Yu W, Wu Q, Lian J, Li F, Liu S, Li A, He Z, Liu J, et al., 2019. Colorectal cancer cell-derived CCL20 recruits regulatory T cells to promote chemoresistance via FOXO1/CEBPB/NF-κB signaling. J. Immunother. Cancer 7, 215. 10.1186/s40425-019-0701-2
- Wang L, Simons DL, Lu X, Tu TY, Solomon S, Wang R, Rosario A, Avalos C, Schmolze D, Yim J, et al., 2019. Connecting blood and intratumoral Treg cell activity in predicting future relapse in breast cancer. Nat. Immunol. 20, 1220–1230. 10.1038/s41590-019-0429-7
- Tuit S, Salvagno C, Kapellos TS, De Visser KE, Oestreich M, Schultze JL, Hau C-S, Seep L, Oestreich M, Klee K, 2019. Transcriptional signature derived from murine tumor-associated macrophages correlates with poor outcome in breast cancer patients article transcriptional signature derived from murine tumor-associated macrophages correlates with poor outcome in breast cancer patients. Cell Rep. 29. 10.1016/j.celrep.2019.09.067 1221–1235.e5
- Liberzon A, Birger C, Thorvaldsdóttir H, Ghandi M, Mesirov JP, Tamayo P, 2015. The molecular signatures database hallmark gene set collection. Cell Syst. 1, 417–425. 10.1016/j.cels.2015.12.004
- Francisco LM, Salinas VH, Brown KE, Vanguri VK, Freeman GJ, Kuchroo VK, Sharpe AH, 2009. PD-L1 regulates the development, maintenance, and function of induced regulatory T cells. J. Exp. Med. 206, 3015–3029. 10.1084/jem.20090847
- Huang AC, Orlowski RJ, Xu X, Mick R, George SM, Yan PK, Manne S, Kraya AA, Wubbenhorst B, Dorfman L, et al., 2019. A single dose of neoadjuvant PD-1 blockade predicts clinical outcomes in resectable melanoma. Nat. Med. 25, 454–461. 10.1038/s41591-019-0357-y
- Kamada T, Togashi Y, Tay C, Ha D, Sasaki A, Nakamura Y, Sato E, Fukuoka S, Tada Y, Tanaka A, et al., 2019. PD-1(+) regulatory T cells amplified by PD-1 blockade promote hyperprogression of cancer. PNAS 116, 9999–10008. 10.1073/pnas.1822001116
- Kumagai S, Togashi Y, Kamada T, Sugiyama E, Nishinakamura H, Takeuchi Y, Vitaly K, Itahashi K, Maeda Y, Matsui S, et al., 2020. The PD-1 expression balance between effector and regulatory T cells predicts the clinical efficacy of PD-1 blockade therapies. Nat. Immunol. 21, 1346–1358. 10.1038/s41590-020-0769-3
- Peligero C, Argilaguet J, Güerri-Fernandez R, Torres B, Ligero C, Colomer P, Plana M, Knobel H, García F, Meyerhans A, 2015. PD-L1 blockade differentially impacts regulatory T cells from HIV-infected individuals depending on plasma viremia. PLoS Pathog. 11. 10.1371/JOURNAL.PPAT.1005270
- Kurachi M, Kurachi J, Chen Z, Johnson J, Khan O, Bengsch B, Stelekati E, Attanasio J, McLane LM, Tomura M, et al., 2017. Optimized retroviral transduction of mouse T cells for in vivo assessment of gene function. Nat. Protoc. 12, 1980–1998. 10.1038/nprot.2017.083
- Brinkman EK, Chen T, Amendola M, Van Steensel B, 2014. Easy quantitative assessment of genome editing by sequence trace decomposition. Nucleic Acids Res. 42, e168–e168. 10.1093/nar/gku936
- Ghali JR, Alikhan MA, Holdsworth SR, Kitching AR, 2017. Induced regulatory T cells are phenotypically unstable and do not protect mice from rapidly progressive glomerulonephritis. Immunology 150, 100–114. 10.1111/imm.12671
- Koenecke C, Czeloth N, Bubke A, Schmitz S, Kissenpfennig A, Malissen B, Huehn J, Ganser A, Förster R, Prinz I, 2009. Alloantigen-specific de novo-induced Foxp3+ Treg revert in vivo and do not protect from experimental GVHD. Eur. J. Immunol. 39, 3091–3096. 10.1002/eji.200939432
- Su S, Liao J, Liu J, Huang D, He C, Chen F, Yang LB, Wu W, Chen J, Lin L, et al., 2017. Blocking the recruitment of naive CD4+ T cells reverses immunosuppression in breast cancer. Cell Res. 27, 461–482. 10.1038/cr.2017.34
- DeNardo DG, Ruffell B, 2019. Macrophages as regulators of tumour immunity and immunotherapy. Nat. Rev. Immunol. 10.1038/s41577-019-0127-6 19 369–382
- Tan Y, Wang M, Zhang Y, Ge S, Zhong F, Xia G, Sun C, 2021. Tumor-associated macrophages: a potential target for cancer therapy. Front. Oncol. 0, 2201. 10.3389/FONC.2021.693517
- Campesato LF, Budhu S, Tchaicha J, Weng CH, Gigoux M, Cohen IJ, Redmond D, Mangarin L, Pourpe S, Liu C, et al., 2020. Blockade of the AHR restricts a Treg-macrophage suppressive axis induced by L-Kynurenine. Nat. Commun. 111 11, 1–11. 10.1038/s41467-020-17750-z
- Ceci C, Atzori MG, Lacal PM, Graziani G, 2020. Targeting tumor-associated macrophages to increase the efficacy of immune checkpoint inhibitors: a glimpse into novel therapeutic approaches for metastatic melanoma. Cancers (Basel). 10.3390/cancers12113401 12 3401
- Sanin DE, Prendergast CT, Mountford AP, 2015. IL-10 production in macrophages is regulated by a TLR-driven CREB-mediated mechanism that is linked to genes involved in cell metabolism. J. Immunol. 195, 1218–1232. 10.4049/jimmunol.1500146
- Amaia M-U, Ece K, Gael B, Chiara C, Alan G, Bruno T, Nadine Z, Sina N, Ioanna K, Martina S,H,RC, et al., 2021. Overcoming microenvironmental resistance to PD-1 blockade in genetically engineered lung cancer models. Sci. Transl. Med. 13, eabd1616. 10.1126/scitranslmed.abd1616
- Chen X, Fosco D, Kline DE, Meng L, Nishi S, Savage PA, Kline J, 2014. PD-1 regulates extrathymic regulatory T-cell differentiation. Eur. J. Immunol. 44, 2603–2616. 10.1002/eji.201344423
- DiDomenico J, Lamano J, Oyon B, Li D, Veliceasa Y, Kaur D, Ampie G, Choy L, Lamano W, Jason B, 2018. The immune checkpoint protein PD-L1 induces and maintains regulatory T cells in glioblastoma. Oncoimmunology 7, e1448329–e1448329. 10.1080/2162402X.2018.1448329
- Kos K, van Baalen M, Meijer DA, de Visser KE, 2019. Flow cytometry-based isolation of tumor-associated regulatory T cells and assessment of their suppressive potential, in: Methods in Enzymology. 10.1016/bs.mie.2019.07.035 632 259–281
- Heinen AP, Wanke F, Moos S, Attig S, Luche H, Pal PP, Budisa N, Fehling HJ, Waisman A, Kurschus FC, 2014. Improved method to retain cytosolic reporter protein fluorescence while staining for nuclear proteins. Cytom. Part A 85, 621–627. 10.1002/cyto.a.22451
- Subramanian A, Tamayo P, Mootha VK, Mukherjee S, Ebert BL, Gillette MA, Paulovich A, Pomeroy SL, Golub TR, Lander ES, et al., 2005. Gene set enrichment analysis: a knowledge-based approach for interpreting genome-wide expression profiles. Proc. Natl. Acad. Sci. U. S. A. 102, 15545–15550. 10.1073/pnas.0506580102
- Doornebal CW, Klarenbeek S, Braumuller TM, Klijn CN, Ciampricotti M, Hau C-S, Hollmann MW, Jonkers J, de Visser KE, 2013. A preclinical mouse model of invasive lobular breast cancer metastasis. Cancer Res. 73, 353 LP – 363. 10.1158/0008-5472.CAN-11-4208
- Aslam MA, Alemdehy MF, Hao B, Krijger PHL, Pritchard CEJ, De Rink I, Muhaimin FI, Nurzijaha I, van Baalen M, Kerkhoven RM, et al., 2020. The Ig heavy chain protein but not its message controls early B cell development. Proc. Natl. Acad. Sci. U. S. A. 117, 31343–31352. 10.1073/pnas.2004810117