
ABSTRACT
The extracellular matrix component biglycan (BGN) plays an essential role in various physiological and pathophysiological processes. A deficient BGN expression associated with reduced immunogenicity was found in HER-2/neu-overexpressing cells. To determine whether BGN is suppressed by oncogene-driven regulatory networks, the expression and function of BGN was analyzed in murine and human BGNlow/BGNhigh K-RASG12V-transformed model systems as well as in different patients’ datasets of colorectal carcinoma (CRC) lesions. K-RAS-mutated CRC tissues expressed low BGN mRNA and protein levels when compared to normal colon epithelial cells, which was associated with a reduced patients’ survival. Transfection of BGN in murine and human BGNlow K-RAS-expressing cells resulted in a reduced growth and migration of BGNhigh vs BGNlow K-RAS cells. In addition, increased MHC class I surface antigens as a consequence of an enhanced antigen processing machinery component expression was found upon restoration of BGN, which was confirmed by RNA-sequencing of BGNlow vs. BGNhigh K-RAS models. Furthermore, a reduced tumor formation of BGNhigh versus BGNlow K-RAS-transformed fibroblasts associated with an enhanced MHC class I expression and an increased frequency of tumor-infiltrating lymphocytes in tumor lesions was found. Our data provide for the first time an inverse link between BGN and K-RAS expression in murine and human K-RAS-overexpressing models and CRC lesions associated with altered growth properties, reduced immunogenicity and worse patients’ outcome. Therefore, reversion of BGN might be a novel therapeutic option for K-RAS-associated malignancies.
Introduction
Proteoglycans (PGs) are structurally diverse constituents of the extracellular matrix (ECM) and cell surface and have recently emerged as novel biomarkers and molecular players of cancer diagnosis and therapy by regulating signaling cascades, cytoskeleton configuration, autophagy, and angiogenesis.Citation1,Citation2 In malignant tumors and their tumor microenvironment (TME), the expression of PGs is modulated and affects growth properties, cell adhesion, inflammation, differentiation, and angiogenesis.Citation3–5 In this context, the altered composition and function of the ECM and their binding receptors have recently been shown to impact tumor initiation and progression.Citation6 Small leucine-rich proteoglycans (SLRPs) are a protein family composed of 18 members that are present in the ECM of a variety of tissues, including bone, cartilage, and tendon, and contain leucine-rich repeats (LLR).Citation7 BGN is a member of this family and interacts with the transforming growth factor (TGF)-β, with extracellular receptors, such as the toll-like receptor (TLR)-2 and −4 and the epidermal growth factor receptor (EGF-R).Citation8–11 It is differentially expressed in various malignant tumor entitiesCitation5,Citation12 and affects molecular events relevant to either tumor progressionCitation13–15 or suppression depending on the cancer type analyzed.Citation9,Citation16,Citation17 This dual role in tumorigenicity appears to be mediated, at least partially, by its ability to influence both oncogenic and inflammatory pathways due to its binding to TGF-β1 and TLRs, respectively.Citation8,Citation17–19 In pancreatic cancer cells, BGN has been shown to be induced by TGF-β via the SMAD4/DPC4 pathway, which is accompanied by growth inhibition of tumor cells suggesting a tumor suppressive function of SMAD4/DPC4.Citation8 In addition, an inverse correlation between BGN expression and the level of K-RAS and HER-2/neu expression in human tumor cells and/or in in vitro models of oncogenic transformation was found.Citation17,Citation20,Citation21
The loss of BGN expression correlated with the malignant phenotype of HER-2/neu-transformed human and murine model systems in vitro. This was accompanied by an increased cell proliferation, migration and invasion rate as well as an upregulated TGF-β signaling, which was directly associated with reduced immunogenicity as shown by enhanced tumor growth in vivo and downregulation of MHC class I APM component and MHC class I surface expression.Citation17
In general, RAS proteins control signaling pathways representing key regulators of malignant transformation, thereby leading to increased proliferation and malignant transformation.Citation22 In human tumors of distinct origin including CRC, K-RAS is frequently overexpressed due to activating mutations, which is often associated with a poor prognosis and worse clinical outcome of CRC patients. In addition, there is growing evidence that K-RAS transformation causes immune evasion mediated by a decrease or loss of immune stimulatory molecules including the heavy chain (HC) of the human leukocyte antigen (HLA) molecules, β2-microglobulin (β2-m) and APM components, by an upregulation of non-classical HLA class I antigens, such as HLA-G and –E, and of checkpoint ligands, like e.g. PD-L1, as well as by changes in the composition of the TME.Citation23–29 In CRC, the K-RAS status has been shown to be directly associated with a decreased HLA class I expression thereby subsequently impairing the antigen presentation ability of CRC cells.Citation30 Despite the fact that molecular-targeted therapies have significantly improved the survival of CRC patients with therapeutically targetable lesions compared to conventional chemotherapy,Citation31,Citation32 immunotherapies have still a limited success in this tumor entity, which might be explained by the development of different strategies by CRC to escape immune surveillance.Citation33,Citation34 Therefore, one primary goal is to restore tumor immunogenicity by boosting HLA class I and inhibiting PD-L1 surface expression in tumors. Identifying key molecules or substances overriding these tumor intrinsic escape routes will help improve durable tumor rejection. So far, neither immune therapeutics nor therapeutic agents directly targeting wild type (wt) RAS have been clinically approved for the treatment of K-RAS-associated diseases.Citation35–38 Direct inhibition of mutant RAS by allele-specific inhibitors and approaches targeting RAS-activating pathways or RAS effector pathways represent promising strategies.Citation39 For example, Sotorasib, a small molecule inhibiting K-RASG12C activity, has been shown to lead to a durable tumor regression in K-RASG12C bearing murine tumors and to anti-cancer activity in patients harboring this K-RAS mutation.Citation40,Citation41 There exists evidence that the phosphotyrosine kinase receptors EGF-R and HER-2/neu are upregulated in breast epithelial cells.Citation42 Interestingly, in a ductal pancreatic epithelial model, a cooperation of oncogenic RAS and loss of SMAD4 signaling resulted in an upregulation of the ERB receptor expression due to protein stabilization and increased transcription.Citation43
Based on the ability of BGN to modulate the HER-2/neu-transformed phenotype and enhance tumor immunogenicity, it was hypothesized that BGN might provide a molecular therapeutic option for malignancies with K-RAS mutations.Citation17 Therefore, the expression and function of BGN were determined in model systems of murine K-RAS-transformed fibroblasts as well as in human CRC cells with known K-RAS status regarding its role in in vitro and/or in vivo growth properties, MHC class I-mediated immunogenicity, immune cell recognition as well as CRC patients’ survival.
Materials and methods
Cell lines and transfectants
The human CRC cell lines expressing wild type (wt) (RKO) or mutated (mut) (SW480, K-RASG12V),Citation44 the colorectal epithelial cell line CoN and murine NIH3T3 fibroblasts were purchased from the American Tissue culture collection. The NIH3T3 K-RASG12V-transformed derivative, termed BGNlow K-RAS, was generated as described previously.Citation20
The generation of the BGN overexpressing murine K-RAS transformed fibroblasts, named BGNhigh K-RAS cells (clone BGN1, BGN2) and vector controls (BGNlow/vector K-RAS) have previously been described.Citation17,Citation20 The human CRC cell lines were stably transfected with the vector backbone alone or a BGN expression vector according to Recktenwald and coauthors.Citation20
The NIH3T3 cells and their derivatives as well as the CoN cells were maintained in Eagles modified essential medium (EMEM, Lonza, Basel, Switzerland), whereas the human CRC cell lines in Dulbecco’s modified Eagles medium (DMEM, Gibco) supplemented with 10% fetal calf serum (FCS), 2 mM glutamine, 100 U/ml penicillin and 100 µg/ml streptomycin (PAA; Pasching, Austria) and cultured at 37°C in 5% CO2 humified air. All stable BGN transfectants (BGNhigh K-RAS) and vector controls (BGNlow/vector) were maintained in complete DMEM or EMEM, respectively, supplemented with 1 mg/ml G418 (PAA).
RNA isolation and real time quantitative RT-PCR
Total cellular RNA was isolated using the nucleo spin RNA II kit (Macherey-Nagel, Dueren, Germany), before 2 µg total RNA was transcribed into cDNA and subjected to PCR as previously described.Citation45 The target-specific primers used for quantitative PCR are listed in Supplementary Table 1.
Luciferase (luc) reporter assay for determination of the APM promoter activity
TAP1/LMP2, TAP2 and TPN promoter sequences were amplified from genomic DNA and then cloned into the pGl3 luciferase (luc) vector (Promega, Fitchburg, USA) as recently described.Citation46 For transient transfections, 1 × 10⁵ cells were incubated overnight in 100 µL OptiMEM (Invitrogen) followed by transfection with 0.3 µg of the respective promoter constructs and 0.016 µg of the β-galactosidase (β-gal) vector using Lipofectamine 2000 (Invitrogen, Waltham, USA) according to the manufacturer’s instructions. Forty-eight hours after transfection, the luc activity was determined with the luc substrate (Promega) using a luminometer and normalized to the transfection efficiency determined by β-galactosidase (ß-gal) enzyme activity.Citation47
Western blot analysis
For Western blot analysis, 5 × 10⁶ cells were harvested and proteins were solubilized as described.Citation48 30 µg protein/lane was separated in 10% SDS-PAGE gels, transferred onto nitrocellulose membranes (Schleicher & Schuell, Dassel, Germany) and stained with Ponceau S as previously described.Citation45 Membranes were incubated overnight at 4°C with a primary polyclonal antibodies directed against BGN (Proteintech, Rosemont, IL, USA) and K-RAS (Cell Signaling Technology, Danvers, USA) and monoclonal antibodies directed against β-actin (Sigma-Aldrich, St. Louis, USA) and/or glyceraldehyde-3-phosphate dehydrogenase (GAPDH) (Cell Signaling Technology), respectively, followed by incubation for 1 h with a horseradish peroxidase (HRP) linked secondary antibody (Ab, Cell Signaling Technology) and developed using the ECL method. Chemiluminescence signals were visualized with the Lumi-Light Western Blotting Substrate (Roche Diagnostics) and recorded with a LAS3000 system (Fuji, Tokyo, Japan). To quantify the protein expression, the appropriate area of the signal was integrated using an AIDA image analyzer (Raytest, Straubenhardt, Germany) and subsequently normalized to β-actin or GAPDH.
Cell proliferation, migration and Anchorage-independent growth
The growth characteristics of murine and human BGNlow and BGNhigh K-RAS-transformed cells was determined using distinct methods. The cell proliferation was analyzed at different time points using the cell proliferation kit II (Roche Applied Science, Penzberg, Germany) and measuring the conversion of the tetrazolium salt (XTT) to formazan on a spectrometer (MRX, Dynex, Lincon, UK).Citation21
The scratch assay mimicking the directional cell migration was employed by scratching a confluent cell monolayer with a Pasteur pipette and monitoring the wound healing according to Rodriguez and coauthors.Citation49 Images were captured before and at different time points after scratching over 24 hours. The images were compared and the migration rates were quantified using the Metaview software (Biovision Technologies, Exton, USA).Citation50
Next to wound healing assays, the cell migration was determined by plating 5 × 10⁴ cells into a trans-well chamber using a gradient of 0.5 to 10% FCS as attractant.Citation45 After 24 hours, the number of migrated cells was determined with the Cell Titer Glo Luminescence cell viability assay (Promega) according to the manufacturer’s instructions. The luminescence was normalized against the luminescence of 5 × 10⁴ cells directly seeded into the bottom of the trans-well plate.
The anchorage-independent growth was determined by seeding 2 × 10⁴ cells/35-mm plate in 0.3% agar in respective complete medium with 20% FBS and incubated at 37°C for 28 days.Citation45 The number of colonies was determined by staining with iodonitrotetrazolium chloride (Sigma).
Flow cytometry
Following mAbs were used for flow cytometry: the phycoerythrin-labeled anti-H-2Ld/q (Cedarlane Laboratories LTD, Burlington, Canada) and, the respective isotype mouse immunoglobulin (Beckman Coulter, Brea, USA) for staining murine cells and the FITC-labeled HLA class I-specific mAb (Beckman Coulter) and lgG2a isotype control (Beckman Coulter) for staining of human cells.
Flow cytometric analysis was performed as described.Citation48 Briefly, 5 × 10⁵ cells were incubated with the appropriate amount of antibodies at 4°C for 30 minutes before the stained cells were measured on a NAVIOS (Becton Dickinson, Franklin Lakes, USA) and subsequently analyzed with the Kaluza software (Beckman Coulter). The data are represented as mean specific fluorescence intensity (MFI) from three independent experiments.
For cell cycle analysis, 1 × 10⁶ cells were cultured in 0.1% FCS for 48 h, followed by their cultivation in 10% FCS. The cells were then fixed with ice-cold ethanol (70%) and stained with propidium iodide (Sigma). Analyses were performed by flow cytometry using the Kaluza software (Beckman Coulter).
In addition, blood from tumor-bearing mice was analyzed by flow cytometry after lysis of erythrocytes using erythrocyte lysis buffer (c-c-pro GmbH, Oberdorla, Germany). Mononuclear cells were incubated with the rat anti-mouse CD16/32 (Beckman Coulter, Brea, CA, USA) to block nonspecific antibody binding. Anti-CD4 PeCy7 (eBioscience/ThermoScientific), anti-CD8α FITC (Beckman Coulter) and anti-CD25 eFluor450 (eBioscience/ThermoScientific) were used for staining of T cells. Before acquisition on a NAVIOS flow cytometer (Beckman Coulter), the cells were labeled with propidium iodide to exclude dead cells. Analysis was performed using the Kaluza software package (Beckman Coulter).
In vivo tumor growth and specimen collection
All animal experiments described were approved by the Regional Council of the Medical Faculty at the Martin Luther University Halle-Wittenberg in Halle (Germany) and animals were maintained in accordance to the Guidelines for the Care and Use of Laboratory Animals. Adult (2-3-month old, 20 ± 4 g body weight, male and female), specific pathogen-free inbred immune-competent DBA/10IaHsd mice (Harlan Laboratories) were used for the analysis of tumor formation. Ten mice/group were subcutaneously (s.c.) injected with 1 × 10⁶ fibroblasts (BGNlow K-RAS, BGNhigh K-RAS, BGNvector K-RAS) in 200 µL PBS/mouse into the left lateral abdominal wall. The right lateral abdominal wall was used for sham injections with PBS. The tumor diameter was monitored three times a week by caliper measurements of the greatest longitudinal diameter. The mice were sacrificed between 3 and 6 weeks after injection, the tumors excised and stored in paraffin or fresh frozen in liquid nitrogen.
In addition, between days 36 and 41, tumor-bearing mice were anesthetized with 2.5% (v/v) isofluran and blood was collected by cardiac puncture into heparin-containing tubes and subjected to flow cytometry as described above.
Immunohistochemical analysis
For staining with anti-BGN and anti-CD3 antibodies, 5 µm tissue sections of the murine BGNlow and BGNhigh K-RAS tumors were deparaffinized with xylol and transferred via alcohol into aqua dest (Elix 5 Filter System, Merck-Millipore, Burlington, USA). Antigen decloaking for mAb CD3 was performed by steaming the slides with a preheated TEDTA buffer (ZUC029-500, 1:10 dissolved, Zytomed Systems, Bargteheide, Germany) at pH 6.0 at 98°C for 30 minutes in an oven (Braun, type 3216). No antigen decloaking was required for staining with the BGN Ab. The slides were blocked for 7–10 minutes with 3% H2O2. Following a rinsing step with washing buffer (ZUC202-2500, 1:20 solution, Zytochem Plus HRP Kit/Plus Polymer System, Zytomed Systems), the primary Abs were added dropwise on the tissue area. For BGN staining, the primary Ab 16409-1-AP (Proteintech, Planegg, Germany) was incubated at a 1:50 dilution for 60 minutes at room temperature (RT). For CD3 detection, the tissues were stained with the primary mAb SP7 (RM-9107-S, Thermo-Fisher) at a 1:200 dilution for 60 minutes at RT. After washing off the primary Ab the slides were incubated with an HRP-polymer secondary Ab (POLHRP-100, Zytochem Plus HRP Polymer System Mouse/Rabbit, Zytomed Systems) for 15 (BGN) and 30 minutes (CD3), respectively, at RT. After a washing step, the epitopes were visualized with DAB (10 minutes of DAB Substrate Kit, Zytomed Systems) followed by a counterstain with hemalaun (Dr. K. Hollborn & Sons, Leipzig, Germany) for 30 seconds, then transferred into xylol and slip covered (Eukitt, ORSAtec). Negative controls were obtained by omitting the primary Ab. Microscopic analysis of the staining was independently performed by two pathologists (CW, DB). The staining intensity of BGN expression was scored as absent, weak, moderate, or strong. The distribution of intra-tumoral CD3+ T cells was classified as homogenous or non-homogenous, while their density was scored as the number of CD3+ cells per 10 high power fields (HPF, 400x).
CD107a degranulation assay
Human peripheral blood mononuclear cells (PBMC) were purified from healthy donor buffy coat preparations by gradient density centrifugation. Cells were stimulated for 18 h with 1 ng/ml IL-12, 5 ng/ml IL-15 (both from Immunotools, Friesoythe, Germany) and 50 ng/ml IL-18 (Biovision, Milpitas, CA, USA) in X–vivo15 (Lonza) medium followed by their incubation with target cells for a CD107a degranulation assay. The anti-CD107a Ab was added after 1 h of co-culture and after 4 h the cells were stained with Ab directed against CD3, CD16 and CD56 to identify NK cells and determine total NK cell activity.
mRNA sequencing and data analyses
Library construction, RNA sequencing (RNAseq; Illumina platform, San Diego, USA), generation of fragments per kilobase of transcription mapped (FPKM) reads and initial set of differential genes were performed by Novogene Company Limited (UK). Bioinformatics was performed according to the procedures described in previous studies.Citation51 Reference genome and gene model annotation files were directly downloaded from genome website browser (NCBI/UCSC/Ensembl). To quantify gene expression levels, HTSeq v0.6.1 was used to count the read numbers mapped of each gene. FPKM of each gene was calculated based on the length of the gene and read counts mapped to this gene.Citation52
Initial analysis of differential expression between BGNlow and BGNhigh SW480 cells (two biological replicates) was performed by Novogene using the DESeq2 R package (2_1.6.3). DESeq2 provides statistical routines for determining differential expression in digital gene expression data using a model based on the negative binomial distribution. The resulting p-values were adjusted using the Benjamini and Hochberg’s approach for controlling the False Discovery Rate (FDR). Genes with an adjusted p-value (Padj) < 0.05 found by DESeq2 were assigned as differentially expressed. Gene Ontology (GO) enrichment analysis of differentially expressed genes was implemented by the clusterProfiler R package, in which gene length bias was corrected. GO terms with corrected Padj value < 0.05 were considered significantly enriched by differential expressed genes.
Bioinformatics analyses of public datasets
The different datasets used in this publication were described in detail in the Supplementary Table 2. The CRC data (GEO accession: gse33114) comprising 108 CRC samples were employed.Citation53 K-RAS mutation and BGN expression data were downloaded from the TCGA colorectal Adenocarcinoma (COAD) dataset of 276 samples. 182 COAD patients were found to have BGN expression data, which were associated to the mutation pattern of K-RAS, H-RAS, N-RAS and B-RAF in CRC lesions.
For the correlation of BGN expression with the survival of CRC patients, the TCGA COAD (PanCancer Atlas) expression data comprising of in total 551 CRC patients, from which 310 samples expressed BGN, were analyzed using Xena, the functional genomics and analysis platform developed by the University of California at Santa Cruz (https://xena.ucsc.edu).Citation54
The Clinical Proteomic Tumor Analysis Consortium (CPTAC)Citation55 defined proteome-based molecular tumor subtypes using liquid chromatography-tandem mass spectrometry (LC-MS/MS). The CPTAC Colon Cancer Confirmatory Study consisting of 97 primary CRCs and 100 normal colon epithelium,Citation56 but lacking information of RAS mutations was analyzed for BGN protein expression and data from normal colon epithelium vs. CRC tumor samples were correlated using UALCAN.Citation57 The methods for analyzing CPTAC-TCGA profiling data obtained from CRC tumors have been previously described.Citation57
Statistical analysis
Microsoft Excel-Office 365 and R (programming language) were used for Student's t-test and one-way ANOVA. A p-value of < 0.05 was considered as significant (*, p < .05; **, p < .01; ***, p < .001).
Results
Correlation of BGN expression with the K-RAS status of CRC lesions and patients’ survival
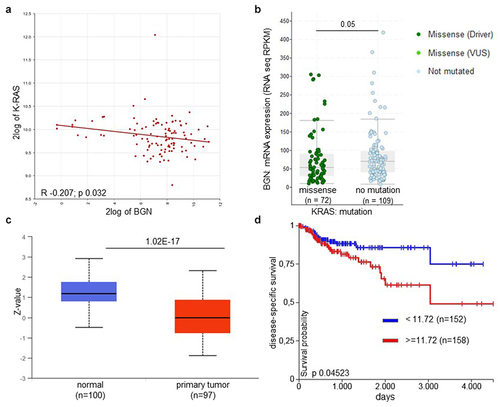
Bioinformatics analysis using a dataset of 108 CRC samplesCitation53 demonstrated an inverse correlation between the mRNA expression of K-RAS and BGN in CRC lesions (R − 0.207; p 0.023) (; ). In the TCGA COAD dataset, BGN expression was downregulated, which was more pronounced in the mut K-RAS (n = 73) vs. wt K-RAS overexpressing (n = 109) CRC lesions (=.05). Furthermore, BGN expression was also downregulated in N-RAS- (Supplementary Figure 1A, p = .095), but not in B-RAF-mutated CRC samples (Supplementary Figure 1B, p = .052). It is noteworthy that genetic alterations were found in K-RAS in 41%, in N-RAS in 11% and in B-RAF in 10% of CRC specimen of the COAD database analyzed consisting of 276 CRC lesions. This was confirmed by the analysis of a TCGA data set comprising of 551 CRC lesions demonstrating a loss or strong downregulation of BGN expression, while high BGN mRNA levels were expressed in normal colon epithelium. Similar results were obtained by the analysis of the CPTAC database demonstrating a reduced or loss of BGN protein expression in primary K-RAS-overexpressing CRC samples compared to normal colon epithelium (). Since both COAD and CPTAC analysis were performed on bulk specimen, it cannot be ruled out whether the differences found in the BGN mRNA and protein expression levels with an entire log2 range between 9.2 to 14 are due to K-RAS-mediated downregulation or to a shift in the quantity of normal stromal cells versus malignant cells. The impaired BGN expression appear to have clinical relevance, since K-RAS transformation and downregulated BGN expression were correlated with a reduced disease-specific (), progression-free survival (PFS; Supplementary Figure 1A) as well as overall survival (OS) of CRC patients (Supplementary Figure 1B).
Table 1. Correlation of K-RAS and BGN expression to the expression of selected immune modulatory genes
Figure 1. Increased correlation and clinical relevance of K-RAS and BGN expression in CRC lesions.
K-RAS-mediated downregulation of BGN expression in murine and human in vitro models and its restoration
The in silico data of CRC lesions with known K-RAS status were translated into in vitro cell culture systems by analyzing the constitutive BGN expression in the human normal colon epithelial cell line CoN, in two human CRC cell lines expressing high levels of human mut K-RAS (SW480) or wt K-RAS (RKO) as well as in a murine model of K-RAS transformation of murine NIH3T3 fibroblasts.Citation20 The K-RAS expression in the different model systems was determined with a K-RAS-specific Ab, for which a specific staining has been recently described.Citation48,Citation58 Both RKO and SW480 cells with high K-RAS expression constitutively expressed low to marginal BGN mRNA () and protein levels (), while CoN cells expressing low/marginal amounts of K-RAS exhibited high BGN expression levels. This inverse expression of K-RAS and BGN was also confirmed in murine NIH3T3 fibroblasts and their K-RAS-transformed counterparts. As shown in , a strong downregulation of BGN mRNA expression was found in K-RAS-expressing murine fibroblasts compared to parental NIH3T3 cells, which was accompanied by diminished BGN protein expression levels.
Figure 2. Basal and restored BGN expression in CRC and K-RAS-transformed fibroblasts.
In the next step, BGN expression was reconstituted in both BGNlow K-RAS CRC cell lines and in murine BGNlow K-RAS-transformed fibroblasts by stable transfection with a BGN expression vector, while transfection with a vector backbone alone (BGNlow/vector K-RAS cells) served as a control. BGN transfectants of CRC cells displayed high BGN mRNA and protein expression levels, as evaluated by qPCR (Supplementary Figure 2A) and Western blot analysis (). Interestingly, the BGNhigh K-RAS-transformed fibroblasts (BGN1, BGN2) expressed BGN mRNA and protein levels comparable to that of untransformed BGNhigh NIH3T3 cells (). The overexpression of BGN in BGNlow K-RAS-transformed fibroblasts was also associated with an altered morphology (data not shown). It is noteworthy that silencing of BGN in parental BGNhigh NIH3T3 cells by shBGN significantly inhibited BGN expression.Citation17
Effect of BGN reconstitution in BGNlow K-RAS models on the expression patterns and immunogenic features
Since BGN expression has been demonstrated to increase MHC class I surface expression in HER-2/neu-transformed cells,Citation17 it was determined whether BGN overexpression also restored the MHC class I surface and APM component expression in K-RAS-overexpressing CRC cells and K-RAS-transformed fibroblasts using flow cytometry and qPCR analysis. As shown in , BGN overexpression caused an upregulation of HLA class I surface expression on both CRC cell lines, which was accompanied by an increased expression of major MHC class I APM components including TAP1, TAP2, TAPBP, PSMB9 (LMP2), PSMB8 (LMP7), PSMB10 (LMP10), HLA class I HC and the transcription factor NLCR5, as representatively shown for the BGNlow/ BGNhigh SW480 model (; Supplementary Figure 2B).
Figure 3. BGN-mediated induction of MHC class I APM component expression in K-RAS model systems and altered NK cell responses.
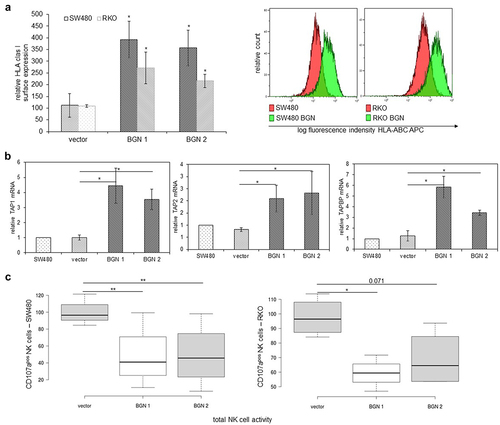
Figure 3. Continued.
The BGN-mediated upregulation of HLA class I surface expression in SW480 and RKO cells affected their interaction with immune cells. NK cells from healthy donors displayed a reduced capability to degranulate in response to co-culture with BGNhigh SW480 and RKO cells, respectively (), which correlated with their BGN-mediated upregulation of the MHC class I surface expression.
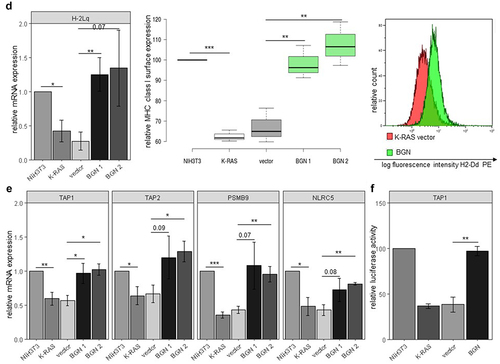
Similar results were obtained for BGNlow and BGNhigh K-RAS-transformed fibroblasts. BGN overexpression in murine BGNlow K-RAS-transformed fibroblasts caused an upregulation of MHC class I surface expression (), which was accompanied by an enhanced expression of the major MHC class I APM components (; Supplementary Figure 2C). To get insights into the mode of the BGN-mediated increase of MHC class I APM components, luciferase reporter assays using APM promoter luc constructs were performed demonstrating an increased promoter activity of selected APM components such as TAP1, TAP2, and LMP2 in BGNhigh vs BGNlow K-RAS-transformed fibroblasts (; Supplementary Figure 2D).
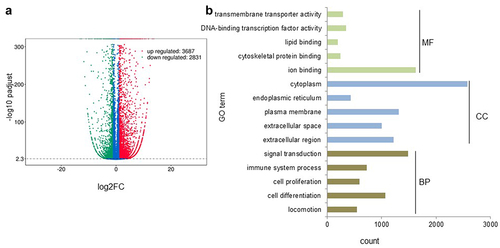
Furthermore, RNAseq analysis revealed a distinct expression pattern between BGNlow and BGNhigh K-RAS SW480 cells with changes in more than 6500 transcripts using a threshold of >2 and <2 fold expression, from which 3687 genes were upregulated and 2831 genes were downregulated by BGN overexpression (). These differentially expressed genes were annotated to various GO terms regarding their molecular function, cellular component and biological process (). Furthermore, the most deregulated genes by BGN reconstitution were bioinformatically analyzed regarding their function. Using this approach, an upregulation of all major HLA class I APM components was found in BGNhigh compared to BGNlow SW480 cells () confirming the qPCR and Western blot data from the murine and human BGNlow K-RAS vs. BGNhigh K-RAS cell models. Next to the genes involved in the MHC class I presentation, BGN overexpression downregulated genes involved in proliferation and cell cycle, while upregulated genes were involved in immune response and cellular senescence (Supplementary Table 3). The deregulated expression of selected genes was validated by qPCR in BGNlow vs BGNhigh cell models as representatively shown for TUBB, SNRPD3, MAD2L1, CENPF, ZFP36L1, GABRAPL1 and TNFRSF10B (Supplementary Figure 3).
Figure 4. Distinct gene expression profiles of BGNlow vs. BGNhigh K-RAS-overexpressing SW480 cells.
Impact of BGN reconstitution in murine K-RAS-transformed cells on growth properties
To determine whether the restored BGN expression not only affects the expression of proliferation-relevant genes, but rather influences the growth characteristics, cell proliferation, migration and invasion of murine BGNlow vs. BGNhigh K-RAS-transformed fibroblasts and/or human BGNlow vs BGNhigh CRC cell lines were compared (). As expected, BGNlow K-RAS-transformed fibroblasts showed an increased proliferative capacity accompanied by a decreased doubling time when compared to the vector control and parental BGNhigh NIH3T3 cells, while BGNhigh K-RAS-transformed fibroblasts had a reduced cell growth and an increased doubling time (). In order to explore how BGN inhibits cell proliferation, the cell cycle distribution of BGNlow vs BGNhigh K-RAS-transformed fibroblasts was assessed. Compared to BGNlow K-RAS-transformed fibroblasts, the BGNhigh K-RAS transfectants showed a decreased G0/G1 and an increased S phase of the cell cycle () suggesting that the reduced proliferative capacity of BGNhigh K-RAS transfectants was due to a S phase cell cycle arrest. These data are in line with serum starvation experiments demonstrating a more pronounced growth inhibition in the BGN transfectants (data not shown). Comparable results were also shown for BGNlow vs BGNhigh CRC cell lines (Supplementary Figure 4A, 4B).
Figure 5. Influence of BGN expression on the growth properties of K-RAS-transformed fibroblasts.
By employing trans-well assays () and wound healing (), a decreased directional migration was found in BGNhigh vs. BGNlow K-RAS transformed fibroblasts (Supplementary Figure 4C). Furthermore, the inhibition of growth properties of BGNlow K-RAS cells upon BGN overexpression might be due to changes in the TGF-β signaling as demonstrated by an altered expression of TGF-β receptors such as TGFBR2, TGFBR3, ACVRL1, BMPR1A and BMPR1B as well as the TGF-β regulator TBRG4 (Supplementary Figure 5). These data suggest that BGN overexpression in K-RAS-transformed cells could revert the oncogenic properties of the transformed phenotype without affecting K-RAS expression, which appear to be linked to the TGF-β pathway.
Reduced in vivo tumorigenicity and enhanced immunogenicity of BGNhigh K-RAS-transformed cells
Since BGN overexpression altered the in vitro growth properties of BGNlow K-RAS-transformed fibroblasts, the in vivo effects of BGN overexpression were determined by s.c. injection of murine BGNlow and BGNhigh K-RAS-transformed fibroblasts in immune-competent mice. As demonstrated in , BGNhigh K-RAS transfectants had a delayed tumor onset, decreased tumor volume as well as a reduced frequency of tumor formation compared to BGNlow K-RAS-transformed cells despite high levels of K-RAS expression. Thus, BGN overexpression inhibits both the in vitro and the in vivo growth characteristics of K-RAS-transformed cells.
Figure 6. Reduced in vivo tumor growth and enhanced immune cell infiltration of BGNhigh compared to BGNlow K-RAS-transformed fibroblasts in immune competent mice.
To determine whether the increased immunogenicity of BGNhigh K-RAS-transformed fibroblasts in vitro is also retained in vivo and affects the TME, mRNA expression levels of the immune cell markers CD3, CD4, CD8 and of the MHC class I HC were determined by qPCR in BGNhigh vs. BGNlow K-RAS tumors. As shown in , the mRNA expression levels of the three T cell markers and of the MHC class I HC were higher in BGNhigh in comparison to BGNlow K-RAS tumor lesions. These data were confirmed by IHC demonstrating an increased CD3+ T cell infiltration in BGNhigh K-RAS tumors (). In this context, it is noteworthy that an increased frequency of CD4+ and CD8+ T cells was also found in the peripheral blood of mice bearing BGNhigh vs. BGNlow K-RAS tumors ().
Discussion
K-RAS alterations occur in 30–50% of CRC due to activating mutations in the K-RAS codon 12, 13 and 61 or overexpression of wt K-RASCitation59 causing an increased cell proliferation, inhibition of apoptosis, loss of contact inhibition as well as an enhanced contact-independent growth, invasion and migration.Citation60–63
Since RAS proteins control signaling pathways representing key regulators of malignant transformation, different strategies targeting K-RAS have been recently implemented. So far, inhibition of mutant K-RAS by implementing allele-specific inhibitors provides the most efficient therapeutic option.Citation64 However, an alternative approach targeting RAS-modulated pathways to enhance the immunogenicity of K-RAS transformants might be promising. Furthermore, the key to personalized medicine in CRC relies on an integrated understanding of genomic, transcriptomic and proteomic data. This might lead to the identification of a biomarker panel with sufficient sensitivity and specificity to guide clinical decision making or even represent novel therapeutic targets.
To address this challenge, the effect of BGN on the expression of immune modulatory genes, with a particular focus on HLA class I APM components, was determined by RNA sequencing of BGNhigh vs BGNlow K-RAS CRC cell lines. Furthermore, the intra-tumoral T cell infiltration and its correlation with the survival, prognosis and/or progression of CRC patients in the presence and absence of K-RAS overexpression/mutation was evaluated to identify BGN-dependent vulnerabilities for the survival of K-RAS-driven malignancies.
Although a dual role of BGN with either oncogenic or tumor-suppressive function has been described in various cancers types,Citation5 limited information exists about the role of BGN in CRC. This study identified BGN as a novel factor inhibiting tumor growth and enhancing tumor immunogenicity by upregulation of MHC class I antigens in both in vitro models of murine and human K-RAS-overexpressing cell lines and in human K-RAS-associated CRC lesions. Bioinformatics analysis of available datasets demonstrated a dramatic reduction in the protein expression of BGN in CRC, which is associated with a reduced patients’ survival. In contrast, high levels of BGN expression detected in other cancers are often involved in tumor growth and progressionCitation65–67 suggesting a tumor type-dependent anti-tumorigenic or pro-tumorigenic function of BGN. Furthermore, BGN is often secreted by tumor endothelial cells,Citation11,Citation68 but the role of BGN in the tumor stroma has still to be analyzed in detail. Recent data from a breast cancer model demonstrated that the inhibition of BGN expression promoted the normalization of the TME and improved the delivery and efficacy of chemotherapeutics.Citation68 Concerning its effect on tumor immunogenicity, BGN was identified as a central regulator of MHC class I surface expression by transcriptional upregulation of major MHC class I APM components in both human and murine BGNhigh K-RAS-transformed derivatives. This was accompanied by a suppression of tumor formation and growth in vivo, an enhanced T cell infiltration and MHC class I expression as well as an increased frequency of circulating T cells in tumor-bearing mice as shown for BGNhigh vs BGNlow K-RAS-transformed fibroblasts. Furthermore, these results are in line with our in vitro data demonstrating that overexpression of BGN increased MHC class I expression and significantly impaired the growth and migration of K-RAS cells. Thus, the modulation of BGN might be employed as a novel therapeutic strategy for K-RAS-overexpressing tumor cells. Similar data were obtained upon HER-2/neu transformation of murine and human cells leading to growth inhibiton and a more immunogenic phenotype.Citation17,Citation21
Despite the BGN-induced immunogenicity inhibits migration and invasiveness of K-RAS-transformed CRC cells, the underlying molecular mechanisms leading the loss or marginal expression of BGN have not yet been identified. Since mutations and deletions of BGN only occur at a low frequency, the impaired BGN expression appears to occur at the level of regulation rather than due to structural alterations.Citation5 This is strengthened by recent data demonstrating that HER-2/neu transformation is associated with miR-21 overexpression, which is associated with an inhibition of BGN and MHC class I antigens and altered by changes in the TGF-β pathway.Citation69 Similar data are in line with an altered expression of components of the TGF-β pathway upon BGN overexpression in K-RAShigh cells.
The link between the activating mutations of the K-RAS gene and BGN function may enable promising therapeutic approaches for the treatment of cancers with K-RAS genetic alterations,Citation70,Citation71 such as lung adenocarcinoma, mucinous adenoma, ductal pancreatic carcinoma and CRC as well as leukemias.Citation72–77,Citation78–91
The ability of K-RAS to negatively regulate the expression of immune response-relevant molecules, tumor suppressor genes as well as the ECM component BGN highlights their role as putative targets. It is postulated that the K-RAS-transformed phenotype can be modulated by BGN or BGN-regulated genes to revert the immune escape, which might offer a novel and promising opportunity for immunological therapies of K-RAS-mutated and K-RAS-overexpressing tumors.
Availability of data and material
The data and material are available upon request.
Authors contributions
K.S. performed the experiments, wrote the manuscript and prepared the figures and the tables, C.M. performed the immune cell assays and corrected the manuscript, S.L. performed the basal characterisation of the K-RAS model systems and was involved in the mouse experiments, A.S. performed the mouse experiments, D.B. performed the immunohistochemical staining and evaluation, K.B. was involved in the cell culture, qPCR and Western blot analysis, CW evaluated the IHC staining and corrected the manuscript, B.S. was responsible for the concept of the project, the experimental plan, data management and discussion of results as well as was writing the manuscript.
List of abbreviations
Ab, antibody; APM, antigen processing machinery; ß-gal, β-galactosidase; BGN, biglycan; COAD, TCGA colon cancer; CoN, normal colorectal epithelium; CPTAC, Clinical Proteomic Tumor Analysis Consortium; CRC, colorectal cancer; DCN, decorin; DEG, differential expressed gene; DMEM, Dulbecco’s modified Eagles medium; ECM, extracellular matrix; EGF-R, epidermal growth factor receptor; EMEM, Eagle’s modified essential medium; FCS, fetal calf serum; FDR, false discovery rate; FPKM, fragments per kilobase of transcript per million mapped reads; GAPDH, glyceraldehyde-3-phosphate dehydrogenase; GO, gene ontology; HC, heavy chain; HLA, human leukocyte antigen; HRP, horseradish peroxidase; LRR, leucine-rich repeat; LMP, low molecular weight; luc, luciferase; mAb, monoclonal antibody; MFI, mean fluorescence intensity; MHC, major histocompatibility complex; mut, mutated; NC, non-sense control; NK, natural killer; OS, overall survival; PBMC, peripheral blood mononuclear cells; PG, proteoglycan; RNAseq, RNA sequencing; s.c., subcutaneously; SLRP, small leucine-rich repeat protein; TAP, transporter associated with antigen processing; TAPBP, tapasin; TCGA, The Cancer Genome Atlas; TGF-β, transforming growth factor-β; TLR, toll-like receptor; TME, tumor microenvironment; wt, wild type.
Consent for publication
All authors did read the final version of the article and gave consent for publication.
Supplemental Material
Download Zip (521 KB)Acknowledgments
We would like to thank Nicole Ott and Maria Heise for excellent secretarial work, Elena Plotzki and Sravankumar Balina for the generation of the colorectal cell transfectants.
Supplementary material
Supplemental data for this article can be accessed on the publisher’s website
Disclosure statement
No potential conflict of interest was reported by the author(s)
Additional information
Funding
References
- Naba A, Clauser KR, Ding H, Whittaker CA, Carr SA, Hynes RO. The extracellular matrix: tools and insights for the “omics” era. Matrix Biol. 2016;49:10–15. doi:10.1016/j.matbio.2015.06.003.
- Manou D, Caon I, Bouris P, Triantaphyllidou IE, Giaroni C, Passi A, Karamanos NK, Vigetti D, Theocharis AD. The complex interplay between extracellular matrix and cells in tissues. Methods Mol Biol. 2019;1952:1–20.
- Iozzo RV, Schaefer L. Proteoglycan form and function: a comprehensive nomenclature of proteoglycans. Matrix Biol. 2015;42:11–55. doi:10.1016/j.matbio.2015.02.003.
- Theocharis AD, Skandalis SS, Tzanakakis GN, Karamanos NK. Proteoglycans in health and disease: novel roles for proteoglycans in malignancy and their pharmacological targeting. FEBS J. 2010;277(19):3904–3923. doi:10.1111/j.1742-4658.2010.07800.x.
- Subbarayan K, Seliger B. Tumor-dependent effects of proteoglycans and various glycosaminoglycan synthesizing enzymes and sulfotransferases on patients’ outcome. Curr Cancer Drug Targets. 2019;19(3):210–221. doi:10.2174/1568009618666180706165845.
- Espinoza-Sanchez NA, Gotte M. Role of cell surface proteoglycans in cancer immunotherapy. Semin Cancer Biol. 2020;62:48–67. doi:10.1016/j.semcancer.2019.07.012.
- Traupe H, van den Ouweland Am, van Oost Ba, Vogel W, Vetter U, Warren ST, Rocchi M, Darlison MG, Ropers -H-H, van den Ouweland AMW, et al. Fine mapping of the human biglycan (BGN) gene within the Xq28 region employing a hybrid cell panel. Genomics. 1992;13(2):481–483. doi:10.1016/0888-7543(92)90279-2.
- Chen WB, Lenschow W, Tiede K, Fischer JW, Kalthoff H, Ungefroren H. Smad4/DPC4-dependent regulation of biglycan gene expression by transforming growth factor-beta in pancreatic tumor cells. J Biol Chem. 2002;277(39):36118–36128. doi:10.1074/jbc.M203709200.
- Schaefer L, Babelova A, Kiss E, Hausser HJ, Baliova M, Krzyzankova M, Marsche G, Young MF, Mihalik D, Gotte M, et al. The matrix component biglycan is proinflammatory and signals through Toll-like receptors 4 and 2 in macrophages. J Clin Invest. 2005;115(8):2223–2233. doi:10.1172/JCI23755.
- Schaefer L, Tredup C, Gubbiotti MA, Iozzo RV. Proteoglycan neofunctions: regulation of inflammation and autophagy in cancer biology. FEBS J. 2017;284(1):10–26. doi:10.1111/febs.13963.
- Appunni S, Rubens M, Ramamoorthy V, Anand V, Khandelwal M, Sharma A. Biglycan: an emerging small leucine-rich proteoglycan (SLRP) marker and its clinicopathological significance. Mol Cell Biochem. 2021;476(11):3935–3950. doi:10.1007/s11010-021-04216-z.
- Neill T, Schaefer L, Iozzo RV. Decoding the matrix: instructive roles of proteoglycan receptors. Biochemistry. 2015;54(30):4583–4598. doi:10.1021/acs.biochem.5b00653.
- Hu L, Duan YT, Li JF, Su LP, Yan M, Zhu ZG, Liu BY, Yang QM. Biglycan enhances gastric cancer invasion by activating FAK signaling pathway. Oncotarget. 2014;5(7):1885–1896. doi:10.18632/oncotarget.1871.
- Liu Y, Li W, Li X, Tai Y, Lu Q, Yang N, Jiang J. Expression and significance of biglycan in endometrial cancer. Arch Gynecol Obstet. 2014;289(3):649–655. doi:10.1007/s00404-013-3017-3.
- Zhu YH, Yang F, Zhang SS, Zeng TT, Xie X, Guan XY. High expression of biglycan is associated with poor prognosis in patients with esophageal squamous cell carcinoma. Int J Clin Exp Pathol. 2013;6:2497–2505.
- Niedworok C, Rock K, Kretschmer I, Freudenberger T, Nagy N, Szarvas T, Vom Dorp F, Reis H, Rubben H, Fischer JW. Inhibitory role of the small leucine-rich proteoglycan biglycan in bladder cancer. PLoS One. 2013;8(11):e80084. doi:10.1371/journal.pone.0080084.
- Subbarayan K, Leisz S, Wickenhauser C, Bethmann D, Massa C, Steven A, Seliger B. Biglycan-mediated upregulation of MHC class I expression in HER-2/neu-transformed cells. Oncoimmunology. 2018;7(4):e1373233. doi:10.1080/2162402X.2017.1373233.
- Roedig H, Nastase MV, Wygrecka M, Schaefer L. Breaking down chronic inflammatory diseases: the role of biglycan in promoting a switch between inflammation and autophagy. FEBS J. 2019;286(15):2965–2979. doi:10.1111/febs.14791.
- Roedig H, Damiescu R, Zeng-Brouwers J, Kutija I, Trebicka J, Wygrecka M, Schaefer L. Danger matrix molecules orchestrate CD14/CD44 signaling in cancer development. Semin Cancer Biol. 2020;62:31–47. doi:10.1016/j.semcancer.2019.07.026.
- Recktenwald CV, Kellner R, Lichtenfels R, Seliger B. Altered detoxification status and increased resistance to oxidative stress by K-ras transformation. Cancer Res. 2008;68(24):10086–10093. doi:10.1158/0008-5472.CAN-08-0360.
- Recktenwald CV, Leisz S, Steven A, Mimura K, Muller A, Wulfanger J, Kiessling R, Seliger B. HER-2/neu-mediated down-regulation of biglycan associated with altered growth properties. J Biol Chem. 2012;287(29):24320–24329. doi:10.1074/jbc.M111.334425.
- Khan AQ, Kuttikrishnan S, Siveen KS, Prabhu KS, Shanmugakonar M, Al-Naemi HA, Haris M, Dermime S, Uddin S. RAS-mediated oncogenic signaling pathways in human malignancies. Semin Cancer Biol. 2019;54:1–13. doi:10.1016/j.semcancer.2018.03.001.
- Sers C, Kuner R, Falk CS, Lund P, Sueltmann H, Braun M, Buness A, Ruschhaupt M, Conrad J, Mang-Fatehi S, et al. Down-regulation of HLA Class I and NKG2D ligands through a concerted action of MAPK and DNA methyltransferases in colorectal cancer cells. Int J Cancer. 2009;125(7):1626–1639. doi:10.1002/ijc.24557.
- Coelho MA, de Carne Trecesson S, Rana S, Zecchin D, Moore C, Molina-Arcas M, East P, Spencer-Dene B, Nye E, Barnouin K, et al. Oncogenic RAS signaling promotes tumor immunoresistance by stabilizing PD-L1 mRNA. Immunity. 2017;47(6):1083–1099. e1086. doi:10.1016/j.immuni.2017.11.016.
- Anderson P, Aptsiauri N, Ruiz-Cabello F, Garrido F. HLA class I loss in colorectal cancer: implications for immune escape and immunotherapy. Cell Mol Immunol. 2021;18(3):556–565. doi:10.1038/s41423-021-00634-7.
- Ijsselsteijn ME, Petitprez F, Lacroix L, Ruano D, van der Breggen R, Julie C, Morreau H, Sautes-Fridman C, Fridman WH, de Miranda N, et al. Revisiting immune escape in colorectal cancer in the era of immunotherapy. Br J Cancer. 2019;120(8):815–818. doi:10.1038/s41416-019-0421-x.
- Ye SR, Yang H, Li K, Dong DD, Lin XM, Yie SM. Human leukocyte antigen G expression: as a significant prognostic indicator for patients with colorectal cancer. Mod Pathol. 2007;20(3):375–383. doi:10.1038/modpathol.3800751.
- Chen QY, Chen YX, Han QY, Zhang JG, Zhou WJ, Zhang X, Ye YH, Yan WH, Lin A. Prognostic significance of immune checkpoints HLA-G/ILT-2/4 and PD-L1 in colorectal cancer. Front Immunol. 2021;12:679090. doi:10.3389/fimmu.2021.679090.
- Hamarsheh S, Gross O, Brummer T, Zeiser R. Immune modulatory effects of oncogenic KRAS in cancer. Nat Commun. 2020;11(1):5439. doi:10.1038/s41467-020-19288-6.
- Ledys F, Klopfenstein Q, Truntzer C, Arnould L, Vincent J, Bengrine L, Remark R, Boidot R, Ladoire S, Ghiringhelli F, et al. RAS status and neoadjuvant chemotherapy impact CD8+ cells and tumor HLA class I expression in liver metastatic colorectal cancer. J Immunother Cancer. 2018;6(1):123. doi:10.1186/s40425-018-0438-3.
- Tolba MF. Revolutionizing the landscape of colorectal cancer treatment: the potential role of immune checkpoint inhibitors. Int J Cancer. 2020;147(11):2996–3006. doi:10.1002/ijc.33056.
- DeStefanis RA, Kratz JD, Emmerich PB, Deming DA. Targeted therapy in metastatic colorectal cancer: current standards and novel agents in review. Curr Colorectal Cancer Rep. 2019;15(2):61–69. doi:10.1007/s11888-019-00430-6.
- Pancione M, Giordano G, Remo A, Febbraro A, Sabatino L, Manfrin E, Ceccarelli M, Colantuoni V. Immune escape mechanisms in colorectal cancer pathogenesis and liver metastasis. J Immunol Res. 2014;2014:686879. doi:10.1155/2014/686879.
- Grasso CS, Giannakis M, Wells DK, Hamada T, Mu XJ, Quist M, Nowak JA, Nishihara R, Qian ZR, Inamura K, et al. Genetic mechanisms of immune evasion in colorectal cancer. Cancer Discov. 2018;8(6):730–749. doi:10.1158/2159-8290.CD-17-1327.
- Cox AD, Fesik SW, Kimmelman AC, Luo J, Der CJ. Drugging the undruggable RAS: mission possible? Nat Rev Drug Discov. 2014;13(11):828–851. doi:10.1038/nrd4389.
- Chen K, Zhang Y, Qian L, Wang P. Emerging strategies to target RAS signaling in human cancer therapy. J Hematol Oncol. 2021;14(1):116. doi:10.1186/s13045-021-01127-w.
- Chu YC, Tsai TY, Yadav VK, Deng L, Huang CC, Tzeng YM, Yeh CT, Chen MY. 4-Acetyl-Antroquinonol B improves the sensitization of cetuximab on both kras mutant and wild type colorectal cancer by modulating the expression of Ras/Raf/miR-193a-3p signaling axis. Int J Mol Sci. 2021;22(14):7508. doi:10.3390/ijms22147508.
- Doubleday PF, Fornelli L, Ntai I, Kelleher NL. Oncogenic KRAS creates an aspartate metabolism signature in colorectal cancer cells. FEBS J. 2021;288(23):6683–6699. doi:10.1111/febs.16111.
- Moore AR, Rosenberg SC, McCormick F, Malek S. Author correction: RAS-targeted therapies: is the undruggable drugged? Nat Rev Drug Discov. 2020;19(12):902. doi:10.1038/s41573-020-0089-1.
- Hong DS, Fakih MG, Strickler JH, Desai J, Durm GA, Shapiro GI, Falchook GS, Price TJ, Sacher A, Denlinger CS, et al. KRAS(G12C) inhibition with sotorasib in advanced solid tumors. N Engl J Med. 2020;383(13):1207–1217. doi:10.1056/NEJMoa1917239.
- Wang C, Fakih M. Targeting KRAS in colorectal cancer. Curr Oncol Rep. 2021;23(3):28. doi:10.1007/s11912-021-01022-0.
- Ueda Y, Wang S, Dumont N, Yi JY, Koh Y, Arteaga CL. Overexpression of HER2 (erbB2) in human breast epithelial cells unmasks transforming growth Factor β-induced cell motility. J Biol Chem. 2004;279(23):24505–24513. doi:10.1074/jbc.M400081200.
- Zhao S, Wang Y, Cao L, Ouellette MM, Freeman JW. Expression of oncogenic K-ras and loss of Smad4 cooperate to induce the expression of EGFR and to promote invasion of immortalized human pancreas ductal cells. Int J Cancer. 2010;127(9):2076–2087. doi:10.1002/ijc.25412.
- Liu H, Liang Z, Zhou C, Zeng Z, Wang F, Hu T, He X, Wu X, Wu X, Lan P. Mutant KRAS triggers functional reprogramming of tumor-associated macrophages in colorectal cancer. Signal Transduct Target Ther. 2021;6(1):144. doi:10.1038/s41392-021-00534-2.
- Wulfaenger J, Niedling S, Riemann D, Seliger B. Aminopeptidase N (APN)/CD13-dependent CXCR4 downregulation is associated with diminished cell migration, proliferation and invasion. Molecular Membrane Biology. 2008;25(1):72–82. doi:10.1080/09687680701551855.
- Herrmann F, Lehr HA, Drexler I, Sutter G, Hengstler J, Wollscheid U, Seliger B. HER-2/neu-mediated regulation of components of the MHC class I antigen-processing pathway. Cancer Res. 2004;64(1):215–220. doi:10.1158/0008-5472.CAN-2522-2.
- Bukur J, Herrmann F, Handke D, Recktenwald C, Seliger B. Identification of E2F1 as an important transcription factor for the regulation of tapasin expression. J Biol Chem. 2010;285(40):30419–30426. doi:10.1074/jbc.M109.094284.
- Recktenwald CV, Mendler S, Lichtenfels R, Kellner R, Seliger B. Influence of Ki-ras-driven oncogenic transformation on the protein network of murine fibroblasts. Proteomics. 2007;7(3):385–398. doi:10.1002/pmic.200600506.
- Rodriguez LG, Wu X, Guan JL. Wound-healing assay. Methods Mol Biol. 2005;294:23–29. doi:10.1385/1-59259-860-9:023.
- Steven A, Leisz S, Massa C, Iezzi M, Lattanzio R, Lamolinara A, Bukur J, Muller A, Hiebl B, Holzhausen HJ, et al. HER-2/neu mediates oncogenic transformation via altered CREB expression and function. Mol Cancer Res. 2013;11(11):1462–1477. doi:10.1158/1541-7786.MCR-13-0125.
- Zhou G, Wang T, Zha XM. RNA-Seq analysis of knocking out the neuroprotective proton-sensitive GPR68 on basal and acute ischemia-induced transcriptome changes and signaling in mouse brain. FASEB J. 2021;35(4):e21461. doi:10.1096/fj.202002511R.
- Mortazavi A, Williams BA, McCue K, Schaeffer L, Wold B. Mapping and quantifying mammalian transcriptomes by RNA-Seq. Nat Methods. 2008;5(7):621–628. doi:10.1038/nmeth.1226.
- de Sousa E Melo, de Sousa Emf S, Buikhuisen J, Koster J, Cameron K, de Jong Jh, Tuynman JB, Prasetyanti PR, Fessler E, van den Bergh Sp, et al. Methylation of cancer-stem-cell-associated Wnt target genes predicts poor prognosis in colorectal cancer patients. Cell Stem Cell. 2011;9(5):476–485. doi:10.1016/j.stem.2011.10.008.
- Goldman MJ, Craft B, Hastie M, Repecka K, McDade F, Kamath A, Banerjee A, Luo Y, Rogers D, Brooks AN, et al. Visualizing and interpreting cancer genomics data via the Xena platform. Nat Biotechnol. 2020;38(6):675–678. doi:10.1038/s41587-020-0546-8.
- Ellis MJ, Gillette M, Carr SA, Paulovich AG, Smith RD, Rodland KK, Townsend RR, Kinsinger C, Mesri M, Rodriguez H, et al. Connecting genomic alterations to cancer biology with proteomics: the NCI clinical proteomic tumor analysis consortium. Cancer Discov. 2013;3(10):1108–1112. doi:10.1158/2159-8290.CD-13-0219.
- Vasaikar S, Huang C, Wang X, Petyuk VA, Savage SR, Wen B, Dou Y, Zhang Y, Shi Z, Arshad OA, et al. Proteogenomic analysis of human colon cancer reveals new therapeutic opportunities. Cell. 2019;177(4):1035–1049. e1019. doi:10.1016/j.cell.2019.03.030.
- Chen F, Chandrashekar DS, Varambally S, Creighton CJ. Pan-cancer molecular subtypes revealed by mass-spectrometry-based proteomic characterization of more than 500 human cancers. Nat Commun. 2019;10(1):5679. doi:10.1038/s41467-019-13528-0.
- Horsch M, Recktenwald CV, Schadler S, Hrabe de Angelis M, Seliger B, Beckers J. Overexpressed vs mutated Kras in murine fibroblasts: a molecular phenotyping study. Br J Cancer. 2009;100(4):656–662. doi:10.1038/sj.bjc.6604882.
- Fearon ER, Vogelstein B. A genetic model for colorectal tumorigenesis. Cell. 1990;61(5):759–767. doi:10.1016/0092-8674(90)90186-I.
- Murugan AK, Grieco M, Tsuchida N. RAS mutations in human cancers: roles in precision medicine. Semin Cancer Biol. 2019;59:23–35. doi:10.1016/j.semcancer.2019.06.007.
- Al-Mulla F, Milner-White EJ, Going JJ, Birnie GD. Structural differences between valine-12 and aspartate-12 Ras proteins may modify carcinoma aggression. J Pathol. 1999;187(4):433–438. doi:10.1002/(SICI)1096-9896(199903)187:4<433::AID-PATH273>3.0.CO;2-E.
- Guerrero S, Casanova I, Farre L, Mazo A, Capella G, Mangues R. K-ras codon 12 mutation induces higher level of resistance to apoptosis and predisposition to Anchorage-independent growth than codon 13 mutation or proto-oncogene overexpression. Cancer Res. 2000;60:6750–6756.
- Smith G, Bounds R, Wolf H, Steele RJ, Carey FA, Wolf CR. Activating K-Ras mutations outwith ‘hotspot’ codons in sporadic colorectal tumours - implications for personalised cancer medicine. Br J Cancer. 2010;102(4):693–703. doi:10.1038/sj.bjc.6605534.
- Moore AR, Rosenberg SC, McCormick F, Malek S. RAS-targeted therapies: is the undruggable drugged? Nat Rev Drug Discov. 2020;19(8):533–552. doi:10.1038/s41573-020-0068-6.
- Shao C, Cheng C, Shao Q, Chen B. Identification and validation of biglycan as prognosis and therapy markers for patients with stomach adenocarcinoma. <![cdata[international Journal of General Medicine]]>. 2021;14:3497–3509. doi:10.2147/IJGM.S321641.
- Pederson MR. Fermi orbital derivatives in self-interaction corrected density functional theory: applications to closed shell atoms. J Chem Phys. 2015;142(6):064112. doi:10.1063/1.4907592.
- Aumuller G, Seitz J. Cytochemistry and biochemistry of acid phosphatases. VI: immunoelectron microscopic studies on human prostatic and leukocytic acid phosphatases. Prostate. 1985;7(2):161–169. doi:10.1002/pros.2990070206.
- Cong L, Maishi N, Annan DA, Young MF, Morimoto H, Morimoto M, Nam J-M, Hida Y, Hida K. Inhibition of stromal biglycan promotes normalization of the tumor microenvironment and enhances chemotherapeutic efficacy. Breast Cancer Res. 2021;23(1):51. doi:10.1186/s13058-021-01423-w.
- Subbarayan K, Massa C, Lazaridou MF, Ulagappan K, Seliger B. Identification of a novel miR-21-3p/TGF-beta signaling-driven immune escape via the MHC class I/biglycan axis in tumor cells. Clin Transl Med. 2021;11(3):e306. doi:10.1002/ctm2.306.
- McCubrey JA, Steelman LS, Chappell WH, Abrams SL, Wong EW, Chang F, Lehmann B, Terrian DM, Milella M, Tafuri A, et al. Roles of the Raf/MEK/ERK pathway in cell growth, malignant transformation and drug resistance. Biochim Biophys Acta. 2007;1773(8):1263–1284. doi:10.1016/j.bbamcr.2006.10.001.
- Hayama T, Hashiguchi Y, Okamoto K, Okada Y, Ono K, Shimada R, Ozawa T, Toyoda T, Tsuchiya T, Iinuma H, et al. G12V and G12C mutations in the gene KRAS are associated with a poorer prognosis in primary colorectal cancer. Int J Colorectal Dis. 2019;34(8):1491–1496. doi:10.1007/s00384-019-03344-9.
- Krasinskas AM, Moser AJ, Saka B, Adsay NV, Chiosea SI. KRAS mutant allele-specific imbalance is associated with worse prognosis in pancreatic cancer and progression to undifferentiated carcinoma of the pancreas. Mod Pathol. 2013;26(10):1346–1354. doi:10.1038/modpathol.2013.71.
- Chiosea SI, Sherer CK, Jelic T, Dacic S. KRAS mutant allele-specific imbalance in lung adenocarcinoma. Mod Pathol. 2011;24(12):1571–1577. doi:10.1038/modpathol.2011.109.
- Hartman DJ, Davison JM, Foxwell TJ, Nikiforova MN, Chiosea SI. Mutant allele-specific imbalance modulates prognostic impact of KRAS mutations in colorectal adenocarcinoma and is associated with worse overall survival. Int J Cancer. 2012;131(8):1810–1817. doi:10.1002/ijc.27461.
- Burmer GC, Loeb LA. Mutations in the KRAS2 oncogene during progressive stages of human colon carcinoma. Proc Natl Acad Sci U S A. 1989;86(7):2403–2407. doi:10.1073/pnas.86.7.2403.
- Almoguera C, Shibata D, Forrester K, Martin J, Arnheim N, Perucho M. Most human carcinomas of the exocrine pancreas contain mutant c-K-ras genes. Cell. 1988;53(4):549–554. doi:10.1016/0092-8674(88)90571-5.
- Tam IY, Chung LP, Suen WS, Wang E, Wong MC, Ho KK, Lam WK, Chiu SW, Girard L, Minna JD, et al. Distinct epidermal growth factor receptor and KRAS mutation patterns in non-small cell lung cancer patients with different tobacco exposure and clinicopathologic features. Clin Cancer Res. 2006;12(5):1647–1653. doi:10.1158/1078-0432.CCR-05-1981.
- Genome Atlas N C. Comprehensive molecular characterization of human colon and rectal cancer. Nature. 2012;487:330–337.
- Hoadley KA, Yau C, Hinoue T, Wolf DM, Lazar AJ, Drill E, Shen R, Taylor AM, Cherniack AD, Thorsson V, et al. Cell-of-origin patterns dominate the molecular classification of 10,000 tumors from 33 types of cancer. Cell. 2018;173(2):291–304 e296. doi:10.1016/j.cell.2018.03.022.
- Ellrott K, Bailey MH, Saksena G, Covington KR, Kandoth C, Stewart C, Hess J, Ma S, Chiotti KE, McLellan M, et al. Scalable open science approach for mutation calling of tumor exomes using multiple genomic pipelines. Cell Systems. 2018;6(3):271–281 e277. doi:10.1016/j.cels.2018.03.002.
- Taylor AM, Shih J, Ha G, Gao GF, Zhang X, Berger AC, Schumacher SE, Wang C, Hu H, Liu J, et al. Genomic and functional approaches to understanding cancer aneuploidy. Cancer Cell. 2018;33(4):676–689 e673. doi:10.1016/j.ccell.2018.03.007.
- Liu J, Lichtenberg T, Hoadley KA, Poisson LM, Lazar AJ, Cherniack AD, Kovatich AJ, Benz CC, Levine DA, Lee AV, et al. An Integrated TCGA Pan-Cancer Clinical Data Resource to Drive High-Quality Survival Outcome Analytics. Cell. 2018;173(2):400–416 e411. doi:10.1016/j.cell.2018.02.052.
- Sanchez-Vega F, Mina M, Armenia J, Chatila WK, Luna A, La KC, Dimitriadoy S, Liu DL, Kantheti HS, Saghafinia S, et al. Oncogenic signaling pathways in the cancer genome atlas. Cell. 2018;173(2):321–337 e310. doi:10.1016/j.cell.2018.03.035.
- Gao Q, Liang WW, Foltz SM, Mutharasu G, Jayasinghe RG, Cao S, Liao WW, Reynolds SM, Wyczalkowski MA, Yao L, et al. Driver fusions and their implications in the development and treatment of human cancers. Cell Rep. 2018;23(1):227–238 e223. doi:10.1016/j.celrep.2018.03.050.
- Bhandari V, Hoey C, Liu LY, Lalonde E, Ray J, Livingstone J, Lesurf R, Shiah YJ, Vujcic T, Huang X, et al. Molecular landmarks of tumor hypoxia across cancer types. Nat Genet. 2019;51(2):308–318. doi:10.1038/s41588-018-0318-2.
- Poore GD, Kopylova E, Zhu Q, Carpenter C, Fraraccio S, Wandro S, Kosciolek T, Janssen S, Metcalf J, Song SJ, et al. Microbiome analyses of blood and tissues suggest cancer diagnostic approach. Nature. 2020;579(7800):567–574. doi:10.1038/s41586-020-2095-1.
- Ding L, Bailey MH, Porta-Pardo E, Thorsson V, Colaprico A, Bertrand D, Gibbs DL, Weerasinghe A, Huang KL, Tokheim C, et al. Perspective on oncogenic processes at the end of the beginning of cancer genomics. Cell. 2018;173(2):305–320 e310. doi:10.1016/j.cell.2018.03.033.
- Bonneville R, Krook MA, Kautto EA, Miya J, Wing MR, Chen HZ, Reeser JW, Yu L, Roychowdhury S. Landscape of microsatellite instability across 39 cancer types. JCO Precis Oncol. 2017;2017. doi:10.1200/PO.17.00073.
- Zhang B, Wang J, Wang X, Zhu J, Liu Q, Shi Z, Chambers MC, Zimmerman LJ, Shaddox KF, Kim S, et al. Proteogenomic characterization of human colon and rectal cancer. Nature. 2014;513(7518):382–387. doi:10.1038/nature13438.
- Gao J, Aksoy BA, Dogrusoz U, Dresdner G, Gross B, Sumer SO, Sun Y, Jacobsen A, Sinha R, Larsson E, et al. Integrative analysis of complex cancer genomics and clinical profiles using the cBioPortal. Sci Signal. 2013;6(269):l1. doi:10.1126/scisignal.2004088.
- Chandrashekar DS, Bashel B, Balasubramanya SAH, Creighton CJ, Ponce-Rodriguez I, Chakravarthi B, Varambally S. UALCAN: a portal for facilitating tumor subgroup gene expression and survival analyses. Neoplasia. 2017;19(8):649–658. doi:10.1016/j.neo.2017.05.002.