
ABSTRACT
Homologous recombination repair deficiency (HRD) is observed in 10% of patients with castrate-resistant prostate cancer (PCa). Preliminary data suggest that HRD-PCa might be more responsive to immune checkpoint inhibitors (ICIs). In this study, we compare the tumor immune landscape and peripheral T cell receptor (TCR) repertoire of patients with and without HRD-PCa to gain further insight into the immunogenicity of HRD-PCa. Immunohistochemistry was performed on tumor tissue of 81 patients, including 15 patients with HRD-PCa. Peripheral TCR sequencing was performed in a partially overlapping cohort of 48 patients, including 16 patients with HRD-PCa. HRD patients more frequently had intratumoral CD3+, CD3+CD8−FoxP3− or Foxp3+ TILs above median compared to patients without DNA damage repair alterations (DDRwt; CD3+ and Foxp3+: 77% vs 35%, p = .013; CD3+CD8−FoxP3−: 80% vs 44%, p = .031). No significant difference in CD8+ TILs or PD-L1 expression was observed. In peripheral blood, HRD patients displayed a more diverse TCR repertoire compared to DDRwt patients (p = .014). Additionally, HRD patients shared TCR clusters with low generation probability, suggesting patient-overlapping T cell responses. A pooled analysis of clinical data from 227 patients with molecularly characterized PCa suggested increased efficacy of ICIs in HRD-PCa. In conclusion, patients with HRD-PCa display increased TIL density and an altered peripheral TCR repertoire. Further research into the efficacy of ICIs and the presence of shared neoantigens in HRD-PCa is warranted.
Introduction
Although the treatment arsenal for castrate-resistant prostate cancer (CRPC) has steadily grown in the last years, CRPC remains a lethal disease. An increased understanding of tumor immunology has led to the development of effective immunological anti-cancer treatments that have the potential to achieve durable responses, i.e., checkpoint inhibitors (ICIs).Citation1 Although ICIs do not prolong median survival in unselected CRPC patients, durable responses are observed in some patients.Citation2–6
Molecular characterization may help to identify CRPC patients that benefit from ICIs. High tumor mutational burden (TMB) is associated with favorable outcomes of ICIs.Citation7,Citation8 Additionally, tumors with microsatellite instability (MSI) due to defective DNA mismatch repair are responsive to ICIs, independent of tumor type.Citation9 Additional subgroups that may benefit from ICIs are those with alterations in other DNA damage repair (DDR) pathways. A commonly altered DDR pathway is homologous recombination repair (HR), which is involved in the repair of double-strand DNA breaks. Approximately 13% of CRPC patients have an HR deficient (HRD) tumor according to the Classifier of HOmologous Recombination Deficiency (CHORD) score.Citation10 Deleterious alterations in BRCA2 are responsible for approximately 75% of cases.Citation10
HRD prostate cancer (PCa) displays distinct clinical behavior compared to HR-proficient PCaCitation5,Citation11–14 and might represent a subgroup with altered immunogenicity and higher susceptibility to immunotherapy. This may be partly explained by the higher TMB in HRD-PCa.Citation15 Additionally, the genomic instability that results from HRD leads to activation of the STimulator of INterferon Genes pathway (STING), which may increase tumor immunogenicity.Citation16 Exploratory biomarker analyses within clinical trials have suggested higher response rates to ICIs in patients with HRD-PCa.Citation5,Citation17,Citation18
Previous studies in PCa indicate that MSI patients have higher tumor-infiltrating lymphocyte (TIL) density, higher PD-L1 expression, and a richer peripheral T cell receptor (TCR) repertoire compared to patients with microsatellite stable tumors.Citation19–21 Some studies in breast and ovarian cancer suggest that BRCA-mutated tumors also contain denser immune infiltrates,Citation22 but data on the immunological landscape or TCR repertoire in patients with HRD-PCa is limited.Citation23,Citation24
The primary goal of this study was to compare the tumor-immune microenvironment and peripheral TCR repertoire of PCa patients with and without HRD. We hypothesized that HRD tumors would show increased TIL density and a distinct TCR repertoire if more responsive to ICIs. Additionally, clinical data from literature and patients treated in our center were pooled to compare the efficacy of ICIs between patients with and without HRD-PCa.
Methods
Patients and samples for immunohistochemistry (IHC) and TCR sequencing
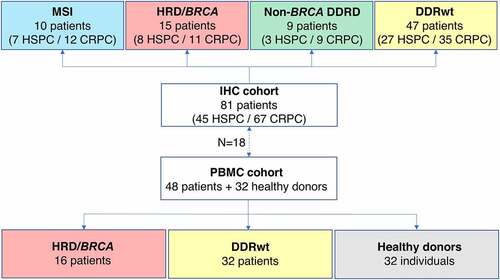
In this translational study, immunohistochemistry (IHC) and peripheral TCR sequencing was performed to gain insight into the immunogenicity of patients with HRD-PCa. Tumor tissue of 81 PCa patients was used for IHC. Peripheral TCR sequencing was performed in a partially overlapping cohort of 48 patients (). Patients were treated at the Radboudumc between 2016 and 2020 and were selected based on the availability of next-generation sequencing data and tissue and/or peripheral blood mononuclear cells (PBMCs). When available, multiple samples per patient were used for IHC, including tissue obtained at first diagnosis and tissue of metachronous metastases. PBMCs were collected in the CRPC setting.
Figure 1. Overview of the IHC and PBMC cohorts. In this study, tumor samples of 81 prostate cancer patients were used for IHC. If available, multiple tumor samples per patients were analyzed, including tissue of the hormone-sensitive and castrate-resistant setting. For TCR sequencing, PBMCs of 48 patients were used. Patients were classified into four genomic subgroups as depicted in the figure. There were 15 HRD patients in the IHC cohort and 16 in the PBMC cohort.
Blood was collected after written informed consent. Patients also provided written informed consent to scientific use of leftover tissue, unless deceased. This research was approved by the local Radboudumc medical ethical committee (local ethics numbers 2016–3060 and 2017–3934).
Next generation sequencing data
Tumor samples were molecularly characterized prior to inclusion in this study. Patients had undergone whole genome sequencing (WGS) in the context of the CPCT-02 study,Citation15 except for a few patients with BRCA1/2 inactivation or MSI. In one patient with MSI, a 33-gene panel with 5 MSI markers had been used to detect MSI (BAT25, BAT26, NR21, NR24 and NR27, PATHv2D, version 2). Other patients had been sequenced using a large next generation sequencing panel: the FoundationOne CDx assay (Foundation Medicine, Cambridge, MA, USA; 315 genes) or the TruSight Oncology 500 (TSO500; Illumina, San Diego, CA; 523 genes).
In patients that had undergone WGS, the CHORD score was used to identify those with an HRD signature. The CHORD score was considered high if the sum of the BRCA1 and BRCA2 deficiency probabilities was ≥0.5, in line with previous literature.Citation10 In addition, the presence of alterations in the following DDR genes was assessed: ATM, ATR, ATRX, BRCA1, BRCA2, BARD1, BLM, BRIP1, CDK12, CHEK1, CHEK2, CTNNB1, ERCC genes (2–6), FANC genes (A,B,C,D2,E,F,G,L), MDC1, MRE11A, MUTYH, NBN, PALB2, POLE, POLQ, RAD50, RAD51 genes (B,C,D), RAD52, RAD54L, RECQL, WRN and XRCC2-6. WGS data was analyzed using a ‘tumor-first approach’: the presence of germline variants was assessed only in case of a high CHORD score or a somatic alteration in a DDR gene.
The pathogenicity of the identified alterations was analyzed based on guidelines from the American College of Medical Genetics and Genomics and the Association for Molecular Pathology.Citation25,Citation26 In patients that had undergone WGS or sequencing with the TSO500 panel, the zygosity status of the identified alterations was manually assessed. In patients sequenced by the FoundationOne CDx assay zygosity could not be confirmed.
Next-generation sequencing was performed in the CRPC setting in most patients. As aberrations in DDR pathway genes have been described to occur as early oncogenic events, we assumed these DDR alterations to be present in the HSPC tissues.Citation27,Citation28
Genomic subgroups
Four genomic subgroups were distinguished: HRD/BRCA, MSI, non-BRCA DDRD and DDRwt. HRD/BRCA was defined as a high CHORD score,Citation10 a (likely) pathogenic mutation in BRCA1/2 or loss of BRCA1/2. BRCA2 alteration with unknown zygosity status were assumed to be homozygous, based on literature describing biallelic inactivation in over 75% of cases.Citation29 Patients with MSI and non-BRCA DDRD were included as examples of highly immunogenic tumors and for exploratory purposes, respectively. MSI was defined as the presence of instable microsatellites or an absolute frequency of indels within repeat regions >14.000.Citation10 Non-BRCA DDRD was defined as biallelic inactivation of any of 43 non-BRCA DDR genes mentioned above. Finally, patients without any of these alterations were considered to have a DDRwt tumor.
Immunohistochemistry staining
Consecutive 4 µm thick tissue sections, cut from formalin-fixed paraffin-embedded tissue blocks, were used for hematoxylin and eosin (H&E), 7-color multiplex IHC (mIHC), and PD-L1 staining.
The automated BOND-RX IHC stainer (Leica Biosystems) was used for mIHC. Primary antibodies included anti-CD3, anti-CD8, anti-FoxP3, anti-CD56 and anti-CD45RO. Additionally, an antibody mix consisting of anti-pan cytokeratin, anti-EPCAM, and anti-PSMA was used to differentiate between tumor and surrounding stroma. Antibody details are presented in supplementary table 1.
Slides were first deparaffinized using Bond Dewax Solution (AR9222, Leica). Subsequently, antigen retrieval was performed in Bond Epitope Retrieval 2 (AR9640, Leica) at 95°C for 20 minutes. To reduce nonspecific background staining, slides were then incubated in Opal antibody diluent (ARD1001EA, PerkinElmer) for 10 minutes. After incubation with the primary antibody for 1 hour at room temperature, the slides were washed three times with Bond Wash Solution (AR9590, Leica). Then, Opal Polymer anti-mouse/anti-rabbit HRP secondary antibodies (NEL801001KT, PerkinElmer) were applied for 10 minutes. Slides were washed again three times, Opal TSA substrate was applied in a 1:50 dilution (Opal520, 540, 570, 620 and 690) or a 1:200 dilution (Opal650) for 10 minutes and the slides were washed again (NEL801001KT, PerkinElmer). This process was repeated for all six markers. Finally, DAPI nuclear counterstain, diluted in TBST, was applied manually for 5 minutes (NEL801001KT, PerkinElmer) and slides were embedded in Fluoromount-G (0100–01, ITK). Methods for panel optimization and validation have previously been published.Citation30
PD-L1 staining was performed on the automated VENTANA Benchmark ULTRA platform using the SP263 assay, according to manufacturer’s protocol (Ventana Medical Systems, Tucson, AZ, USA).
Tissue imaging and analysis
The mIHC stainings were analyzed using an automated approach. Stained slides were scanned using the PerkinElmer Vectra® 3 Automated Quantitative Pathology Imaging System (version 3.0.4). Single stainings were used to set the exposure times. Slides were first scanned at 4x magnification. Using the PerkinElmer Phenochart software (version 1.0.9), tumor regions plus one surrounding region of stroma (669 × 500 µm) were selected for imaging at 20X magnification. Selection of tumor regions was performed using an epithelial marker (pan cytokeratin, EPCAM and PSMA) and annotated H&Es. H&E were used to differentiate between benign epithelial cells and tumor cells, which are both positive for the epithelial marker (supplementary figure 1A/B).
PerkinElmer inForm® image-analysis (version 2.4.2) was used for spectral unmixing, removal of autofluorescence signal and tumor segmentation (supplementary figure 1C). For tissue segmentation, an algorithm was trained based on the expression of the epithelial marker, DAPI and autofluorescence to discriminate between tumor, stroma, and background (supplementary figure 1D). After tissue segmentation, images and tissue segmentation data were exported from inForm for cell identification and phenotyping by an in-house developed neural network (ImmuNet).Citation31 Shortly, the neural network identifies TILs based on the expression of the seven IHC markers and predicts for each identified cell which of the markers is expressed (supplementary figure 1E-F). The data generated by the neural network were exported in Flow Cytometry Standard (FCS) files. Subsequently, cell populations were gated in FlowJo (version 10, Tree Star Inc., Ashland, OR, USA) using the predicted marker expression of the neural network (supplementary figure 2). Four TIL subsets were distinguished: total T cells (CD3+), cytotoxic T cells (CD8+), helper T cells (CD3+CD8−FoxP3−), and regulatory T cells (FoxP3+). Unfortunately, CD56+ NK cells and CD45RO+ T cells could not be accurately identified (supplementary figure 2). TIL density was dichotomized by median split using the tissue site-specific median to compare TIL density across tissue sites.
PD-L1 expression on tumor and immune cells was manually assessed and considered positive if expressed on more than 1% of tumor cells or in more than 1% of tumor area, respectively, in line with previous literature.Citation32–35
Of all 112 samples, two were non-evaluable for PD-L1 expression and two for TIL density due to inadequate tissue quality. Additionally, in six samples, the stromal cell density could not be assessed due to a stromal surface of less than 0.10 mm2.
PBMC isolation
For peripheral TCR sequencing, PBMCs were isolated using Ficoll gradient centrifugation. After adding Ficoll (LymphoprepTM, Axis-Shield, Dundee, UK), samples were centrifuged at 750 g for 20 minutes at room temperature without brake. The PBMC layer was transferred to a new tube and washed with phosphate-buffered saline (PBS). Viable cells were counted using a LUNA FL dual fluorescence cell-counter (Logos Biosystems). Cells were resuspended in freezing medium (10% DMSO, 90% fetal bovine serum) at a concentration of 5 × 10⁶ viable cells per ml and stored in liquid nitrogen.
Peripheral TCR repertoire
Sequencing of the TCR β locus was performed on 250–500 ng of DNA as previously described.Citation21 Sequence alignment and clonotype quantitation was performed using MiXCR (version 3.0.5).Citation36 Clonotypes with a read count ≥ 2 were included. To account for differences in sequencing depth, TCR repertoires were normalized to 30.000 reads. Descriptive repertoire metrics (Shannon diversity and clonality) were calculated as described elsewhere.Citation37 The Shannon index is a measure for TCR diversity, with higher values indicate higher diversity (i.e., a higher number of TCR clones and/or a more evenly distributed repertoire). The clonality (inverse measure of evenness) describes the abundance of the clones within the repertoire and ranges from 0 to 1, with 1 being a completely clonal repertoire (1 clone). TCR repertoires of 32 age- and sex-matched healthy donors (HD) were used as controls. Analyses were carried out using R (version 3.4.4) and the tcR package.Citation38
Identification of TCR clusters using GLIPH2 (Grouping of Lymphocyte Interaction using Paratope Hotspots)
To identify TCR sequences that share similarity (=clusters of TCRs), GLIPH2 was used.Citation39 GLIPH2 groups T cell clones based on similar antigen recognition inferred from the global and local similarity of the complementarity-determining-region 3 amino acid sequence. Only T cell clusters with at least 4 unique clonotypes that are shared by at least 3 individuals were counted. Generation probability (pGen) of each cluster was calculated using OLGA with default parameters (low pGen: <1/109).Citation40 T cell clusters with low pGen are presumed to be expanded by antigen pressure, whereas clusters exhibiting a high pGen may be a result of random V(D)J recombination.
As the HRD/BRCA subgroup contained two times less individuals than the DDRwt and HD group, we split the DDRwt and HD cohorts in two and performed two independent experiments, comparing the same cohort of HRD/BRCA patients with different cohorts of DDRwt patients and HDs. We then compared the results of the two experiments to identify TCR clusters that were exclusive to or enriched in HRD in both experiments.
Pooled analysis of ICI efficacy
To investigate the efficacy of ICIs in patients with HRD, data of three published studiesCitation5,Citation17,Citation18 were pooled with retrospectively collected data of patients in our center. In this analysis, patients were classified as HRD or HR-proficient based on the presence or absence of a (likely) pathogenic alteration in HR-related genes (supplementary table 2). Because patients with MSI are known to respond better to ICIs, patients with known MSI were excluded from the analyses. In all patients treated at our center, MSI status was known. The KEYNOTE-199 reported that none of the responders had MSI. The Checkmate-650 reported that MSI was not found in 11 of the 15 patients that were tested for it. The STARVE-PC did not report on the presence of MSI. Endpoints for the pooled analyses included objective response according to RECISTv1.1, prostate-specific antigen response of ≥50% and radiographic or clinical progression-free survival at twelve months.
Statistical analysis
To compare TIL density between tissue sites, a Kruskal-Wallis test was performed. A post-hoc Dunn’s test with Bonferroni correction was applied for pairwise comparisons. A Fisher’s exact test was used to compare PD-L1 expression between sites.
When comparing HRD/BRCA and DDRwt, a Fisher’s exact or chi-square test was used for categorical data and a Wilcoxon test for continuous data. To avoid overrepresentation of patients with multiple samples, samples were weighted based on the number of available samples per patient (i.e., each sample counted as 0.5 observation in categorical analyses if two samples were available). Statistical analyses were performed in R version 4.0.2 and SPSS. A p-value ≤ 0.05 was considered significant.
Results
Characteristics of the IHC cohort
IHC was performed on 112 samples of 81 patients (). Forty-five samples were obtained in the hormone-sensitive (HSPC; 43x primary tumor, 2x metastases) and 67 in the CRPC setting. CRPC samples were collected from different sites (31x lymph node, 18x bone, 6x liver, 12x other) at different stages of the disease (median lines of systemic therapy: 1, range: 0–6).
The IHC cohort consisted of 10 patients with MSI, 15 with HRD/BRCA, 9 with non-BRCA DDRD, and 47 with a DDRwt tumor. Genomic alterations and patient characteristics are described in supplementary tables 3, 4, and 5. HRD/BRCA patients had a higher median TMB than DDRwt or non-BRCA DDRD patients (5.3 muts/MB vs 2.6 and 2.7 muts/MB, respectively), but TMB was much lower compared to MSI patients (56.5 muts/MB).
TIL density differs per tissue site
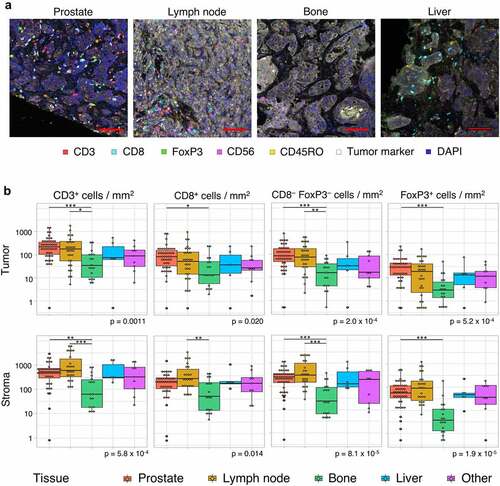
As tumor samples from different tissue sites were included, TIL density was first compared between sites. Both in the tumor compartment and the surrounding stroma, TIL density significantly differed between sites (). Pairwise comparison revealed that the intratumoral density of all T cell subsets was higher in prostate tumors compared to bone metastases. Additionally, CD3+ and CD3+CD8−FoxP3− T cell density was higher in lymph node compared to bone metastases. There were no significant differences between bone, liver and other metastases (). Of note, all but three samples obtained from the prostate were taken in the HSPC setting. Samples from other sites were almost exclusively obtained in the CRPC setting, except for one lymph node and one bone biopsy.
Figure 2. Tumor-infiltrating lymphocyte density per tissue site. A. Multiplex immunohistochemistry (IHC) images of the four most prevalent tissue sites (≥ 5 samples included). The scalebar represents a length of 100 µm. Additional representative IHC images are shown in supplementary figure 3. B. CD3+, CD8+, CD3+CD8−FoxP3− and FoxP3+ cell density in the tumor (upper panel) and stroma compartment (lower panel) per tissue site. For all cell subsets, we observed significant differences between tissue sites, both in the stromal and tumoral compartments (Kruskal-Wallis test, p ≤ .05). Black lines indicate significant differences between pairs (Dunn’s test, * p ≤ .05; ** p ≤ .01; *** p ≤ .001). In some patients, no T cells were present. To enable visualization of cell densities on a log scale, the T cell densities of these patients were replaced by 0.5 cells/mm2 (~lowest value in the plots). Differences between paired samples are displayed in supplementary figure 4.
Higher TIL density in HRD/BRCA patients
Next, differences between genomic subgroups were evaluated per tissue site. As the number of bone, liver, and other metastases was relatively low and TIL density did not significantly differ between these sites, these sites were combined. For all three sites (prostate, lymph node and other), numerically higher intratumoral and stromal CD3+, CD8+, CD3+CD8−FoxP3−, and FoxP3+ TIL densities were observed in HRD/BRCA compared to DDRwt patients ( a-c, supplementary figure 5). These differences were most evident in the lymph nodes and other sites ( b and c). There was no clear difference in the ratio of FoxP3+ to CD8+ TILs between HRD/BRCA and DDRwt patients (supplementary figure 6), nor in the ratio between intratumoral and stromal TIL density (supplementary figure 7). Samples from MSI and non-BRCA DDRD tumors also had denser intratumoral TIL compared to DDRwt tumors ().
Figure 3. Intratumoral TIL density per tissue site. Intratumoral TIL densities in prostate tissue (a), lymph node metastases (b) and other tissue sites (c) are displayed. The stacked bar plot at the left shows the absolute T cell densities per sample, subdivided into CD8+, CD3+CD8−FoxP3− and FoxP3+ cells. Samples are ordered based on total CD3+ T cell density. The bars below provide information on genomics subgroup, androgen sensitivity and tissue site. At the right, T cell densities per genomic subgroup as displayed in boxplots. In some patients, no T cells were present. To enable visualization of cell densities on a log scale, the T cell densities of these patients was replaced by 0.5 cells/mm2 (~lowest value in the plots).
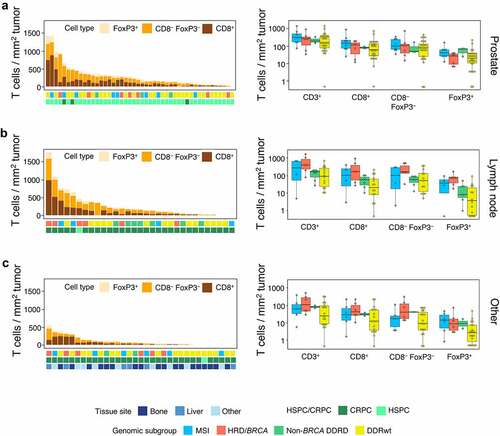
When comparing TIL density between HRD/BRCA and DDRwt patients across tissue sites, HRD/BRCA patients more frequently had CD3+, CD3+CD8−FoxP3− or Foxp3+ TIL densities above median compared to DDRwt patients (CD3+: 77% vs 35%, p = .013; CD3+CD8−FoxP3+: 80% vs 44%, p = .031; FoxP3+ 77% vs 35%, p = .013), but CD8+ TILs did not significantly differ (63% vs 38%, p = .15). MSI and non-BRCA DDRD patients also more frequently had CD3+, CD8+ or FoxP3+ TIL above median compared to DDRwt, but this difference was less pronounced (supplementary table 6).
PD-L1 expression does not differ between HRD/BRCA and DDRwt patients
Although PD-L1 expression numerically differed between tissue sites, these differences were not statistically significant (supplementary figure 8). Nor was there a marked difference between paired HSPC and CRPC samples (n = 25) (supplementary figure 9). Therefore, all samples were combined in subsequent analyses.
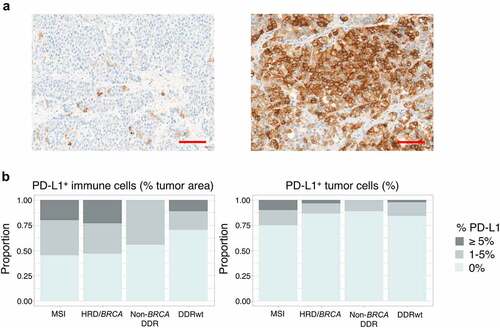
HRD/BRCA tumors, like MSI tumors, more frequently had PD-L1+ immune cells in ≥1% of tumor area, but this difference did not reach statistical significance (53% vs 30%, p = .18). PD-L1 expression on tumor cells was overall low, but was more frequent in MSI tumors. HRD/BRCA and DDRwt tumors did not differ ().
Figure 4. PD-L1 expression. (a) Examples of PD-L1 stainings. The left image shows a tumor sample with PD-L1+ immune cells in 1% of tumor area and PD-L1 expression on 1% of tumor cells. The sample with the highest tumor cell expression in our cohort is depicted on the right. In this sample (only a part is shown) 30% of tumor cells expressed PD-L1 on their cell surface. The scalebar represents a length of 100 µm. (b) The proportion of patients with PD-L1 expression on immune (left) and tumor cells (right) per genomic subgroup. To avoid overrepresentation of patients with multiple samples, samples were weighted based on the number of available samples per patient (with each sample counting as 1 observation if one sample was available and each sample counting as 0.5 observation if two samples were available). No significant differences were observed between genomic subgroups.
HRD/BRCA patients have a distinct peripheral TCR repertoire
Next, the TCR repertoires of 16 HRD/BRCA patients, 32 DDRwt patients, and 32 HDs were compared. All PBMCs were collected in the CRPC setting. Specifics on genomic alterations and patient characteristics are presented in supplementary tables 3 and 7. HRD/BRCA patients had a more diverse peripheral TCR repertoire compared to DDRwt patients (p = .014) and HD (p = .050, ). Additionally, the TCR repertoire in HRD/BRCA tended to be less clonal (p = .066). These differences did not appear accountable to dissimilarities in the number of prior treatments as the same trend was observed in patients receiving a maximum of one prior therapy ().
Figure 5. Peripheral T cell receptor (TCR) repertoire. (a) TCR diversity and clonality per genomic subgroup. (b) TCR diversity and clonality in patients who have received only 0–1 lines of prior systemic therapy. This analysis includes 6 patients with HRD/BRCA and 27 patients with DDRwt. (c) T cell cluster analyses. As the HRD/BRCA subgroup contained two times less individuals than the DDRwt and HD group, we split the DDRwt and HD cohorts in two and performed two independent experiments, comparing the same cohort of HRD/BRCA patients with different cohorts of DDRwt patients and HDs. We focused on the clusters that were shared between HRD/BRCA and DDRwt patients or were exclusive to these groups (n = 2232 in experiment 1; n = 2164 in experiment 2). Fold-changes were calculated by dividing the median frequency of a cluster in the HRD/BRCA subgroup by the median frequency of the same cluster in the DDRwt subgroup. Clusters that were exclusively present in either the HRD/BRCA (far right, orange dots) or DDRwt (far left, blue dots) were given artificial log2 fold-change values for plotting purposes. In total, 84 clusters were exclusive to HRD in both experiments compared to 33 in the DDRwt subgroup (supplementary file).
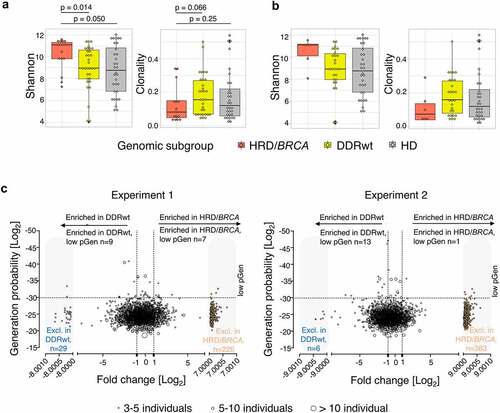
To further characterize the peripheral TCR repertoire of patients with HRD/BRCA and identify TCR clusters that presumably recognize similar epitopes, a cluster analysis was performed (). Since low pGen clusters are only expected to be shared between individuals if selected for functionality,Citation41 shared clusters with low pGen are of particular interest. HRD/BRCA patients had an average of 2.8 enriched or exclusive low pGen clusters while DDRwt patients had an average of 1.6. Four low pGen clusters were enriched or exclusively present in the HRD/BRCA patients (%SGGAGET, GLAG%SE, S%TSGSFDE, %DSYTDT). All these clusters were shared between three or four HRD/BRCA patients. Two clusters were also present in one DDRwt patient each.
HRD patients appear to benefit more from ICIs
Finally, to investigate the efficacy of ICIs in HRD-PCa, a pooled analysis of published and unpublished clinical data was performed. Nine HRD and six HR-proficient patients were treated with anti-PD-(L)1 in our center. Objective response rates (ORR) were observed in 1 out of 8 evaluable HRD patients (12.5%) and in 0 out of 6 HR-proficient patients (0%); PSA50 responses were observed in 2 out of 9 (22.2%) and 1 out of 6 patients (16.7%; supplementary table 8).
The pooled analyses included 227 patients of which 59 were treated with ipilimumab plus nivolumab and 168 were treated with anti-PD-(L)1 monotherapy. Significantly more PSA50 responses were observed in HRD patients (22.0% versus 7.1%, p = .002). There was a trend toward higher ORR (16.7% vs 8.0%) and better 12-month progression-free survival (19.0% vs 3.8%) in HRD patients (). Further details on responses to anti-PD-(L)1 monotherapy and combination therapy are provided in supplementary table 9.
Table 1. Response to ICIs by HR status.
Discussion
The goal of this study was to compare the immunogenicity of HRD/BRCA-PCa and PCa without alterations in DDR pathways. HRD/BRCA patients had increased TIL density and a more diverse peripheral TCR repertoire compared to DDRwt patients. Additionally, HRD/BRCA patients shared T cell clusters with low pGen suggesting patient-overlapping T-cell responses in this genomic subgroup. Our data indicate that HRD/BRCA-PCa represents an immunologically distinct subgroup.
So far, two small studies have examined TIL density in HRD-PCa.Citation23,Citation24 One study reported higher intratumoral CD4+ and FoxP3+ TIL density in BRCA2-mutated (n = 8) compared to BRCA2-wildtype tumors, in line with our findings.Citation23 Another reported no difference in CD8+ or FoxP3+ TIL between tumors with a germline BRCA2 mutation (n = 17) and tumors without alterations in HR-related genes.Citation24 The latter study, however, used another method of tissue segmentation, including intervening stroma in the tumor compartment. As TIL density is usually higher in stroma and the amount of intervening stroma may differ between tumors, this might explain the negative results of this study. Whilst in our study CD3+, CD3+CD8−FoxP3−, and FoxP3+ but not CD8+ TIL density significantly differed between HRD/BRCA and DDRwt patients, there was no evidence for a more immune suppressive tumor microenvironment in HRD/BRCA patients based on a comparable CD8 to FoxP3 ratio as previously suggested.Citation23
Our TCR repertoire data suggest that HRD/BRCA patients have been exposed to a wider range of antigens compared to DDRwt patients.Citation42–44 Additionally, HRD/BRCA patients shared TCR clusters with low pGen, suggesting patient-overlapping T-cell responses in this subgroup. We have previously identified shared low pGen clusters in peripheral blood of patients with MSI PCa.Citation21 It has become clear that MSI patients share strongly immunogenic tumor-specific antigens derived from shared frameshift mutations.Citation45 These shared antigens are particularly interesting because they may be used to develop personalized cancer vaccines. Although it is compelling that we found shared clusters in HRD/BRCA patients, more research is needed to confirm the presence of shared antigens in HRD/BRCA-PCa.
To investigate whether the increased TIL density and more diverse peripheral TCR repertoire translates into better efficacy of ICIs in HRD, a pooled analysis of available clinical data was performed. Although the number of patients was limited and only a significant difference in PSA50 responses was observed, our analyses support the hypothesis that ICIs might be more effective in HRD compared to HR-proficient patients. Nevertheless, we should acknowledge that a recent paper studying the combination of anti-PD-1 plus docetaxelCitation46 did not observe better outcomes in patients with alterations in HR-related genes. It is important to note that we used another definition for HRD in the clinical efficacy analyses than in the rest of the paper as published clinical studies defined HRD as the presence of pathogenic alterations in a broad panel of HR-related genes and provided little details on the identified alterations. This may have impacted the results as alterations in BRCA1/2 may have other effects on the HR-pathway (and tumor immunogenicity) than the other genes.Citation22 This is why, in our IHC analyses, patients with alteration in non-BRCA HR-related genes were classified into a separate group than patients with alterations in BRCA genes. Nevertheless, our IHC data shows that patients with non-BRCA DDRD also tended to have higher TIL density compared to DDRwt patients. Prospective clinical trials studying the efficacy of ICIs in HRD-PCa are underway (NCT04717154, NCT03040791, NCT03248570). These studies will hopefully also provide more insight into the specific impact of BRCA1/2 mutations on immunotherapy efficacy.
This study has some limitations. Firstly, the group of HRD/BRCA patients in our analyses was small. Secondly, tissue was derived from different sites. To correct for this, we used a tissue-specific cut off to classify tumors into highly or poorly infiltrated tumors. Besides the differences in biopsy site, there was also variation in castrate resistance status and in the number of treatments before the CRPC biopsy. Previous studies have suggested that androgen-deprivation therapy, which is started in the HSPC setting, has immunogenic properties and may lead to an increase in T cell density and PD-L1 expression.Citation47 A recent study by Powles et al.,Citation48 on the other hand, showed that T cell signatures and PD-L1 expression are relatively stable between HSPC and CRPC samples. Although castrate resistance status and treatments might influence TIL density, the same trend was observed in prostate (almost exclusively obtained in the HSPC setting), lymph node and other biopsies (mostly obtained in the CRPC setting). In addition, there was an even distribution of HSPC and CRPC samples between HRD/BRCA and DDRwt patients, supporting the presence of a true difference in TIL density between HRD/BRCA and DDRwt patients. Finally, the zygosity status of the BRCA2 mutations was unknown for some patients in our cohort. Nevertheless, the high prevalence of biallelic inactivationCitation29 together with the good responses to PARP inhibitors and platinum-based chemotherapy in our HRD/BRCA subgroup (supplementary table 3) supports the presence of biallelic BRCA2 inactivation in these patients.
Conclusion
HRD/BRCA-PCa represent an immunologically distinct subgroup with increased TIL density and an altered peripheral TCR repertoire and might be more susceptible to ICIs. Prospective clinical trials studying the efficacy of ICIs in HRD-PCa are underway and will provide further insight into the efficacy of ICIs in patients with HRD/BRCA-PCa.
Authors’ contributions
Conceptualization, S.v.W. D.S., P.S. and N.M.; methodology, S.v.W, D.S., P.S., T.E., M.G., L.v.d.W, S.S., S.P., M.S., G.L and J.d.V.; formal analysis, S.v.W., D.S. and P.S.; Investigation, S.v.W., D.S., P.S., T.E., M.S. and G.L., resources, S.v.W, D.S., P.S., T.E., M.G., L.v.d.W, S.S., S.P., M.S., G.L, J.d.V. and N.M.; data curation, S.v.W., D.S. and P.S.; writing—original draft preparation, S.v.W.; writing—review and editing, all authors; visualization, S.v.W. and D.S.; supervision, N.M. All authors have read and agreed to the published version of the manuscript.
Availability of data and material
The raw data supporting the conclusions of this article will be made available by the corresponding author upon request.
Supplemental Material
Download Zip (5.7 MB)Acknowledgments
We thank all participants that provided biomaterial for this study. Shabaz Sultan was supported by the Dutch Cancer Society – Alpe d’HuZes foundation (grant 10620).
Disclosure statement
The authors report there are no competing interest to declare
Supplementary material
Supplemental data for this article can be accessed online at https://doi.org/10.1080/2162402X.2022.2094133
Additional information
Funding
References
- Larkin J, Chiarion-Sileni V, Gonzalez R, Grob -J-J, Rutkowski P, Lao CD, Cowey CL, Schadendorf D, Wagstaff J, Dummer R, et al. Five-year survival with combined nivolumab and ipilimumab in advanced melanoma. N Engl J Med. 2019;381(16):1535–11. doi:10.1056/NEJMoa1910836
- Beer TM, Kwon ED, Drake CG, Fizazi K, Logothetis C, Gravis G, Ganju V, Polikoff J, Saad F, Humanski P, et al. Randomized, double-blind, phase III trial of ipilimumab versus placebo in asymptomatic or minimally symptomatic patients with metastatic chemotherapy-naive castration-resistant prostate cancer. J Clin Oncol. 2017;35(1):40–47. doi:10.1200/JCO.2016.69.1584
- Kwon ED, Drake CG, Scher HI, Fizazi K, Bossi A, van den Eertwegh AJM, Krainer M, Houede N, Santos R, Mahammedi H, et al. Ipilimumab versus placebo after radiotherapy in patients with metastatic castration-resistant prostate cancer that had progressed after docetaxel chemotherapy (CA184-043): a multicentre, randomised, double-blind, phase 3 trial. Lancet Oncol. 2014;15(7):700–712. doi:10.1016/S1470-2045(14)70189-5
- Fizazi K, Drake CG, Beer TM, Kwon ED, Scher HI, Gerritsen WR, Bossi A, den Eertwegh AJMV, Krainer M, Houede N, et al. Final analysis of the ipilimumab versus placebo following radiotherapy phase iii trial in postdocetaxel metastatic castration-resistant prostate cancer identifies an excess of long-term survivors. Eur Urol. 2020;78(6):822–830. doi:10.1016/j.eururo.2020.07.032
- Antonarakis ES, Piulats JM, Gross-Goupil M, Goh J, Ojamaa K, Hoimes CJ, Vaishampayan U, Berger R, Sezer A, Alanko T, et al. Pembrolizumab for treatment-refractory metastatic castration-resistant prostate cancer: multicohort, open-label phase II KEYNOTE-199 study. J Clin Oncol. 2020;38(5):395–405. doi:10.1200/JCO.19.01638
- Sharma P, Pachynski RK, Narayan V, Flechon A, Gravis G, Galsky MD, Mahammedi H, Patnaik A, Subudhi SK, Ciprotti M, et al. Initial results from a phase II study of nivolumab (NIVO) plus ipilimumab (IPI) for the treatment of metastatic castration-resistant prostate cancer (mCRPC; CheckMate 650). J Clin Oncol. 2019;37:142. doi:10.1200/jco.2019.37.7_suppl.142
- Samstein RM, Lee C-H, Shoushtari AN, Hellmann MD, Shen R, Janjigian YY, Barron DA, Zehir A, Jordan EJ, Omuro A, et al. Tumor mutational load predicts survival after immunotherapy across multiple cancer types. Nat Genet. 2019;51:202–206. doi:10.1038/s41588-018-0312-8
- Marabelle A, Fakih M, Lopez J, Shah M, Shapira-Frommer R, Nakagawa K, Chung HC, Kindler HL, Lopez-Martin JA, Miller WH, et al. Association of tumour mutational burden with outcomes in patients with advanced solid tumours treated with pembrolizumab: prospective biomarker analysis of the multicohort, open-label, phase 2 KEYNOTE-158 study. Lancet Oncol. 2020;21:1353–1365. doi:10.1016/S1470-2045(20)30445-9
- Marabelle A, Le DT, Ascierto PA, Di Giacomo AM, De Jesus-Acosta A, Delord J-P, Geva R, Gottfried M, Penel N, Hansen AR, et al. Efficacy of pembrolizumab in patients with noncolorectal high microsatellite instability/ mismatch repair–deficient cancer: results from the phase II KEYNOTE-158 study. J Clin Oncol. 2020;38:1–10. doi:10.1200/JCO.19.02105
- Nguyen L, Martens WM, Van Hoeck J, Cuppen AE. Pan-cancer landscape of homologous recombination deficiency. Nat Commun. 2020;11:1–12. doi:10.1038/s41467-020-19406-4
- Castro E, Goh C, Olmos D, Saunders E, Leongamornlert D, Tymrakiewicz M, Mahmud N, Dadaev T, Govindasami K, Guy M, et al. Germline BRCA mutations are associated with higher risk of nodal involvement, distant metastasis, and poor survival outcomes in prostate cancer. J Clin Oncol. 2013;31:1748–1757. doi:10.1200/JCO.2012.43.1882
- Mota JM, Barnett E, Nauseef JT, Nguyen B, Stopsack KH, Wibmer A, Flynn JR, Heller G, Danila DC, Rathkopf D, et al. Platinum-based chemotherapy in metastatic prostate cancer with DNA repair gene alterations. JCO Precis Oncol. 2020;4:355–366. doi:10.1200/po.19.00346
- Pomerantz MM, Spisák S, Jia L, Cronin AM, Csabai I, Ledet E, Sartor AO, Rainville I, O’Connor EP, Herbert ZT, et al. The association between germline BRCA2 variants and sensitivity to platinum-based chemotherapy among men with metastatic prostate cancer. Cancer. 2017;123:3532–3539. doi:10.1002/cncr.30808
- van der Doelen MJ, Isaacsson Velho P, Slootbeek PHJ, Pamidimarri Naga S, Bormann M, van Helvert S, Kroeze LI, van Oort IM, Gerritsen WR, Antonarakis ES, et al. Impact of DNA damage repair defects on response to radium-223 and overall survival in metastatic castration-resistant prostate cancer. Eur J Cancer. 2020;136:16–24. doi:10.1016/J.EJCA.2020.05.001
- van Dessel LF, van Riet J, Smits M, Zhu Y, Hamberg P, van der Heijden MS, Bergman AM, van Oort IM, de Wit R, Voest EE, et al. The genomic landscape of metastatic castration-resistant prostate cancers reveals multiple distinct genotypes with potential clinical impact. Nat Commun. 2019;10:1–13. doi:10.1038/s41467-019-13084-7
- Reisländer T, Lombardi EP, Groelly FJ, Koch M, Perfetto L, Shrivastava A, Ochoa D, Wagih O, Piñero J, Kotlyar M, et al. BRCA2 abrogation triggers innate immune responses potentiated by treatment with PARP inhibitors. Nat Commun. 2019;10:10. doi:10.1038/s41467-019-11048-5
- Sharma P, Pachynski RK, Narayan V, Fléchon A, Gravis G, Galsky MD, Mahammedi H, Patnaik A, Subudhi SK, Ciprotti M, et al. Nivolumab plus ipilimumab for metastatic castration-resistant prostate cancer: preliminary analysis of patients in the checkmate 650 trial. Cancer Cell. 2020;38:489–499.e3. doi:10.1016/j.ccell.2020.08.007
- Boudadi K, Suzman DL, Anagnostou V, Fu W, Luber B, Wang H, Niknafs N, White JR, Silberstein JL, Sullivan R, et al. Ipilimumab plus nivolumab and DNA-repair defects in AR-V7-expressing metastatic prostate cancer. Oncotarget. 2018;9:28561–28571. doi:10.18632/oncotarget.25564
- Rodrigues DN, Rescigno P, Liu D, Yuan W, Carreira S, Lambros MB, Seed G, Mateo J, Riisnaes R, Mullane S, et al. Immunogenomic analyses associate immunological alterations with mismatch repair defects in prostate cancer. J Clin Invest. 2018;128:4441–4453. doi:10.1172/JCI121924
- Guedes LB, Antonarakis ES, Schweizer MT, Mirkheshti N, Almutairi F, Park JC, Glavaris S, Hicks J, Eisenberger MA, De Marzo AM, et al. MSH2 loss in primary prostate cancer. Clin Cancer Res. 2017;23:6863–6874. doi:10.1158/1078-0432.CCR-17-0955
- Simnica D, Smits M, Willscher E, Fanchi LF, Kloots ISH, van Oort I, Gerritsen W, Mehra N, Binder M. Responsiveness to immune checkpoint inhibitors is associated with a peripheral blood t-cell signature in metastatic castration-resistant prostate cancer. JCO Precis Oncol. 2020:1374–1385. doi:10.1200/PO.20.00209
- van Wilpe S, Tolmeijer SH, Koornstra RHT, de Vries IJM, Gerritsen WR, Ligtenberg M, Mehra N. Homologous Recombination repair deficiency and implications for tumor immunogenicity. Cancers. 2021;13:2249. doi:10.3390/cancers13092249
- Jenzer M, Keß P, Nientiedt C, Endris V, Kippenberger M, Leichsenring J, Stögbauer F, Haimes J, Mishkin S, Kudlow B, et al. The BRCA2 mutation status shapes the immune phenotype of prostate cancer. Cancer Immunol Immunother. 2019;68:1621–1633. doi:10.1007/s00262-019-02393-x
- Kaur HB, Vidotto T, Mendes AA, Salles DC, Isaacs WB, Antonarakis ES, Lotan TL. Association between pathogenic germline mutations in BRCA2 and ATM and tumor-infiltrating lymphocytes in primary prostate cancer. Cancer Immunol Immunother. 2021;2021:1–9. doi:10.1007/S00262-021-03050-Y
- Richards S, Aziz N, Bale S, Bick D, Das S, Gastier-Foster J, Grody WW, Hegde M, Lyon E, Spector E, et al. Standards and guidelines for the interpretation of sequence variants: a joint consensus recommendation of the American College of Medical Genetics and Genomics and the association for molecular pathology. Genet Med. 2015;17:405–424. doi:10.1038/GIM.2015.30
- Li M, Datto M, Duncavage E, Kulkarni S, Lindeman NI, Roy S, Tsimberidou AM, Vnencak-Jones CL, Wolff DJ, Younes A, et al. Standards and guidelines for the interpretation and reporting of sequence variants in cancer: a joint consensus recommendation of the Association for Molecular Pathology, American Society of Clinical Oncology, and College of American Pathologists. J Mol Diagn. 2017;19:4–23. doi:10.1016/J.JMOLDX.2016.10.002
- Mateo J, Seed G, Bertan C, Rescigno P, Dolling D, Figueiredo I, Miranda S, Nava Rodrigues D, Gurel B, Clarke M, et al. Genomics of lethal prostate cancer at diagnosis and castration resistance. J Clin Invest. 2020;130:1743–1751. doi:10.1172/JCI132031
- Schweizer M, Sivakumar S, Tukachinsky H, Coleman I, De Sarkar N, Yu EY, Konnick EQ, Nelson PS, Pritchard CC, Montgomery B, et al. Concordance of DNA repair gene mutations in paired primary prostate cancer samples and metastatic tissue or cell-free DNA. JAMA Oncol. 2021;7(9):1378. doi:10.1001/JAMAONCOL.2021.2350
- Priestley P, Baber J, Lolkema MP, Steeghs N, de Bruijn E, Shale C, Duyvesteyn K, Haidari S, van Hoeck A, Onstenk W, et al. Pan-cancer whole-genome analyses of metastatic solid tumours. Nature. 2019;575(7781):210–216. doi:10.1038/s41586-019-1689-y
- Gorris MAJ, Halilovic A, Rabold K, van Duffelen A, Wickramasinghe IN, Verweij D, Wortel IM, Textor JC, de Vries IJ, Figdor CG. Eight-color multiplex immunohistochemistry for simultaneous detection of multiple immune checkpoint molecules within the tumor microenvironment. J Immunol. 2017;ji1701262. doi:10.4049/jimmunol.1701262
- Sultan S, Gorris MAJ, van der Woude LL, Buytenhuijs F, Martynova E, van Wilpe S, Verrijp K, Figdor CG, de Vries IJ, Textor J. A segmentation-free machine learning architecture for immune landscape phenotyping in solid tumors by multichannel imaging. BioRxiv. 2021. doi:10.1101/2021.10.22.464548
- Calagua C, Russo J, Sun Y, Schaefer R, Lis R, Zhang Z, Mahoney K, Bubley GJ, Loda M, Taplin M-E, et al. Expression of PD-L1 in hormone-naïve and treated prostate cancer patients receiving neoadjuvant Abiraterone acetate plus prednisone and leuprolide. Clin Cancer Res. 2017;23(22):6812–6822. doi:10.1158/1078-0432.CCR-17-0807
- Sharma M, Yang Z, Miyamoto H, Lucarelli G. Immunohistochemistry of immune checkpoint markers PD-1 and PD-L1 in prostate cancer. Med. 2019:98. doi:10.1097/MD.0000000000017257
- Fankhauser CD, Schüffler PJ, Gillessen S, Omlin A, Rupp NJ, Rueschoff JH, Hermanns T, Poyet C, Sulser T, Moch H, et al. Comprehensive immunohistochemical analysis of PD-L1 shows scarce expression in castration-resistant prostate cancer. Oncotarget. 2018;9(12):10284–10293. doi:10.18632/oncotarget.22888
- Haffner MC, Guner G, Taheri D, Netto GJ, Palsgrove DN, Zheng Q, Guedes LB, Kim K, Tsai H, Esopi DM, et al. Comprehensive evaluation of programmed death-ligand 1 expression in primary and metastatic prostate cancer. Am J Pathol. 2018;188(6):1478–1485. doi:10.1016/j.ajpath.2018.02.014
- Bolotin DA, Poslavsky S, Mitrophanov I, Shugay M, Mamedov IZ, Putintseva EV, Chudakov DM. MiXCR: software for comprehensive adaptive immunity profiling. Nat Methods. 2015;12(5):380–381. doi:10.1038/nmeth.3364.
- Simnica D, Akyüz N, Schliffke S, Mohme MV, Wenserski L, Mährle T, Fanchi LF, Lamszus K, Binder M. T cell receptor next-generation sequencing reveals cancer-associated repertoire metrics and reconstitution after chemotherapy in patients with hematological and solid tumors. Oncoimmunology. 2019;8. doi:10.1080/2162402X.2019.1644110
- Nazarov VI, Pogorelyy MV, Komech EA, Zvyagin IV, Bolotin DA, Shugay M, Chudakov DM, Lebedev YB, Mamedov IZ. tcR: an R package for T cell receptor repertoire advanced data analysis. BMC Bioinforma. 2015;16:1–5. doi:10.1186/S12859-015-0613-1
- Huang H, Wang C, Rubelt F, Scriba TJ, Davis MM. Analyzing the Mycobacterium tuberculosis immune response by T-cell receptor clustering with GLIPH2 and genome-wide antigen screening. Nat Biotechnol. 2020;38:1194–1202. doi:10.1038/s41587-020-0505-4
- Sethna Z, Elhanati Y, Callan CG, Walczak AM, Mora T, Berger B. OLGA: fast computation of generation probabilities of B- and T-cell receptor amino acid sequences and motifs. Bioinformatics. 2019;35:2974–2981. doi:10.1093/BIOINFORMATICS/BTZ035
- Elhanati Y, Sethna Z, Callan CG, Mora T, Walczak AM. Predicting the spectrum of TCR repertoire sharing with a data-driven model of recombination. Immunol Rev. 2018;284:167–179. doi:10.1111/IMR.12665
- Chu ND, Bi HS, Emerson RO, Sherwood AM, Birnbaum ME, Robins HS, Alm EJ. Longitudinal immunosequencing in healthy people reveals persistent T cell receptors rich in highly public receptors. BMC Immunol. 2019;20:1–12. doi:10.1186/s12865-019-0300-5
- Sheikh N, Cham J, Zhang L, DeVries T, Letarte S, Pufnock J, Hamm D, Trager J, Fong L. Clonotypic diversification of intratumoral T cells following sipuleucel-T treatment in prostate cancer subjects. Cancer Res. 2016;76(13):3711–3718. doi:10.1158/0008-5472.CAN-15-3173.
- Cha E, Klinger M, Hou Y, Cummings C, Ribas A, Faham M, Fong L. Improved survival with T cell clonotype stability after anti-CTLA-4 treatment in cancer patients. Sci Transl Med. 2014;6:238ra70. doi:10.1126/scitranslmed.3008211
- Roudko V, Bozkus C, Orfanelli T, McClain CB, Carr C, O’Donnell T, Chakraborty L, Samstein R, Huang K-L, Blank SV, et al. Shared immunogenic poly-epitope frameshift mutations in microsatellite unstable tumors. Cell. 2020;183:1634–1649.e17. doi:10.1016/J.CELL.2020.11.004
- Fizazi K, González Mella P, Castellano D, Minatta JN, Rezazadeh Kalebasty A, Shaffer D, Vázquez Limón JC, Sánchez López HM, Armstrong AJ, Horvath L, et al. Nivolumab plus docetaxel in patients with chemotherapy-naïve metastatic castration-resistant prostate cancer: results from the phase II CheckMate 9KD trial. Eur J Cancer. 2022;160:61–71. doi:10.1016/J.EJCA.2021.09.043
- Obradovic AZ, Dallos MC, Zahurak ML, Partin AW, Schaeffer EM, Ross AE, Allaf ME, Nirschl TR, Liu D, Chapman CG, et al. T-cell infiltration and adaptive treg resistance in response to androgen deprivation with or without vaccination in localized prostate cancer. Clin Cancer Res. 2020;26:3182–3192. doi:10.1158/1078-0432.CCR-19-3372
- Powles T, Yuen KC, Gillessen S, Kadel EE, Rathkopf D, Matsubara N, Drake CG, Fizazi K, Piulats JM, Wysocki PJ, et al. Atezolizumab with enzalutamide versus enzalutamide alone in metastatic castration-resistant prostate cancer: a randomized phase 3 trial. Nat Med. 2022;28:144–153. doi:10.1038/s41591-021-01600-6