
ABSTRACT
B cells are emerging as key players of anti-tumor adaptive immune responses. We investigated regulatory and pro-inflammatory cytokine-expressing B cells in patients with melanoma by flow cytometric intracellular cytokine, CyTOF, transcriptomic, immunofluorescence, single-cell RNA-seq, and B:T cell co-culture analyses. We found enhanced circulating regulatory (TGF-β+ and PD-L1+) and reduced pro-inflammatory TNF-α+ B cell populations in patients compared with healthy volunteers (HVs), including lower IFN-γ+:IL-4+ and higher TGF-β+:TNF-α+ B cell ratios in patients. TGF-β-expressing B cells in the melanoma tumor microenvironment assembled in clusters and interacted with T cells via lymphoid recruitment (SELL, CXCL13, CCL4, CD74) signals and with Tregs via CD47:SIRP-γ, and FOXP3-promoting Galectin-9:CD44. While reduced in tumors compared to blood, TNF-α-expressing B cells engaged in crosstalk with Tregs via TNF-α signaling and the ICOS/ICOSL axis. Patient-derived B cells promoted FOXP3+ Treg differentiation in a TGF-β-dependent manner, while sustaining expression of IFN-γ and TNF-α by autologous T-helper cells and promoting T-helper cell proliferation ex vivo, an effect further enhanced with anti-PD-1 checkpoint blockade. Our findings reveal cytokine-expressing B cell compartments skewed toward regulatory phenotypes in patient circulation and melanoma lesions, intratumor spatial localization, and bidirectional crosstalk between B and T cell subsets with immunosuppressive attributes.
Introduction
Melanoma is considered a highly immunogenic malignancy, evidenced by systemic and local activation of immune responses, significant infiltration of immune cells, and high neoantigenic load.Citation1 Despite this, studies into the immune response to melanoma have identified several features including regulatory T cells (Tregs) likely to contribute to immune escape. B cells have been historically considered as positive regulators of immune responses. Through differentiation into antibody-secreting plasmablasts and plasma cells, and by acting as professional antigen presenting cells, B cells can prime and activate CD4+ and CD8+ T cells, and may promote the clearance of pathogens or malignant cells.Citation2–4 In contrast, there is also emerging evidence for the role of B cells in the regulation of immune responses, with autoantibody expression found to be associated with disease burden.Citation5 IL-10-expressing regulatory B cells (Bregs) have been reported in patients with multiple sclerosis,Citation6 systemic lupus erythematosus,Citation7 and rheumatoid arthritis,Citation8 and data from mouse models also indicate that IL-10+ Bregs could contribute to tumor progression.Citation9
Besides IL-10-expressing B cells, additional subsets of regulatory B cells have been identified in humans. Naïve PD-L1-expressing B cells are reported to be upregulated in patients with advanced melanoma, which functions by curtailing T cell responses ex vivo.Citation10 A novel IgG4+ CD49b+ CD73+ B cell subset has been reported in the peripheral blood and tumors of melanoma patients, which expressed pro-angiogenic and inflammatory mediators including VEGF, CYR61, ADM, FGF2, PDGFA, and MDK, and promoted endothelial cell tube formation in vitro.Citation11 Alongside the presence of B cells expressing regulatory cytokines and inhibitory ligands, B cells expressing pro-inflammatory mediators, including TNF-α, remain poorly explored. One study reported that B cells from melanoma patients' peripheral blood express TNF-α and/or IL-6, and TNF-α transcripts from single B cells extracted from melanoma metastases were associated with reduced responsiveness to checkpoint inhibitor immunotherapy.Citation12
Although features reflecting a perturbed regulatory B cell landscape have been reported in cancersCitation13 including breast,Citation14,Citation15 gastric,Citation16,Citation17 and head and neck squamous cell carcinoma,Citation18 the systemic and intratumoral regulatory B cell landscape in cancer patients has not yet been thoroughly explored, most likely represents multiple immunomodulatory properties, B cell lineages, and phenotypes, and may differ among tumor types. Furthermore, more broad investigations into the phenotype and function of TGF-β or IL-10-producing regulatory and IFN-γ- or TNF-α-expressing inflammatory B cells in human melanoma are still lacking.
Here, by intracellular cytokine assays, multicolor flow, and cytometry by time of flight (CyTOF), immunohistochemistry/immunofluorescence (IHC/IF), ex vivo co-culture studies, coupled with single-cell RNA-seq and bulk gene expression data analyses, we investigated cytokine-expressing (TGF-β, IL-4, IL-10, IFN-γ, and TNF-α) B cells in the circulation of patients with melanoma and healthy volunteers, and in human melanoma lesions. We studied evidence of interactions between cytokine expressing B cells with conventional (Tcon) and regulatory (Treg) T cell populations. In the co-culture assays, we evaluated the potential of melanoma patient B cells to mediate modulation of autologous CD4+ T-helper cell phenotype and functions, including the modulation of T cell proliferation, TNF-α, IFN-γ, and FOXP3 expression and induction of FOXP3+ Tregs.
Materials and methods
Human tissue samples
Human venous blood samples were collected from healthy volunteers (HV); blood and cancer lesion specimens were sourced from patients with melanoma. Peripheral blood mononuclear cells (PBMCs) were isolated from venous whole blood samples using Ficoll-Paque PLUS density gradient centrifugation, within 24 hours of phlebotomy. Single-cell suspensions were prepared from melanoma specimens as previously described.Citation19 All samples were collected in accordance with the Human Tissue Act 2006 and with informed written consent in accordance with the Helsinki Declaration. This study was approved by the Guy’s Research Ethics Committee, Guy’s and St Thomas NHS Trust. The studies were conducted at King’s College London, Guy’s and St Thomas’ NHS Foundation Trust: 08/H0804/139 approved by the London Bridge NRES committee; 16/LO/0366, approved by the London-Central NRES Committee. Healthy volunteer and melanoma patient clinical information is described in Supplementary Table 1 and Supplementary Table 2.
CyTOF phenotyping
For CyTOF (Cytometry by Time of Flight) phenotypic analysis, 34 metal-tagged antibodies were used to stain frozen PBMCs from 26 melanoma patients and 12 age-matched HV. Antibodies included were specific to cell surface and intracellular markers (stained separately) with a focus on B cell phenotyping. Cells were stained with a mixture of commercially available antibodies from Fluidigm®, and in-house conjugated antibodies. Files (.fcs) were processed and normalized using Fluidigm® (CyTOF normalization software 2). The CD19 population of interest was manually gated in FlowJo (illustrated in Supplementary Figure 1) and subsequently .fcs files were uploaded in R. A selection of 19 B cell directed phenotypic markers were subsequently used to perform in-depth B cell phenotyping to allow downstream identification of TGF-β and PD-L1 expressing regulatory B cells. We used a modified R script based on the CATALYST, diffCYT, FlowSOM, edgeR, and flowCORE packages, which can be found using the bioconductor terminal https://www.bioconductor.org/packages/release/bioc/vignettes/CATALYST/inst/doc /differential.html. Unsupervised clustering of B cell populations was performed using FlowSOM package to generate aggregates of B cells with phenotypic similarities. High dimensionality reduction was performed for data visualization in a 2D plot using a UMAP (Uniform Manifold Approximation and Projection) algorithm.Citation20 Further details concerning cell staining, quantification, and data analysis can be found in Supplementary Materials and Methods.
Intracellular cytokine assay
A flow cytometry-based intracellular cytokine assay was used to investigate the cytokine expression profiles among key B cell subpopulations in HV and melanoma patient peripheral blood, and tumor specimens. First, PBMCs were isolated from peripheral blood, and single cells isolated from melanoma lesions. Cell suspensions (4x10⁶ cells/ml) were cultured in sterile DMEM (10% Fetal Bovine Serum (FBS) and 50 U/ml Pen-Strep; Thermo Fisher Scientific) containing up to four conditions, in order to capture Breg and inflammatory B cell populations responding via innateCitation2 and adaptiveCitation7 pathways: 0.1 µg/ml CpG ODN 2006 (Miltenyi Biotec), 10 µg/ml CpG ODN 2006, 1 µg/ml CD40L (BioLegend), or both 1 µg/ml CD40L and 10 µg/ml CpG ODN 2006. For each condition, 500 µl per well was added to flat-bottom 24-well plates and plates were incubated at 37°C with 5% CO2 for 72 hours. TGF-β-expressing B cells were analyzed in human blood samples without the requirement for ex vivo cellular activation, since TGF-β expression was detected in freshly isolated cells and our analyses showed TGF-β expression was reduced with additional ex vivo activation (Supplementary Figure 2). For the detection of IL-10, IL-4, IFN-γ and TNF-α, Cell Activation Cocktail with Brefeldin A (BioLegend; final concentration 0.08 µM phorbol-12-myristate 13-acetate (PMA) and 1.34 µM ionomycin) was added for the final 6 hours of culture to stimulate intracellular cytokine production. For each stimulated sample, an unstimulated condition containing no Cell Activation Cocktail was analyzed and used for setting the gating for cytokine-positive cells.
Post-culture, cells were washed twice and LIVE/DEAD Near-IR Fixable (Thermo Fisher Scientific) dye was added. Cells were then incubated with Human Fc block (BD Biosciences) prior to extracellular labeling as follows: anti-CD19-V500 (HIB19, BD Biosciences), anti-CD27-BV711 (O323, BioLegend), anti-IgD-BV421 (IA6-2, BioLegend), anti-CD38-BV785 (HIT2, BD Biosciences), anti-IgM-PE-Cy7 (MHM-88, BioLegend), anti-CD24-BUV395 (ML5, BD Biosciences), anti-CD3-APC-Cy7 (SKY7, BioLegend), and anti-CD5-AF700 (L17F12, BioLegend). Anti-PD-L1-FITC (MIH1, BD Biosciences) was also included in select experiments as indicated.
Cells were washed and fixed with BD Fixation and Permeabilization Solution (BD Biosciences). The cells were washed and intracellular labeling performed with anti-IL-10-AF647 (JES3-9D7, BioLegend), anti-TGF-β1-PE (TW4-9E7, BD Biosciences) and anti-TNF-α-AF488 (MAb11, BioLegend) in BD Perm/Wash buffer (BD Biosciences). Anti-IL-4-BV605 (MP4-25D2, BioLegend), anti-IFN-γ-AF700 (4S.B3, BioLegend) and anti-TLR9-PE (S16013D, BioLegend) were also included in select experiments. Cells were washed, acquired on the CytoFLEX Flow Cytometer (Beckman Coulter), and analyzed in FlowJo v10.4 (BD Biosciences). Gating strategies for the identification of live single CD19+ B cells, and TGF-β and PD-L1 isotype controls, are illustrated in Supplementary Figure 3(a-c). To account for the expansion in memory B cell lineages in cells, which received stimulation with 0.1 µg/ml CpG or CD40L + 10 µg/ml CpG (Supplementary Figure 4(a)), lineage analysis (identifying enriched phenotypes among cytokine+ B cells) was performed against the baseline phenotype of cytokine− cells.
B cell lineage and isotype profiling
CD19+ B cell lineage phenotypes were categorized according to CD24/CD38 expression: memory B cells (Bm; CD24hi CD38−), transitional B cells (TrB; CD24hi CD38hi), naïve B cells (CD24int CD38int) and plasmablasts (PB; CD24− CD38++). B cells were defined by antibody expression into non-class switched (IgM+IgD+, IgM+IgD−, IgM−IgD+) and class-switched IgM−IgD− subsets.
Dimensionality reduction using the tSNE and FlowSOM algorithms
Live single CD19+ B cells were gated, and dimensionality reduction was applied using the t-Distributed Stochastic Neighbor Embedding (tSNE) algorithm. Two-dimensional tSNE projections were generated utilizing the following parameters: CD27, IgD, IgM, CD24, and CD38. The Exact (vantage point tree) KNN and Barnes-Hut gradient algorithms with opt-SNE configuration (up to 1000 iterations) were used. The FlowSOM algorithm was used to generate six meta-clusters per sample based upon the five-marker panel.
Single cell RNA-sequencing (scRNA-seq) analysis
Single-cell RNA-seq data from tumors of treatment-naive patients (N = 12, Supplementary Table 2) were selected from the publicly available dataset GSE123139.Citation21 The data were analyzed using Seurat package (version 4.0.6).Citation22 All cells (N = 19944) were filtered to include cells with gene counts greater than 200 and less than 3000. Data were normalized to 10000 counts per cell, log transformed, and 3000 highly variable features were identified (method = “vst”). Subsequently, data were scaled and principal component analysis performed. The first 30 PCs and a resolution were used to cluster the cells with the Louvain algorithm (resolution 1). DoubletFinderCitation23 was used to remove the predicted doublets, and the remaining cells (N = 18325) were used for downstream analyses.
Clusters containing B cells (N = 2284, markers: CD79A, CD79B, MS4A1) and plasma cells (N = 268, markers: CD38, SDC1) were selected and reanalyzed in the same manner using 500 variable features, the first 10 PCs and a clustering resolution parameter of 0.5.
CellPhoneDB (version 2)Citation24 was used to infer cell–cell interactions in the GSE123139 dataset after the DoubletFinder step. Clusters annotated as T cells (markers: CD3E, CD4, CD8A) and B cells (markers: CD79A, CD79B, MS4A1) were selected. T cells were split into conventional (Tcon, N = 10442) and regulatory T cells (Treg, N = 703, marker: FOXP3). B cells were subsetted into TGF-β+ (N = 269) or TNF-α+ (N = 22) based on non-zero counts of TGFB1 and TNF genes in the raw data. Interactions were filtered using FDR < 0.001, and manually annotated into communication pathways associated with cell–cell contact, inhibitory checkpoints, co-stimulation, pro-inflammatory mediators, lymphocyte homing, recruitment, and assembly, leukotriene synthesis, negative regulation of inflammation, and inhibition of B cell responses.
Bulk RNA-seq analysis
The melanoma dataset from TCGA-SCKMCitation25 was separated based on tumor type (primary/metastatic) and site of resection or biopsy into primary (N = 103), metastatic skin (N = 116) and metastatic viscera (N = 36). TPM-normalized values were used to calculate Spearman’s rank correlation between selected genes using ggpubr R package (version 0.4.0). Additional analyses were performed using the UALCAN online tool.Citation26
Spatial transcriptomics analysis
Melanoma tumor samples frozen in OCT from three different patients were processed following 10x Spatial Transcriptomics protocol, with permeabilization time of 24 minutes and tissue thickness of 10µm. FASTQ files were mapped to human genome reference (GRCh38-2020-A), and the sequencing data was processed using SpaceRanger v1.3.1 (10x Genomics). Raw counts data were extracted in Seurat, and presence of at least one marker gene at non-zero counts was used to classify cell populations per spot: T cells (CD3D, CD3E, CD3G, CD247, and CD4), Tregs (FOXP3, IL2RA, and TNFRSF4), and B cells (CD19, MS4A1, CD79A, and CD79B). Venn diagrams were created using R package ggvenn (v0.1.9).
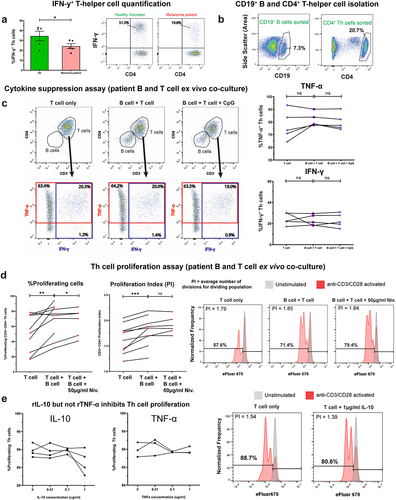
Cytokine suppression assay in B and T-helper cell co-culture
CD19+ B lymphocytes and CD4+ T-helper (Th) lymphocytes were isolated from peripheral blood of melanoma patients using the BD FACS Aria II cell sorter. Purified B and Th lymphocyte suspensions were co-cultured (1x10⁵ each/well) in sterile DMEM (10% FBS, 50 U/ml Pen-Strep) media containing Dynabeads® Human T-Activator CD3/CD28 (1x10⁵ beads/well; Thermo Fisher Scientific) and 10 U/ml recombinant IL-2 (PeproTech). 10 µg/ml CpG ODN 2006 was added to selected co-culture wells. Th cells (1x10⁵) were also cultured alone as control. 100 µl per well was added to round-bottom 96 well plates for each condition. The plates were incubated at 37°C with 5% CO2 for 72 hours. Cell Activation Cocktail (with Brefeldin A; BioLegend) was added for the final 6 hours of culture. For each sample, an unstimulated condition containing no Cell Activation Cocktail was analyzed.
Post-culture, cells were washed twice and LIVE/DEAD Near-IR Fixable dye was added. Cells were then incubated with Human Fc block (BD Biosciences) prior to extracellular labeling with anti-CD4-PE (A161A1, BioLegend). Cells were washed and fixed with BD Fixation and Permeabilization Solution (BD Biosciences). The cells were washed and intracellular labeling performed with anti-IFNγ-APC (4S.B3, BioLegend) and anti-TNF-α-AF488 (MAb11, BioLegend) in BD Perm/Wash buffer (BD Biosciences). Cells were washed, acquired on the CytoFLEX Flow Cytometer (Beckman Coulter) and analyzed in FlowJo v10.4 (BD Biosciences).
Treg induction assay of B and conventional T-helper lymphocyte co-culture
CD19+ B lymphocytes and CD4+ CD25−/int CD127+ conventional T-helper (Tcon) lymphocytes were isolated from peripheral blood of melanoma patients using the BD FACS Aria II cell sorter. Purified B and Tcon lymphocyte suspensions were co-cultured (1x10⁵ each/well) in sterile DMEM (10% FBS, 50U/ml Pen-Strep) media containing Dynabeads® Human T-Activator CD3/CD28 (1x10⁵ beads/well) and 10 U/ml recombinant IL-2. Tcon cells (1x10⁵) were also cultured alone as control. 100µl per well was added to round-bottom 96 well plates for each condition. The plates were incubated at 37°C with 5% CO2 for 72 hours.
Post-culture, cells were washed twice and LIVE/DEAD Near-IR Fixable dye was added. Cells were then incubated with Human Fc block (BD Biosciences) prior to extracellular labeling with anti-CD4-PE (A161A1, BioLegend). Cells were washed and fixed with Foxp3 Fixation/Permeabilization solution (Thermo Fisher Scientific). The cells were then washed in Permeabilization Solution (Thermo Fisher Scientific) and intracellular labeling performed with anti-FOXP3-AF488 antibody (259D, BioLegend). Cells were washed, acquired on the CytoFLEX Flow Cytometer (Beckman Coulter) and analyzed in FlowJo v10.4.
Cellular proliferation assay of B and T-helper lymphocyte co-cultures
CD19+ B lymphocytes and CD4+ T-helper (Th) lymphocytes were isolated from peripheral blood of melanoma patients using RosetteSep™ Human B and CD4+ T Cell Enrichment Cocktails, respectively (STEMCELL Technologies). Purified B and Th lymphocyte suspensions were stained with 0.5µM eBioscience Cell Proliferation Dye eFluor 670 (Thermo Fisher Scientific) in PBS for 10 minutes at 37°C and washed three times in sterile ExCellerate B Cell Media (Bio-Techne) with 50U/ml Pen-Strep. B and T lymphocytes were co-cultured (1x10⁵ each/well) in media containing Dynabeads® Human T-Activator CD3/CD28 (1x10⁵ beads/well) and 10 U/ml recombinant IL-2. 50µg/ml Nivolumab (Bristol Myers Squibb) was added to selected co-culture wells. Th cells (1x10⁵) were also cultured alone as control. 0.01–1 µg/ml recombinant IL-10 or TNF-α (BioLegend) was added to selected T-helper monoculture wells. 100µl per well was added to round-bottom 96 well plates for each condition. The plates were incubated at 37°C with 5% CO2 for 72 hours.
Post-culture, cells were washed twice and LIVE/DEAD Near-IR Fixable dye was added. Cells were then incubated with Human Fc block (BD Biosciences) prior to extracellular labeling with anti-CD4-PE (A161A1, BioLegend). Cells were washed, acquired on the CytoFLEX Flow Cytometer (Beckman Coulter), and proliferation modeling was performed in FlowJo v10.4.
Immunofluorescence staining of tumor specimens
Sections of frozen metastatic melanoma tumor tissue were thawed at room temperature (RT) and fixed with pre-cooled Acetone and Ethanol for 10 minutes each. Sections were washed and incubated with blocking buffer (0.1% BSA in 0.1% TBS-T) for 1 hour at RT, prior to primary antibody incubation for 1 hour at RT with one of either 5µg/ml rabbit anti-IL-10 (polyclonal, Abcam), 8µg/ml rabbit anti-TNF-α (TNFA/1500R, Abcam), or 1µg/ml rabbit anti-TGFβ1 (EPR21143, Abcam) in addition to 10µg/ml rat anti-CD3 (CD3-12, Abcam) and mouse anti-CD20 (1/50 dilution, L26, Abcam). Sections were washed and incubated with 10µg/ml cross-adsorbed donkey secondary antibodies (Abcam): anti-rabbit IgG AF594, anti-mouse IgG AF488 and anti-rat IgG AF647. Sections were washed and mounted with ProLong Gold Antifade Mountant with DAPI (Thermo Fisher Scientific). Slides were incubated for 24 hours prior to visualization on the Olympus VS120-S6-W slide scanning microscope.
Statistical analyses
All data represent mean values ± standard error (SEM). Analysis of differences in mean between two distinct groups was performed using the student’s T-test for unpaired samples, and paired T-test for matched samples. All t-tests were two-tailed. Where multiple groups are compared, two-way Analysis of Variance (ANOVA) with Tukey’s multiple comparison test was employed. Survival analysis was performed using the log-rank (Mantel-Cox) test. P values were reported with the following associated symbols: P > .05 (ns), P < .05 (*), P < .01 (**), P < .001 (***), P < .0001 (****). P < .05 was considered to represent statistical significance.
Results
Enriched TGF-β+ and PD-L1+ regulatory and reduced TNF-α+ and IFN-γ+ pro-inflammatory B cell populations in melanoma patient circulation
In circulating B cells of melanoma patient and age- and sex-matched healthy volunteer (HV) cohorts (characteristics in Supplementary Table 1 & Supplementary Table 2) we first explored expression the regulatory cytokines TGF-β and IL-10, using a flow cytometric intracellular cytokine assay. We found enrichment in TGF-β and PD-L1-expressing regulatory B cell (Breg) populations among the patient compared to the HV group (. Lineage analysis of both Breg compartments revealed that TGF-β-expressing B cells were significantly more likely to express CD27, IgD, and IgM compared to the baseline phenotype (TGF-β− cells), denoting that TGF-β was associated with memory B cells of a non-isotype-switched phenotype (). Similarly, PD-L1-expressing B cells were significantly more likely to express IgD compared to the baseline, suggesting that PD-L1 expression may be associated with a non-isotype switched B cell phenotype (). In patient blood, single positive (TGF-β− PD-L1+ and TGF-β+ PD-L1−) and double positive (TGF-β+ PD-L1+) B cell populations were present across B cell lineages with TGF-β+ PD-L1+ being prevalent among non-class switched (IgM+) B cells (, Supplementary Figure 4(b)). CyTOF analyses of peripheral blood B cells (CyTOF 34-marker panel) identified enriched circulating TGF-β and PD-L1-expressing CD19+ CD38int IgD+ CD27− Bregs in melanoma patients (N = 26) compared to age- and sex-matched HV (N = 12) (. Contrastingly, detection of IL-10-expressing B cells using different ex vivo B cell stimuli showed no significant differences in the proportion of circulating IL-10+ cells in the CD19+ B cell compartment (), with lineage analysis showing expression in the memory phenotype (, Supplementary Figure 4 (c)).
Figure 1. TGF-β- and PD-L1-expressing Bregs are enriched in melanoma patient compared to healthy volunteer peripheral blood and show preference toward specific B cell lineage phenotypes.
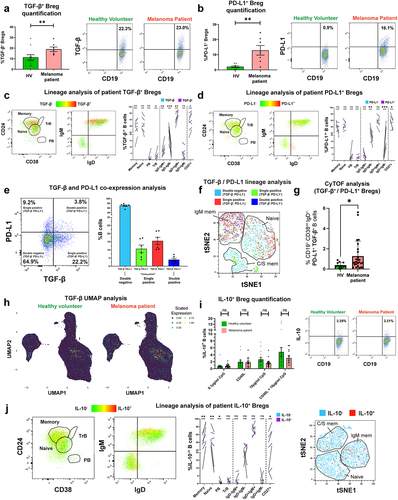
We next evaluated circulating B cells expressing pro-inflammatory cytokines IFN-γ and TNF-α, and the Th2 cytokine IL-4. In the small IFN-γ+ B cell populations following innate stimulation (CpG ODN 2006), we observed significantly lower proportions of IFN-γ+ inflammatory B cells in melanoma patients compared to matched HV (). No significant differences were found in circulating IL-4-expressing CD19+ B cells (. However, the ratio of IFN-γ+:IL-4+ B cells, a pro-inflammatory measure, which may represent the balance between Th1 (IFN-γ+) and Th2 (IL-4+) phenotypes,Citation27 was significantly lower in melanoma patients compared to matched HV ().
Figure 2. IFN-γ+ and TNF-α+ B cells are significantly downregulated in melanoma compared to healthy volunteer blood, and patient TNF-α+ B cells show preference for CD27+ memory B cell phenotypes.
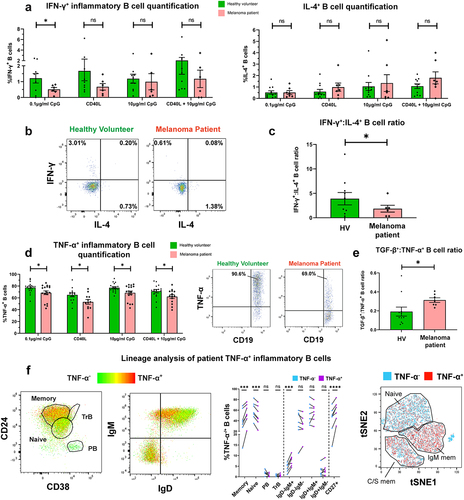
In contrast, a substantial proportion of patient and HV circulating B cells responded to innate pathway activation with polarized expression of TNF-α. However, we observed a collapse in the proportions of circulating TNF-α-expressing B cells in melanoma patients compared to matched HV () evident across all B cell stimulation conditions. Moreover, the ratio of TGF-β+:TNF-α+ B cells was significantly increased in melanoma patients compared to matched HV, suggesting an overall skew toward regulatory cytokine expression in patient B cells (). TNF-α-expressing B cells were also significantly more likely to possess a memory B cell phenotype compared to the baseline (, Supplementary Figure 4(d)).
These findings point to a level of dysregulation among melanoma patient circulating B cells, evident through expanded populations of TGF-β+, PD-L1+ Breg, and reduced IFN-γ+, TNF-α+ pro-inflammatory B cell compartments in the total peripheral blood B cell populations of patients with melanoma.
TGF-β-expressing B cells infiltrate melanoma lesions, while TNF-α-expressing B cell populations are collapsed among tumor-infiltrating B lymphocytes (TIL-B)
We next sought to investigate melanoma tumor-infiltrating B lymphocytes (TIL-B) and their cytokine expression profiles by immunohistochemistry, flow cytometric analyses, combined with bulk and single-cell RNA-seq analyses from publicly available datasets. Gene expression data from melanoma cutaneous lesion and normal skin cohorts (N = 1019 tissues) showed enhanced expression of the pan-B cell marker CD79A in melanoma compared to normal skin ( and immunohistochemical/immunofluorescence (IHC/IF) analyses showed the presence of TIL-B within clusters located adjacent to melanoma tumor islets ()).
Figure 3. Prevalent TGF-β-expressing Bregs and rare TNF-α-expressing inflammatory B cells in melanoma lesions.
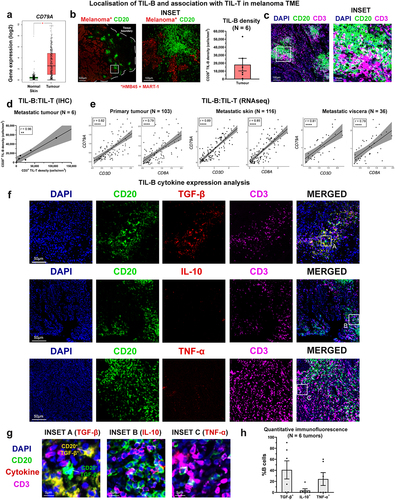
IHC/IF evaluations also identified accompaniment of T cells within the TIL-B clusters in the melanoma TME, prominent in peritumoral areas ( and established a positive correlation between CD20+ TIL-B and CD3+ TIL-T densities among tumors (N = 6) (). Consistent with these observations, bulk RNA-seq gene expression data (TCGA cohort) analyses of human melanoma samples across primary lesions, metastatic skin, and visceral metastases, confirmed TIL-B (CD79A) gene expression to positively correlate with tumor-infiltrating T lymphocyte (TIL-T) (CD3), and cytotoxic T lymphocyte (CD8A+) gene expression, in both primary melanomas, as well as skin and visceral metastases (Spearman’s rank correlation test to calculate correlation coefficients (r) and p-values) ()).
Although there were no significant differences in overall expression of TGF-β, IL-10, or TNF-α between melanoma lesions and normal skin (bulk RNA-seq, Supplementary Figure 5), IHC/IF evaluations identified cytokine-expressing TIL-B, found in close proximity to CD3+ TIL-T ( Supplementary Figure 6). IHC/IF analyses of melanoma lesions identified substantial populations of TGF-β-expressing and TNF-α-expressing CD20+ TIL-B in melanoma lesions, while the presence of IL-10+ TIL-B was less frequent (. Additionally, intracellular cytokine phenotyping of TIL-B within single-cell suspensions obtained from melanoma lesions evaluated by flow cytometry showed no significant differences in the low percentages of IL-10-expressing Bregs among CD19 + B cells in the TME compared to the patient circulation, while TNF-α-expressing (CD19+) B cells were significantly reduced in melanoma lesions compared to the circulation (Supplementary Figure 7(a-c)).
Collectively, our results reveal cytokine-expressing TIL-B in melanoma, and evidence of clustering and association with T cells in the TME. These provide support for prominent regulatory TGF-β-expressing B cell profiles in melanoma lesions.
Associations and crosstalk between TGF-β+ and TNF-α+ B cells with T cells in the tumor microenvironment (TME)
Based on our observations of cytokine expressing B cells found in clusters with T cells in melanoma lesions, we wished to investigate whether B cells, including cytokine-expressing Breg populations, may engage in functional crosstalk with the T cell response in melanoma.
In a single-cell RNA-seq analysis of pooled TIL-B from 12 samples of cutaneous melanoma lesions from a publicly available dataset (GSE123139)Citation21 enriched in stage III individuals (Supplementary Table 2), we identified 2529 B cells, including a proportion of tumor-infiltrating TGF-β+ Bregs, (11.3%), while populations of IL-10+ (0.1%) and TNF-α+ (0.9%) TIL-B were less frequently detected (), in agreement with our quantitative IHC/IF analyses (). Both tumor-infiltrating TGF-β+ (78.6%) and TNF-α+ (87.0%) B cells were predominantly of the class-switched memory phenotype (), supporting the notion that memory B cells may be a key source of cytokine expression in melanoma lesions. In addition, minimal TGF-β and TNF-α co-expression was observed among TIL-B (), suggesting that the expression of each cytokine may be mutually exclusive among the B cell tumor infiltrate.
Figure 4. TGF-β and TNF-α-expressing B cells engage in functional crosstalk with Tcon and Treg cells in the TME.
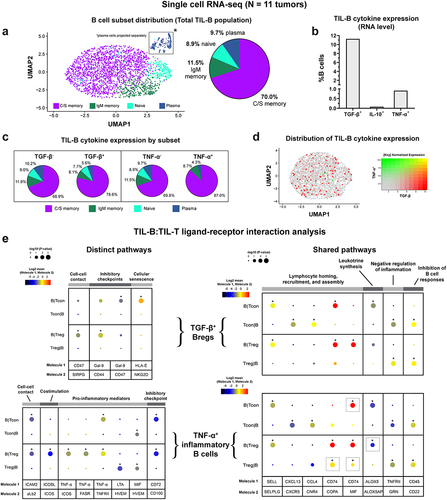
We then probed for signs of cell–cell interactions between cytokine-expressing B cells with conventional (Tcon) and regulatory (Treg) populations using CellPhoneDB (single-cell RNA-seq datasetCitation21). Distinct B cell:T cell communication pathways were identified for TIL-B stratified by cytokine expression.Citation24 While cell–cell contact, and inhibitory checkpoint interactions with conventional T cells and Treg cells were detected for both TGF-β+ and TNF-α+ B cells, the underlying ligand-receptor pairs differed (). For TGF-β+ B cells with Tregs, the cell-cell contact was supported by CD47:SIRP-γ.Citation28 ICAM2:aLb2 interactions were shown for TNF-α+ B cells engaged with Tcon and with Treg populations.Citation29 In addition, TGF-β+ B cells expressed the immune checkpoint receptor Galectin-9,Citation30 which bound CD44 on Tregs, and CD47 on Tcon cells. Importantly, the interaction of Galectin-9 and CD44 was previously shown to promote FOXP3 expression and enhance the function and stability of induced Tregs (iTregs) in mouse models, alongside complex formation with TGF-β receptor I.Citation31 TGF-β+ B cells also expressed HLA-E, a non-classical HLA molecule, which is upregulated in stressed and senescent cells,Citation32,Citation33 and interacted with NKG2D expressed by Tcon cells.
As expected, TNF-α+ B cells engaged in signaling with T cells via pro-inflammatory mediators, including TNF-α, lymphotoxin-α (LT-α), and macrophage migration inhibitory factor (MIF). Our analysis indicated that TNF-α expressed by B cells interacted with TNFRII on both Treg and Tcon cells, and TNF-α also signaled via FasR and ICOS expressed by Tregs. In addition, TNF-α+ B cells expressed the costimulatory ICOS ligand, which interacted with its receptor ICOS expressed by Tregs, and in this context may promote the generation, proliferation, survival, and suppressive ability of Tregs.Citation34,Citation35 Lastly, TNF-α+ B cells expressed CD72, a negative checkpoint regulator of B cell responsiveness,Citation36 which interacted with CD100 expressed by both Tcon and Treg cells (). CellPhoneDB analyses also identified shared communication pathways, with common ligand-receptor pairs, which were present in B cell:T cell interactions involving either TGF-β+ or TNF-α+ B cells (. These shared interactions included molecules associated with lymphocyte homing, recruitment, and assembly (SELL, CXCL13, CCL4, and CD74), leukotriene synthesis (ALOX5), negative regulation of inflammation (GRN), and inhibition of B cell responses (CD22).
In summary, B cells in melanoma lesions are polarized to express regulatory cytokines, including TGF-β, and may engage in immunosuppressive crosstalk with tumor-associated T cells via Galectin-9 signaling. We found reduced tumor-resident TNF-α+ B cell populations compared to matched blood, and TNF-α+ TIL-B engaging in extensive crosstalk with Tregs, likely supporting immune cell suppressive activities in the TME.
Melanoma patient B cells support the proliferation of autologous T-helper cells and promote TGF-β-mediated differentiation of FOXP3+ Tregs ex vivo
Since we detected crosstalk between cytokine-expressing B cells with T cells including Tregs, we investigated the influence of melanoma patient-derived B cells on autologous T cell phenotype and effector function in ex vivo B and T-helper cell co-culture studies.
Consistent with our observation of reduced TNF-α+ inflammatory B cells in patient blood and tumors ( and Supplementary Figure 7(a-c)), circulating pro-inflammatory IFN-γ-expressing CD4+ T-helper cells were significantly lower in melanoma patients compared to HV ( in agreement with previous reports.Citation10 In autologous B-T cell 1:1 co-cultures, melanoma patient-derived B cells did not suppress either IFN-γ or TNF-α-expression by CD4+ T-helper cells (. In contrast, patient B cells significantly enhanced both the proliferation index and the percentage of proliferating T-helper cells (. This pro-proliferative effect was further enhanced by PD-1/PD-L1 checkpoint blockade, although only through increases in the percentage of proliferating T-helper cells, and not the proliferation index. Recombinant TNF-α did not significantly modulate T-helper cell proliferation, while, as expected, recombinant IL-10 was found to inhibit proliferationCitation37 ().
Figure 5. Patient-derived B cells did not suppress pro-inflammatory (IFN-γ and TNF-α) cytokine expression, and enhanced proliferation of autologous T-helper cells.
We examined melanoma patient-derived B cells in B:T-helper cell ex vivo co-cultures to evaluate whether these supported induction of FOXP3+ CD4+ regulatory T cells (Tregs). Initially, we observed a significantly increased percentage of FOXP3+ Tregs in melanoma patient compared to healthy volunteer peripheral blood, following anti-CD3/CD28 activation (). This suggested that a patient-specific subpopulation of T-helper cells may respond to activation by differentiating into a Treg phenotype. For the co-culture study, we purified populations of non-Treg (conventional) T cells by removing the CD25+ CD127− Treg subset, which are enriched in FOXP3 expression (. Ex vivo B:T cell co-cultures demonstrated that melanoma patient and healthy volunteer B cells significantly promoted FOXP3+ Treg differentiation from autologous purified CD25−/int CD127+ conventional T-helper cells ()). This suppressive effect was blocked when TGF-β1 was neutralized in cell cultures ( suggesting a link between TGF-β expression and induction of Tregs.
Figure 6. B cells derived from melanoma patient peripheral blood promote a FOXP3+ Treg phenotype from CD25−/int CD127+ conventional T cells.
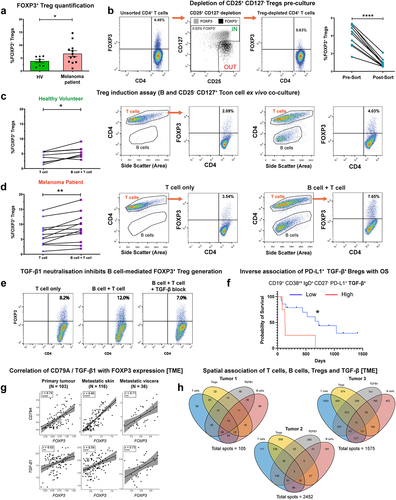
In concordance with regulatory properties of TGF-β+ Bregs, Kaplan–Meier survival analysis of our melanoma patient cohort indicated that higher levels of circulating TGF-β-expressing CD19+ CD38int IgD+ CD27− PD-L1+ naïve B cells were associated with less favorable overall survival (N = 18) (. Within the melanoma TME, we found a positive correlation between CD79A with FOXP3 and between TGF-β with FOXP3, gene expression (). Moreover, we found FOXP3 expression to be preferentially expressed among the tumor-infiltrating T cell population, alongside frequent co-expression with TIGIT (Supplementary Figure 8(a-e)), confirming FOXP3 as a robust marker for Treg detection in the TME. Finally, spatial transcriptomics analysis of human melanoma lesions confirmed the localized presence of T cells, Tregs, B cells, and TGF-β1 within melanoma tumor specimens obtained from N = 3 individuals ().
Together, these findings highlight that melanoma patient B cells support the proliferation of autologous T-helper cells and promote autologous Treg differentiation through the expression of TGF-β. Elevated circulating naïve TGF-β+ B cells may indicate unfavorable survival outcomes in patients with melanoma.
Discussion
The roles of B cells in cutaneous immune surveillance have received growing attention in recent years,Citation38 with research demonstrating that populations of mature, isotype-switched B cells reside in healthy skinCitation39 and that B cells may accumulate and proliferate in the skin in response to cutaneous antigenic challenge.Citation40 Evidence has also been gathered for skin tumor-resident mature B cell and antibody compartments in human melanoma, which may generally confer positive prognostic value.Citation41 Previous investigations have pointed to skewed isotype expression by B cells in melanoma, away from the prevalent IgG1, favoring B cells expressing regulatory isotypes such as IgG4 and IgA,Citation42,Citation43 which may suppress anti-tumor immune responses. It is also possible that cytokines including IL-4, IL-10, TGF-β, and VEGF, possibly combined with a corresponding reduction or impairment of pro-inflammatory cytokines such as IFN-γ, which would otherwise support isotype-switching to IgG1, may be part of the regulatory profile of a skewed humoral immune response in melanoma. In addition to tumor cellsCitation44 and T cells,Citation45 B cellsCitation46 may be a source of these cytokines and may also act in a paracrine manner to influence T cell phenotype and functions. However, despite evidence suggesting that cytokine-expressing B cell subsets can support immune modulation and tumor progression in murine models, via the secretion of IL-10,Citation9 the role of circulating and intratumoral cytokine-expressing B cells in patients with melanoma has received insufficient attention. We therefore sought to investigate the phenotype and functions of the cytokine-secreting B cell compartment, with focus upon unraveling regulatory B cell (including IL-10, TGF-β, and PD-L1-expressing subsets), and pro-inflammatory B cell (including IFN-γ and TNF-α-expressing subsets) profiles in human melanoma.
To provide a broad understanding of the potential dysregulation among cytokine-expressing B cells in patients with melanoma, we quantified regulatory and inflammatory B cell populations in cohorts of melanoma patients and matched healthy volunteers. We identified enhanced levels of regulatory B cells expressing either TGF-β or PD-L1 in melanoma patient compared to healthy volunteer peripheral blood. Consistently, a 34-marker CyTOF panel revealed enrichment in TGF-β+ CD19+ CD38int IgD+ CD27− PD-L1+ Bregs in patient compared to healthy volunteer circulation. We identified a concurrent collapse of the inflammatory B cell compartment, with significantly lower proportions of circulating IFN-γ+ and TNF-α+ inflammatory B cells in the patient compared to healthy volunteer circulation. Collectively, our analyses suggest an overall dysregulated cytokine-expressing B cell compartment in melanoma patient circulation, which appears to favor the induction of regulatory B cell (TGF-β+ and PD-L1+) subpopulations, alongside a collapse in pro-inflammatory (IFN-γ+ and TNF-α+) B cell subsets.
We also aimed to gain an insight into the cytokine-expressing cells categorized by B cell lineage subpopulations in the melanoma patient circulation, for which phenotypic descriptions of regulatory and inflammatory B cell subsets have not yet been determined. Our evaluations revealed that melanoma patient B cells expressing each of IL-10, TGF-β and TNF-α cytokines were present across B cell lineages, although with a marked preference toward a CD27+ memory phenotype, while TGF-β+ and PD-L1+ B cells were mostly found among non-isotype switched B cell subsets. To our knowledge, we provide the first report of the circulating memory B cell pool as an important source of both regulatory and pro-inflammatory cytokines in patients with melanoma. Future studies can explore the plasmablast and memory B cell pools as potential sources of cytokine-expressing cells.
Following our observations of systemic dysregulation among cytokine-expressing B cells in patients with melanoma, we sought to investigate cytokine expression profiles (regulatory IL-10 and TGF-β, and pro-inflammatory TNF-α) within the TIL-B compartment. In line with previous reports,Citation39,Citation47 we found enhanced B cell marker gene expression within melanoma lesions compared to normal skin. Our IHC/IF observations confirmed the presence of CD20+ TIL-B clusters, typically spatially associated alongside T cells, with significant cluster formation localized adjacent to melanoma tumor islets. The presence of B-T clusters in the tumor microenvironment has been reported in other cancer types,Citation48–50 may identify areas of localized lymphoid assembly, activation, and differentiation, and are often characterized as tertiary lymphoid structures. The presence of these structures has also been shown to associate with response to therapies.Citation51,Citation52 Our observation of B-T clustering was consistent with our finding of TIL-B:TIL-T crosstalk (CellPhoneDB analyses of scRNA-seq immune cell signatures) via molecules such as SELL, CXCL13, CCL4, CD74 known to be involved in lymphocyte recruitment and assembly.
We found lower proportions of TNF-α expressed B cells in patient tumors compared to patient peripheral blood (which were already lower than those found in the circulation of healthy volunteers) using intracellular cytokine phenotyping. However, TNF-α+ CD20+ TIL-B were evident in human melanoma lesions by IHC/IF cytokine co-staining, and their presence was confirmed in an independent melanoma tissue cohort by scRNA-seq analyses. Lower levels of circulating TNF-α+ expressing B cells in patients compared to HV, and TNF-α+ expressing B cells proportionally less highly represented in the B cell TME compartment compared to patient blood may denote a degree of regulation of the pro-inflammatory humoral immune compartment in melanoma. The contributions of known pro-inflammatory cytokines such as TNF-α to anti-tumor immunity remain controversial. For example, TNF-α expression has been shown to mediate tumor cell apoptosis and promote immune cell proliferation and survival.Citation53 In contrast, sustained inflammation is a hallmark of cancer,Citation54 and it is possible that the associated chronic exposure to TNF-α and its network of ligands and receptors, including activation of the NF-κB pathway,Citation55 can stimulate survival factors such as anti-apoptotic proteins.Citation56 The latter may explain the previously observed inverse correlation between proportions of circulating TNF-α+ inflammatory B cells and response to checkpoint blockade in a cohort of melanoma patients.Citation12
On the other hand, our data suggest that TGF-β-expressing Breg populations were prominent in patient blood, and both IHC/IF and scRNA-seq analyses in tumor lesions demonstrated the presence of a significant population of TGF-β+ B cells in the TME. Consistent with these cells likely supporting an immunosuppressive environment, ex vivo co-cultures of melanoma patient-derived B cells with autologous Tcon cells depleted of Tregs resulted in TGF-β-mediated induction of FOXP3+ Tregs. Although statistical significance was achieved for Treg induction by both healthy volunteer and melanoma patient B cells, the overall polarization of FOXP3+ Tregs following the co-cultures was most prominent within the melanoma patient cohort.
In the TME, TGF-β+ B:T cell spatial clustering and bidirectional communication by CellPhoneDB analyses pointed to modulatory signals evident from leukotriene synthesis (ALOX5),Citation57 negative regulation of inflammation (GRN, encoding for progranulin)Citation58 and inhibition of B cell responses (CD22).Citation59 TGF-β+ B cells expressed the immune checkpoint receptor Galectin-9,Citation30 which signaled with Tregs via CD44. Moreover, this interaction has been previously described to act synergistically with TGF-β signaling, to promote FOXP3 expression and to enhance the function and stability of induced Tregs.Citation31 Together, our findings point to TGF-β regulatory Breg populations as potential players in interacting with T cells via a range of regulatory signals and functionally supporting the generation of Tregs. These observations represent previously undescribed findings, as the significance of melanoma patient B cells in contributing to Treg generation ex vivo has not been investigated before. Future studies may further unravel the regulatory network involving TGF-β, FOXP3, and Galectin-9,Citation60 and aid our understanding of their synergistic significance in immune responses to solid tumors.
Our CellPhoneDB analyses also identified interactions between TNF-α+ TIL-B and Tregs, including via pro-inflammatory mediators TNF-α, LT-α, and MIF, and the ICOS/ICOSL axis, which may also drive the phenotypic stability and suppressive activity of Tregs.Citation34,Citation35,Citation61 Together with our observations of TGF-β+ B cell/Treg crosstalk, these analyses reveal previously unknown interactions between cytokine-expressing B cell subsets and Tregs. Collectively, these observations highlight multiple immunoregulatory interactions between TGF-β+ and TNF-α+ TIL-B, with T cells in the TME. TGF-β+ B cells have senescent properties and may support the differentiation and maintenance of Tregs in melanoma lesions through expression of Galectin-9, while TNF-α+ B cells may engage in extensive crosstalk with Tregs, including via ICOS, TNF-α, LT-α, and MIF signaling, which are likely to support the suppressive activity of Tregs in the melanoma TME. Further investigations elucidating these interactions, including the potential contributions of the B cell:Treg ICOS/ICOSL axis, may reveal previously unappreciated players in immune responses to solid tumors.
On the other hand, we observed that B cells, including those extracted from patients with melanoma, may exert a positive influence on T cells. Strikingly, we found that patient-derived B cells promoted the ex vivo proliferation of autologous T-helper cells, while allowing autologous T-helper cells to produce pro-inflammatory cytokines (IFN-γ and TNF-α). These observations suggest that, despite the observed declines in pro-inflammatory cytokine expression, circulating B cells in patients with melanoma maintain their immunostimulatory capacities ex vivo. Interestingly, anti-PD-1 treatment further enhanced B cell-associated proliferative signaling on T cells, suggesting that B cell functions and interactions with T cells may be influenced by checkpoint inhibitors.
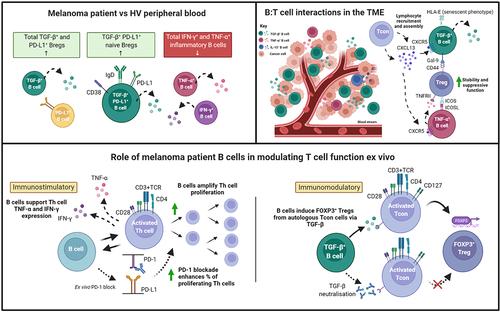
Together, our findings, illustrated in , highlight the wider dichotomy of immune responses which appears to also be reflected in the phenotypes and functions of cytokine-producing B cell compartments in melanoma. The overall contributions of B cells toward tumor surveillance may hinge upon a balance between immunostimulatory and immunomodulatory capabilities, to which their expressed cytokines may play a role. Further investigations into the factors influencing this balance are warranted, especially in large cohorts of patients across disease stages and treatment groups, and therapies that compel B cell responses toward pro-inflammatory and immunostimulatory responses may offer new options for treatment success in the clinic.
Figure 7. Cytokine-expressing B cells in melanoma are dysregulated in the circulation, engage in crosstalk with Tregs in the TME, and engender immunostimulatory and immunomodulatory influences ex vivo.
Supplemental Material
Download Zip (25 MB)Acknowledgments
We thank Dr Sara Lombardi (Oncology Haematology Clinical Trials, Guy’s and St Thomas’ NHS Foundation Trust, London, United Kingdom) in collecting and making available samples used in the generation of this publication. We also acknowledge the Biomedical Research Centre Immune Monitoring Core Facility team at Guy’s and St Thomas’ NHS Foundation Trust for assistance.
Disclosure statement
S. N. Karagiannis and J. Spicer are founders and shareholders of Epsilogen Ltd. All other authors have declared that no conflict of interest exists.
Data availability statement
The data that support the findings of this study are available from the corresponding author (S.N.K.) upon reasonable request. The data are not publicly available due to containing information that could compromise the privacy of research participants.
Supplementary material
Supplemental data for this article can be accessed online at https://doi.org/10.1080/2162402X.2022.2104426
Additional information
Funding
References
- Schumacher TN, Schreiber RD. Neoantigens in cancer immunotherapy. Sci (1979). 2015;348(6230):69–17. doi:10.1126/science.aaa4971.
- Karagiannis P, Correa I, Chauhan J, Cheung A, Dominguez-Rodriguez D, Terranova-Barberio M, Harris RJ, Crescioli S, Spicer J, Bokemeyer C, et al. Innate stimulation of B cells ex vivo enhances antibody secretion and identifies tumour-reactive antibodies from cancer patients. Clin Exp Immunol. 2022;207(1):84–94. doi:10.1093/cei/uxab005.
- Gilbert AE, Karagiannis P, Dodev T, Koers A, Lacy K, Josephs DH, Takhar P, Geh JLC, Healy C, Harries M, et al. Monitoring the systemic human memory B cell compartment of melanoma patients for anti-tumor IgG antibodies. PLOS ONE. 2011;6(4):e19330. doi:10.1371/journal.pone.0019330.
- Correa I, Ilieva KM, Crescioli S, Lombardi S, Figini M, Cheung A, Spicer JF, Tutt ANJ, Nestle FO, Karagiannis P, et al. Evaluation of antigen-conjugated fluorescent beads to identify antigen-specific B cells. Front Immunol. 2018;9:493. doi:10.3389/fimmu.2018.00493.
- Hardy-Werbin M, Arpí O, Taus A, Rocha P, Joseph-Pietras D, Nolan L, Danson S, Griffiths R, Lopez-Botet M, Rovira A, et al. Assessment of neuronal autoantibodies in patients with small cell lung cancer treated with chemotherapy with or without ipilimumab. OncoImmunol. 2018;7(2):e1395125. doi:10.1080/2162402X.2017.1395125.
- Duddy M, Niino M, Adatia F, Hebert S, Freedman M, Atkins H, Kim HJ, and Bar-Or A. Distinct effector cytokine profiles of memory and naive human B cell subsets and implication in multiple sclerosis. J Immunol. 2007;178(10):6092–6099. doi:10.4049/jimmunol.178.10.6092.
- Blair PA, Noreña LY, Flores-Borja F, Rawlings DJ, Isenberg DA, Ehrenstein MR, Mauri C. CD19+CD24hiCD38hi B cells exhibit regulatory capacity in healthy individuals but are functionally impaired in systemic lupus erythematosus patients. Immunity. 2010;32(1):129–140. doi:10.1016/j.immuni.2009.11.009.
- Flores-Borja F, Bosma A, Ng D, Reddy V, Ehrenstein MR, Isenberg DA, Mauri C. CD19+CD24hiCD38hi B cells maintain regulatory T cells while limiting TH1 and TH17 differentiation. Sci Transl Med. 2013;5(173):173ra23. doi:10.1126/scitranslmed.3005407.
- Inoue S, Leitner WW, Golding B, Scott D. Inhibitory effects of B cells on antitumor immunity. Cancer Res. 2006;66(15):7741–7747. doi:10.1158/0008-5472.CAN-05-3766.
- Wu H, Xia L, Jia D, Zou H, Jin G, Qian W, Xu H, Li T. PD-L1+ regulatory B cells act as a T cell suppressor in a PD-L1-dependent manner in melanoma patients with bone metastasis. Mol Immunol. 2020;119:83–91. doi:10.1016/j.molimm.2020.01.008.
- van de Veen W, Globinska A, Jansen K, Straumann A, Kubo T, Verschoor D, Wirz OF, Castro-Giner F, Tan G, Rückert B, et al. A novel proangiogenic B cell subset is increased in cancer and chronic inflammation. Sci Adv. 2021;6(20):eaaz3559. doi:10.1126/sciadv.aaz3559.
- de Jonge K, Tillé L, Lourenco J, Hajjami H M-E, Nassiri S, Racle J, Gfeller D, Delorenzi M, Verdeil G, Baumgaertner P, et al. Inflammatory B cells correlate with failure to checkpoint blockade in melanoma patients. OncoImmunol. 2021;10(1):1873585. doi:10.1080/2162402X.2021.1873585.
- Flores-Borja F, and Blair P. Mechanisms of induction of regulatory B cells in the tumour microenvironment and their contribution to immunosuppression and pro-tumour responses. Clin Exp Immunol. 2022;209(1):33–45. doi:10.1093/cei/uxac029.
- Gheybi MK, Farrokhi S, Ravanbod MR, Ostovar A, Mehrzad V, Nematollahi P. The correlation of CD19 + CD24 + CD38 + B cells and other clinicopathological variables with the proportion of circulating tregs in breast cancer patients. Breast Cancer. 2017;24(6):756–764. doi:10.1007/s12282-017-0775-y.
- Guan H, Lan Y, Wan Y, Wang Q, Wang C, Xu L, Chen Y, Liu W, Zhang X, Li Y, et al. PD-L1 mediated the differentiation of tumor-infiltrating CD19+ B lymphocytes and T cells in invasive breast cancer. OncoImmunol. 2016;5(2):e1075112. doi:10.1080/2162402X.2015.1075112.
- Wang WW, Yuan XL, Chen H, Xie GH, Ma YH, Zheng YX, Zhou YL, Shen LS. CD19+CD24hiCD38hiBregs involved in downregulate helper T cells and upregulate regulatory T cells in gastric cancer. Oncotarget. 2015;6(32):33486–33499. doi:10.18632/oncotarget.5588.
- Murakami Y, Saito H, Shimizu S, Kono Y, Shishido Y, Miyatani K, Matsunaga T, Fukumoto Y, Ashida K, Sakabe T, et al. Increased regulatory B cells are involved in immune evasion in patients with gastric cancer. Sci Rep. 2019;9(1):13083. doi:10.1038/s41598-019-49581-4.
- Lechner A, Schlößer HA, Thelen M, Wennhold K, Rothschild SI, Gilles R, Quaas A, Siefer OG, Huebbers CU, Cukuroglu E, et al. Tumor-associated B cells and humoral immune response in head and neck squamous cell carcinoma. OncoImmunol. 2019;8(3):1535293. doi:10.1080/2162402X.2018.1535293.
- Garaud S, Gu-Trantien C, Lodewyckx J-N, Boisson A, De Silva P, Buisseret L, Migliori E, Libin M, Naveaux C, Duvillier H, et al. A simple and rapid protocol to non-enzymatically dissociate fresh human tissues for the analysis of infiltrating lymphocytes. JoVE. 2014;94:e52392. doi:10.3791/52392.
- Becht E, McInnes L, Healy J, Dutertre C-A, Kwok IWH, Ng LG, Ginhoux F, Newell EW. Dimensionality reduction for visualizing single-cell data using UMAP. Nat Biotechnol. 2019;37(1):38–44. doi:10.1038/nbt.4314.
- Li H, van der Leun AM, Yofe I, Lubling Y, Gelbard-Solodkin D, van Akkooi ACJ, van den Braber M, Rozeman EA, Haanen JBAG, Blank CU, et al. Dysfunctional CD8 T cells form a proliferative, dynamically regulated compartment within human melanoma. Cell. 2019;176(4):775–789.e18. doi:10.1016/j.cell.2018.11.043.
- Hao Y, Hao S, Andersen-Nissen E, Mauck WM, Zheng S, Butler A, Lee MJ, Wilk AJ, Darby C, Zager M, et al. Integrated analysis of multimodal single-cell data. Cell. 2021;184(13):3573–3587.e29. doi:10.1016/j.cell.2021.04.048.
- McGinnis CS, Murrow LM, Gartner ZJ. DoubletFinder: doublet detection in single-cell RNA sequencing data using artificial nearest neighbors. Cell Syst. 2019;8(4):329–337.e4. doi:10.1016/j.cels.2019.03.003.
- Efremova M, Vento-Tormo M, Teichmann SA, Vento-Tormo R. CellPhoneDB: inferring cell–cell communication from combined expression of multi-subunit ligand–receptor complexes. Nat Protoc. 2020;15(4):1484–1506. doi:10.1038/s41596-020-0292-x.
- Watson IR, Wu C-J, Zou L, Gershenwald JE, Chin L. Abstract 2972: genomic classification of cutaneous melanoma. Cancer Res. 2015;75(15 Supplement):2972. doi:10.1158/1538-7445.AM2015-2972.
- Chandrashekar DS, Bashel B, Balasubramanya SAH, Creighton CJ, Ponce-Rodriguez I, Bvsk C, Varambally S. UALCAN: a portal for facilitating tumor subgroup gene expression and survival analyses. Neoplasia. 2017;19(8):649–658. doi:10.1016/j.neo.2017.05.002.
- Yin Z, Siegert S, Neure L, Grolms M, Liu L, Eggens U, Radbruch A, Braun J, Sieper J. The elevated ratio of interferon gamma-/ interleukin-4-positive T cells found in synovial fluid and synovial membrane of rheumatoid arthritis patients can be changed by interleukin-4 but not by interleukin-10 or transforming growth factor beta. Rheumatology. 1999;38(11):1058–1067. doi:10.1093/rheumatology/38.11.1058.
- Dehmani S, Nerrière-Daguin V, Néel M, Elain-Duret N, Heslan J-M, Belarif L, Mary C, Thepenier V, Biteau K, and Poirier N, et al. SIRPγ-CD47 interaction positively regulates the activation of human T cells in situation of chronic stimulation. Front Immunol. 2021 Dec 1;12:732530. doi:10.3389/fimmu.2021.732530.
- Garçon F, Okkenhaug K. PI3Kδ promotes CD4+ T-cell interactions with antigen-presenting cells by increasing LFA-1 binding to ICAM-1. Immunol Cell Biol. 2016;94(5):486–495. doi:10.1038/icb.2016.1.
- Shen H, Wu N, Nanayakkara G, Fu H, Yang Q, Yang WY, Li A, Sun Y, Drummer Iv C, Johnson C, et al. Co-signaling receptors regulate T-cell plasticity and immune tolerance. Front Biosci (Landmark Ed). 2019;24(1):96–132. doi:10.2741/4710.
- Wu C, Thalhamer T, Franca RF, Xiao S, Wang C, Hotta C, Zhu C, Hirashima M, Anderson AC, Kuchroo VK. Galectin-9-CD44 interaction enhances stability and function of adaptive regulatory T cells. Immunity. 2014;41(2):270–282. doi:10.1016/j.immuni.2014.06.011.
- Pereira BI, Devine OP, Vukmanovic-Stejic M, Chambers ES, Subramanian P, Patel N, Virasami A, Sebire NJ, Kinsler V, Valdovinos A, et al. Senescent cells evade immune clearance via HLA-E-mediated NK and CD8+ T cell inhibition. Nat Commun. 2019;10(1):2387. doi:10.1038/s41467-019-10335-5.
- Kale A, Sharma A, Stolzing A, Desprez P-Y, Campisi J. Role of immune cells in the removal of deleterious senescent cells. Immun Ageing. 2020;17(1):16. doi:10.1186/s12979-020-00187-9.
- Chen Y, Shen S, Gorentla BK, Gao J, Zhong X-P. Murine regulatory T cells contain hyperproliferative and death-prone subsets with differential ICOS expression. J Immunol. 2012;188(4):1698. doi:10.4049/jimmunol.1102448.
- Landuyt AE, Klocke BJ, Colvin TB, Schoeb TR, Maynard CL. Cutting edge: ICOS-deficient regulatory T cells display normal induction of Il10 but readily downregulate expression of Foxp3. J Immunol. 2019;202(4):1039. doi:10.4049/jimmunol.1801266.
- Correa-Rocha R, Lopez-Abente J, Gutierrez C, Pérez-Fernández VA, Prieto-Sánchez A, Moreno-Guillen S, M-á M-F, Pion M, Speck RF. CD72/CD100 and PD-1/PD-L1 markers are increased on T and B cells in HIV-1+ viremic individuals, and CD72/CD100 axis is correlated with T-cell exhaustion. PLOS ONE. 2018;13(8):e0203419. doi:10.1371/journal.pone.0203419.
- Taga K, and Tosato G. IL-10 inhibits human T cell proliferation and IL-2 production. J Immunol. 1992;148(4):1143–1148.
- Egbuniwe IU, Karagiannis SN, Nestle FO, Lacy KE. Revisiting the role of B cells in skin immune surveillance. Trends Immunol. 2015;36(2):102–111. doi:10.1016/j.it.2014.12.006.
- Saul L, Ilieva KM, Bax HJ, Karagiannis P, Correa I, Rodriguez-Hernandez I, Josephs DH, Tosi I, Egbuniwe IU, Lombardi S, et al. IgG subclass switching and clonal expansion in cutaneous melanoma and normal skin. Sci Rep. 2016;6(1):29736. doi:10.1038/srep29736.
- Egbuniwe IU, Harris RJ, Nakamura M, Nestle FO, Akbar AN, Karagiannis SN, and Lacy KE. B lymphocytes accumulate and proliferate in human skin at sites of cutaneous antigen challenge. J Invest Dermatol. 2022 ;142(3 Pt A):726–731.e4. doi:10.1016/j.jid.2021.06.038.
- Chiaruttini G, Mele S, Opzoomer J, Crescioli S, Ilieva KM, Lacy KE, Karagiannis SN. B cells and the humoral response in melanoma: the overlooked players of the tumor microenvironment. OncoImmunol. 2017;6(4):e1294296. doi:10.1080/2162402X.2017.1294296.
- Karagiannis P, Gilbert AE, Josephs DH, Ali N, Dodev T, Saul L, Correa I, Roberts L, Beddowes E, Koers A, et al. IgG4 subclass antibodies impair antitumor immunity in melanoma. J Clin Invest. 2013;123(4):1457–1474. doi:10.1172/JCI65579.
- Karagiannis P, Villanova F, Josephs DH, Correa I, van Hemelrijck M, Hobbs C, Saul L, Egbuniwe IU, Tosi I, Ilieva KM, et al. Elevated IgG4 in patient circulation is associated with the risk of disease progression in melanoma. OncoImmunol. 2015;4(11):e1032492. doi:10.1080/2162402X.2015.1032492.
- Wu P, Geng B, Chen Q, Zhao E, Liu J, Sun C, Zha C, Shao Y, You B, Zhang W, et al. Tumor cell–derived TGFβ1 attenuates antitumor immune activity of T cells via regulation of PD-1 mRNA. Cancer Immunol Res. 2020;8(12):1470–1484. doi:10.1158/2326-6066.CIR-20-0113.
- Mei-Ling C, PM J, Leonid G, FR A, Ralph W, Harald von B, Khashayarsha K. Regulatory T cells suppress tumor-specific CD8 T cell cytotoxicity through TGF-β signals in vivo. Proc Natl Acad Sci. 2005;102(2):419–424. doi:10.1073/pnas.0408197102.
- Bjarnadóttir K, Benkhoucha M, Merkler D, Weber MS, Payne NL, Bernard CCA, Molnarfi N, Lalive PH. B cell-derived transforming growth factor-β1 expression limits the induction phase of autoimmune neuroinflammation. Sci Rep. 2016;6(1):34594. doi:10.1038/srep34594.
- Ladányi A, Kiss J, Mohos A, Somlai B, Liszkay G, Gilde K, Fejős Z, Gaudi I, Dobos J, Tímár J. Prognostic impact of B-cell density in cutaneous melanoma. Cancer Immunol Immunother. 2011;60(12):1729–1738. doi:10.1007/s00262-011-1071-x.
- Harris RJ, Cheung A, Ng FCF, Laddach R, Chenoweth AM, Crescioli S, Fittall M, Dominguez-Rodriguez D, Roberts J, Levi D, et al. Tumor-Infiltrating B lymphocyte Profiling Identifies IgG-biased, clonally expanded prognostic phenotypes in triple-negative breast cancer. Cancer Res. 2021;81(16):4290–4304. doi:10.1158/0008-5472.CAN-20-3773.
- Mungenast F, Meshcheryakova A, Beer A, Salzmann M, Tamandl D, Gruenberger T, Pietschmann P, Koperek O, Birner P, Kirsch I, et al. The immune phenotype of isolated lymphoid structures in non-tumorous colon mucosa encrypts the information on pathobiology of metastatic colorectal cancer. Cancers (Basel). 2020;12(11):3117. doi:10.3390/cancers12113117.
- Delvecchio FR, Fincham REA, Spear S, Clear A, Roy-Luzarraga M, Balkwill FR, Gribben JG, Bombardieri M, Hodivala-Dilke K, Capasso M, et al. Pancreatic cancer chemotherapy is potentiated by induction of tertiary lymphoid structures in mice. Cell Mol Gastroenterol Hepatol. 2021;12(5):1543–1565. doi:10.1016/j.jcmgh.2021.06.023.
- Hollern DP, Xu N, Thennavan A, Glodowski C, Garcia-Recio S, Mott KR, He X, Garay JP, Carey-Ewend K, Marron D, et al. B cells and T follicular helper cells mediate response to checkpoint inhibitors in high mutation burden mouse models of breast cancer. Cell. 2019;179(5):1191–1206.e21. doi:10.1016/j.cell.2019.10.028.
- Willsmore ZN, Harris RJ, Crescioli S, Hussein K, Kakkassery H, Thapa D, Cheung A, Chauhan J, Bax HJ, and Chenoweth A, et al. B cells in patients with melanoma: implications for treatment with checkpoint inhibitor antibodies. Front Immunol. 2021;11:622442. doi:10.3389/fimmu.2020.622442.
- Mercogliano MF, Bruni S, Mauro F, Elizalde PV, Schillaci R. Harnessing tumor necrosis factor alpha to achieve effective cancer immunotherapy. Cancers (Basel). 2021;13(3):564. doi:10.3390/cancers13030564.
- Hanahan D, Weinberg RA. Hallmarks of cancer: the next generation. Cell. 2011;144(5):646–674. doi:10.1016/j.cell.2011.02.013.
- Hsu H, Xiong J, Goeddel DV. The TNF receptor 1-associated protein TRADD signals cell death and NF-κB activation. Cell. 1995;81(4):495–504. doi:10.1016/0092-8674(95)90070-5.
- Pikarsky E, Porat RM, Stein I, Abramovitch R, Amit S, Kasem S, Gutkovich-Pyest E, Urieli-Shoval S, Galun E, Ben-Neriah Y. NF-κB functions as a tumour promoter in inflammation-associated cancer. Nature. 2004;431(7007):461–466. doi:10.1038/nature02924.
- Hofheinz K, Kakularam KR, Adel S, Anton M, Polymarasetty A, Reddanna P, Kuhn H, Horn T. Conversion of pro-inflammatory murine Alox5 into an anti-inflammatory 15S-lipoxygenating enzyme by multiple mutations of sequence determinants. Arch Biochem Biophys. 2013;530(1):40–47. doi:10.1016/j.abb.2012.11.015.
- Yoo W, Lee J, Noh KH, Lee S, Jung D, Kabir MH, Park D, Lee C, Kwon K-S, Kim J-S, et al. Progranulin attenuates liver fibrosis by downregulating the inflammatory response. Cell Death Dis. 2019;10(10):758. doi:10.1038/s41419-019-1994-2.
- Aruffo A, Kanner SB, Sgroi D, Ledbetter JA, and Stamenkovic I. CD22-mediated stimulation of T cells regulates T-cell receptor/CD3-induced signaling. Proc Natl Acad Sci. 1992;89(21):10242–10246. doi:10.1073/pnas.89.21.10242.
- Lv K, Zhang Y, Zhang M, Zhong M, Suo Q. Galectin-9 promotes TGF-β1-dependent induction of regulatory T cells via the TGF-β/Smad signaling pathway. Mol Med Rep. 2013;7(1):205–210. doi:10.3892/mmr.2012.1125.
- Okubo Y, Mera T, Wang L, and Faustman DL. Homogeneous expansion of human T-regulatory cells via tumor necrosis factor receptor 2. Sci Rep. 2013;3(1):3153. doi:10.1038/srep03153.