
ABSTRACT
Our previous study showed that one of the schweinfurthin compounds, 5’-methoxyschweinfurthin G (MeSG), not only enhances the anti-tumor effect of anti-PD1 antibody in the B16F10 murine melanoma model, but also provokes durable, protective anti-tumor immunity. Here we further investigated the mechanisms by which MeSG treatment induces immunogenic cell death (ICD). MeSG induced significant cell surface calreticulin (CRT) exposure in a time and concentration dependent manner as well as increased phagocytosis of tumor cells by dendritic cells in vitro. Interestingly, this CRT exposure differs from the canonical pathway in several aspects. MeSG does not cause ER stress and does not require PERK to induce CRT exposure. Caspase inhibitors partially rescue cells from MeSG-induced apoptosis, but fail to reduce CRT exposure. MeSG does not cause ERp57 exposure and the absence of ERp57 expression does not reduce CRT exposure. Finally, an intact ER to Golgi transport system is required for this phenomenon. These results lend support to the development of the schweinfurthin family as drugs to enhance clinical response to immunotherapy and highlight the need for additional research on the mechanisms of ICD induction.
Introduction
Novel targeted immuno-therapeutics to treat cancer is an exciting strategy that has now become an intense area of research. In the last decade the clinical deployment of immune checkpoint inhibitor therapies has revolutionized the field of cancer treatment.Citation1,Citation2 These treatments while dramatically changing the standard of care for several cancers leading to durable complete responses, only show this profound activity in a fraction of patients. This intriguing pattern of response and the potential for immune related side effects that can be life threatening have added an urgency to explore combination strategies.Citation1 Numerous targeted therapies have recently been tested in combination with immune checkpoint inhibitors,Citation3 and have shown promise in some cancers.Citation4 Responses to PD-1/PD-L1 blockade are dependent on characteristics of tumor cells and the host immune system. One strategy to improve the PD-1/PD-L1 blockade is to combine it with other therapies which either improve tumor cells’ immunogenicity or enhance host anti-tumor immunity. The therapies that alter tumor cells’ immunogenicity include radiotherapy,Citation5 chemotherapy,Citation6 oncolytic virus infection,Citation7 and other molecular targeted therapy.Citation8 Therapies that enhance host immunity include other immune-checkpoint blockades,Citation9 agonists for immune cell activation,Citation10 and cancer vaccines.Citation11
Small molecule therapies are discovered in two general ways: either they are designed to hit a specific known target, or they are discovered through a phenotypic assay designed to find compounds which have growth inhibition or other desirable anti-cancer effects. This later approach, a phenotypic development strategy, is successful at identifying first-in-class small molecule drugs bringing a high degree of innovation to cancer therapy benefiting thousands of patients.Citation12 An example of a phenotypic screen which can indicate novel mechanistic insights for drug discovery is the National Cancer Institute (NCI)-60 cell assay.Citation13–15 One such group of compounds, the schweinfurthins, were discovered at the NCI using this screen.Citation16 We have an ongoing program aimed at developing a schweinfurthin analog as an anticancer therapeutic.Citation17
The schweinfurthins were discovered in an African plant (Macaranga schweinfurthii) and then evaluated by Dr. John Beutler at the NCI developmental therapeutics program.Citation16 Since then, several additional compounds have been isolated from this and other species of the genus Macaranga.Citation18–21 Some of these compounds show interesting potent (nanomolar) activity against cancers from the brain and renal panels of the 60 cell screen, while showing 1000 fold less activity against ovarian and some lung cancers.Citation22 The pattern of activity is novel and is not correlated to any currently approved chemotherapy agents, and only a few other diverse compounds show a correlated pattern.Citation22 Because these compounds were difficult to isolate from nature, a total synthesis effort was undertaken by us which has resulted in the synthesis of around 100 active analogs considerably expanding the structure activity understanding of the chemo type.Citation23–26 These compounds have been used by our group and others in studies attempting to discover their cellular target.
Mechanistic insights into the schweinfurthins have demonstrated binding to oxysterol binding proteins,Citation27 which reduce Akt signaling and lead to disruption of the Golgi architecture.Citation28 Our group has shown that schweinfurthins decreased intracellular cholesterol levels via decreasing cholesterol uptake, increasing cholesterol efflux, and downregulating the mevalonate pathway, which contributes to cholesterol synthesis.Citation29 This leads to synergy with cholesterol lowering drugs including statins. Additionally, in SF-295 human glioma cells the ER stress type response is engaged eventually resulting in eukaryotic initiation factor-2α (eIF2α) phosphorylation and apoptosis via caspase 9 activity.Citation29
Very recently, we discovered that in immunocompetent mice with a murine melanoma tumor model, co-treatment with schweinfurthin analogs and anti-PD-1 antibody (αPD-1) led to durable tumor immunity and cured about 33% of treated animals.Citation30 In this study we tested schweinfurthin analogs TTI-4242 and 5’-methoxyschweinfurthin G (MeSG). MeSG was chosen for this study based on earlier data showing the compound was active at reducing chondrosarcoma tumor growth in a mouse model at a dose of 20 mg/kgCitation31 and TTI-4242 is a more stable analog. Interestingly, treatment of B16F10 tumors in immunocompromised mice with MeSG did not show any effect, indicating that the initial tumor response was due to the immune response elicited by the MeSG treatment. In addition, rechallenge of the cured mice with this tumor cell line did not lead to tumor growth indicating the durability of the immune response. These results demonstrate that the schweinfurthins are dependent on an intact immune system to exert their anticancer effects. These agents may affect the immune system and/or the tumor cells, to induce the sustained curative result. Thus there is a great need to understand the schweinfurthin’s mechanism(s) of action. Our previous resultsCitation30 suggested that induction of immunogenic tumor cell death (ICD) may drive the major effects of schweinfurthins on tumors.
One of the key concepts to improve immunotherapy is to boost the immunogenicity of tumors. The induction of ICD is widely recognized to confer immunogenicity to tumor cells by releasing danger-associated molecular patterns (DAMPs).Citation32 DAMPs activate the host immune system and eventually cause the destruction of cancer cells. Cell surface exposure of calreticulin (CRT) is a major determinative DAMP.Citation33 Cell surface CRT behaves as an “eat me” signal to trigger cancer cell phagocytosis by dendritic cells (DCs), subsequent tumor antigen presentation and eventual tumor-specific T cell immunity.Citation34,Citation35
The ICD response has been studied in the context of several different chemotherapeutics including anthracyclines and hypericin photodynamic therapy as well as radiotherapy.Citation36,Citation37 For each of these approaches the mechanism is slightly different but the general features of cell surface CRT expression followed by ATP release are similar.Citation38 The ICD caused by some chemotherapy agents and radiotherapy is dependent upon canonical CRT exposure pathway. It has been reported that the CRT exposure pathway is composed of three sequential modules:Citation39 ER stress, apoptotic and translocation modules (see ). Blocking of each module by using various inhibitors or gene knockdown approaches blocks CRT exposure and reverses tumor cell immunogenicity. This general model of CRT exposure has been found to be conserved from single cell fungi to mammalsCitation40 and is likely somehow involved in mating and cellular connection formation.Citation41–43
Figure 1. Brief summary of canonical calreticulin (CRT) exposure pathway.
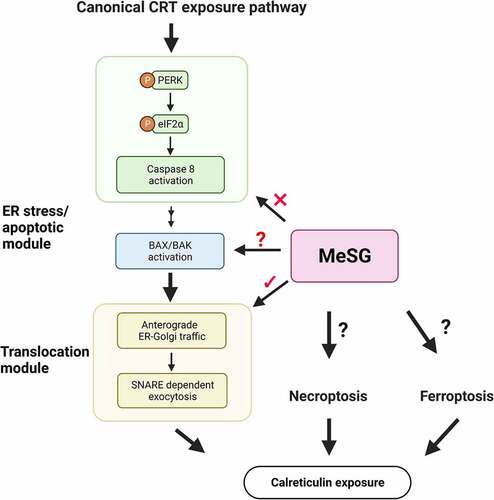
The phosphorylation of eIF2α is considered to be the hallmark of ER stress and potentially ICD.Citation37,Citation44,Citation45 Phosphorylated eIF2α globally downregulates gene translation with the effect of restoring cell homeostasis. Traditional ICD inducers are dependent upon protein kinase R (PKR)-like endoplasmic reticulum kinase (PERK) to cause eIF2α phosphorylation, which is required for CRT exposure.Citation39 Subsequently, in the apoptotic module, caspase 8 is activated which leads to Bap31 cleavage and Bax/Bak activation.Citation39 In the final translocation module, CRT is anterogradely transported from the ER lumen to the Golgi apparatus, and then to the cell surface.Citation39 Because we and others have noted that ER stress and trans-Golgi disruption are the result of schweinfurthin treatment we hypothesize that schweinfurthins fall into the first class which directly effects the ER.
Because schweinfurthin compounds effectively enhanced the activity of αPD-1 therapy in the B16F10 melanoma model but only in the presence of an intact immune system, we tested whether these agents were potentially acting by inducing characteristics of ICD. In our prior work 30 nM MeSG robustly induced surface CRT expression after 24 hours of treatment.Citation30 Furthermore this was followed at 36 hours by extracellular release of ATP in a dose dependent manner with maximum effects apparent at 15 nM MeSG.Citation30 Interestingly, the concentration of MeSG needed to achieve anti-proliferative effects in this cell line was 1 µM which is 33 and 66 fold higher than the doses where ICD effects were observed.Citation30
Herein, we report on the function and mechanisms of MeSG in inducing ICD in vitro. We found that MeSG increases tumor cells phagocytosis by dendritic cells and rapidly induces CRT exposure. However, MeSG induces CRT exposure independent from the initial and the second steps of the canonical pathway ().Citation39 The inhibition of ER stress or PERK fails to block the surface CRT induced by MeSG. The inhibition of caspase 8 rescues cells from apoptosis induced by MeSG but doesn’t inhibit CRT exposure. This finding suggests that MeSG induces CRT exposure via a novel pathway not reliant on the induction of eIF2α phosphorylation or apoptosis activation.
Results
MeSG induces CRT exposure in murine B16F10 and human UACC903 melanoma cell lines
We previously demonstrated that schweinfurthins increase cell surface calreticulin (CRT) expression in B16F10 murine melanoma cells in a concentration-dependent manner. Maximal CRT exposure was induced by 24 hours of treatment with 100 nM MeSG in B16F10 cells. Based on the dose-response curve we determined that the EC50 (concentration for 50% of maximal effect) of CRT exposure by MeSG is 30nM.Citation35 We extended this study to more precisely evaluate the concentration- and time-dependence of cell surface CRT levels in B16F10 and UACC903 cell lines. The expression of cell surface CRT was evaluated by both flow cytometry and imaging-cytometry (ImageStream) techniques.
Histograms of surface CRT on B16F10 cells treated with 30 and 100 nM MeSG for 3, 12, and 24 hours, or with 10,000 rads irradiation as a positive control are shown in .Citation46 These data were quantified as fold-change in . Both 30 and 100 nM MeSG increased cell surface CRT as compared to vehicle control. Interestingly, 100 nM MeSG increased surface CRT at 12 hours and to even higher levels at 24 hours. To verify the increase of CRT expression at the cell surface, we used Imagestream to quantify the distribution of CRT on individual cell’s surface (). With 30 nM MeSG for 24 hours, calreticulin was detected as green fluorescent puncta on the cell surface. However, with 100 nM MeSG for only 12 hours, cells already showed continuous green fluorescence (FITC-CRT) puncta on their surface. A longer exposure of 24 hours with 100 nM MeSG produced a more dramatic effect as the green fluorescence (FITC-CRT) uniformly stains the whole cell surface, indicating a large increase in cell surface CRT levels. Similarly, we tested the ability of MeSG to induce CRT exposure in human melanoma cell line UACC903. Different from B16F10, UACC903 cells express clinically relevant PTEN and BRAF mutations.Citation47,Citation48 The cells were treated with increasing concentrations of MeSG (0.8 nM-100 nM, 2-fold dilutions). The CRT intensity histograms show that CRT exposure was detected as low as 6.25 nM with stronger effects when MeSG concentrations increased (). Quantification curves demonstrated that MeSG treatment induced CRT exposure with concentration and time-dependence. Both curves show a similar EC50 around 6.5 nM while 24 hour treatment induced maximal 18-fold increase of CRT exposure, peaking higher than the 13-fold increase observed at 12 hours ().
Figure 2. MeSG treatment enhances exposure of calreticulin (CRT) in murine and human melanoma cell line.
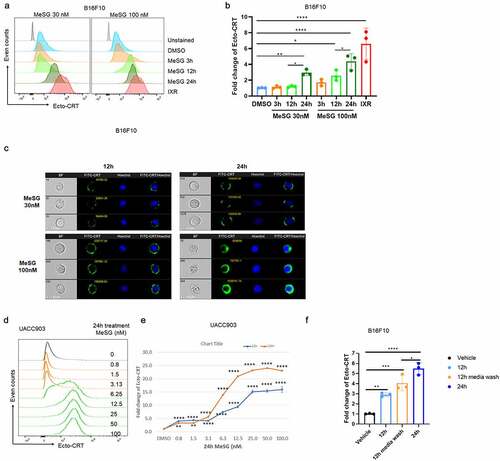
To understand if the MeSG-induced increased cell surface CRT levels are reversible, B16F10 cells were treated with 30 nM MeSG for 12 hours, and then rinsed and cultured in fresh media without MeSG for an additional 12 hours. Quantification of surface CRT on B16F10 cells treated with 30 nM MeSG for 12 or 24 hours, or for 12 hours followed by media wash are shown in . Surface CRT increased by 12 hours of MeSG treatment with an even greater increase by 24 hours of treatment compared to vehicle control. The treatment of cells by 12 hours MeSG followed by media wash and an additional 12 hours incubation with media alone resulted in an elevated surface CRT that is intermediate to a level seen with 12- and 24-hours incubation with MeSG. It shows that the 12 hours 30 nM MeSG treatment continues to increase surface CRT even after MeSG was removed from the media, however, it did not increase surface CRT to the same level as 24 hours treatment. These data suggest that the MeSG’s effect is not reversible.
MeSG increases phagocytosis of B16F10 cells by bone marrow derived dendritic cells
To determine the extent to which MeSG treatment impacts phagocytosis of tumor cells, bone marrow-derived dendritic cell (BMDC) phagocytosis of fluorescently-labeled B16F10 tumor cells was measured as outlined in . BMDCs were primarily composed of cells with a classical DC phenotype (co-expressing CD11c and CD11b) and were predominantly immature as assessed by low expression of both MHCII and CD86 (Supplement-1). B16F10 tumor cells were stained with CellTracker Green and then treated with DMSO, 100 nM MeSG or 2.5 µM doxorubicin (DOX) for 24 hours. DOX is a known inducer of ICD. CellTracker Green-stained B16F10 tumor cells were cocultured with BMDCs for 5 hours, followed by staining with APC-conjugated anti-CD11c antibody to detect BMDCs. Imaging flow cytometry was utilized to identify the proportion of cells representing CD11c+ DCs that had phagocytosed fluorescently-labeled tumor cells.
Figure 3. MeSG enhances phagocytosis of B16F10 by murine BMDCs.
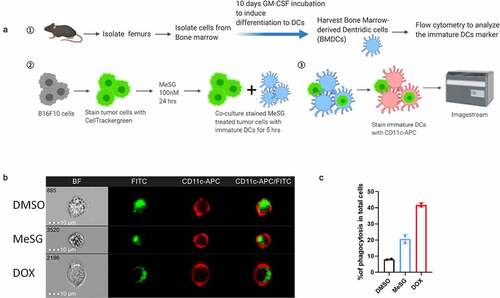
Representative images collected by ImageStream analysis are shown in to demonstrate examples of DCs that have acquired an internal green fluorescence, indicative of phagocytosis. A detailed gating strategy is shown in Supplement-2. The presence of single cells expressing both surface CD11c and CellTracker Green is confirmed by the accompanying brightfield images (). The frequency of phagocytic events was defined as the percentage of cells with an internalization score higher than 0 ( C). Compared to DMSO, MeSG and DOX treatment increased the frequency of phagocytosis 2 and 4-fold respectively. Thus, MeSG treatment increases the susceptibility of B16F10 cells to phagocytosis by DCs.
MeSG does not induce exposure of CD47 or ERp57
Tumor cell phagocytosis occurs when cells express more “Eat me” than “Don’t eat me” signals on their surface. Tumor cell surface CD47 expression is a common “Don’t eat me” signal.Citation49 When CD47 binds to phagocyte SIRPα receptor, the “Don’t eat me” signal is activated, which inhibits phagocytosis of tumor cells. To understand if MeSG increases phagocytosis of tumor cells not just by increasing CRT exposure but also by decreasing the “Don’t eat me” signal, the cell surface CD47 expression on B16F10 cells was measured after 24 hours 100 nM MeSG treatment (). MeSG treatment did not alter surface CD47 expression, supporting the hypothesis that surface CRT expression induced by MESG increases B16F10 phagocytosis.
Figure 4. MeSG treatment doesn’t induce exposure of CD47 and ERp57 on surface of B16F10 and UACC903 cells.
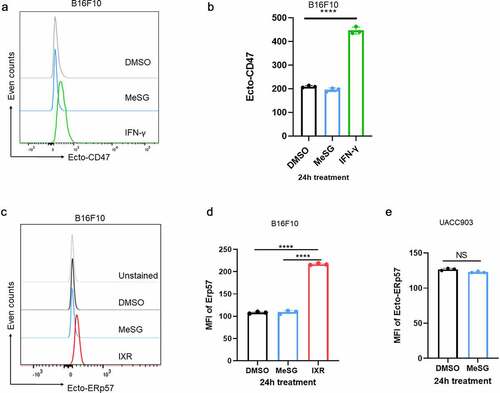
Many studies show that CRT requires its binding partner ERp57 to translocate to the cell surface.Citation50 ERp57, also known as Protein Disulfide-Isomerase A3 (PDIA3), is an ER-resident protein, which, with calreticulin and calnexin, modulates the folding of newly synthesized glycoproteins.Citation51 In anthracycline-treated CT26 colon cancer cells, ERp57 forms a complex with CRT and translocates to the cell surface to trigger cancer cell phagocytosis. Furthermore, cells with low ERp57 fail to expose CRT and do not elicit an anti-tumor response.Citation50 To understand if MeSG induces CRT translocation to the cell surface as a complex with ERp57, we measured the surface ERp57 expression in cells treated with MeSG or DMSO as well as irradiation (IXR) as a positive control. Unexpectedly, MeSG did not alter ERp57 cell surface levels in B16F10 cells, although IXR did increase cell surface ERp57 (). We also found that in UACC903, MeSG did not cause ERp57 exposure (). This finding suggests that MeSG induces CRT exposure independent of ERp57 exposure, suggesting MeSG utilizes a yet unknown pathway that differs from the one used by anthracyclines and IXR.
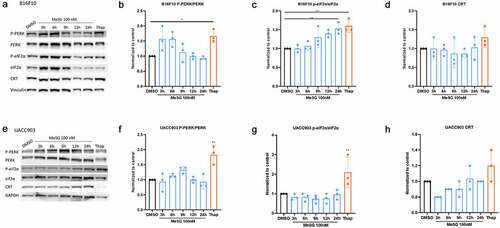
MeSG does not trigger eIF2α or PERK phosphorylation before CRT exposure
The CRT exposure pathway begins with ER stress generated by ICD inducers such as mitoxantrones (MTX) and irradiation. This leads to the activation of kinases that phosphorylate eIF2α, an ER stress marker whose phosphorylation is highly correlated with CRT exposure. To determine if MeSG triggers ER stress, B16F10 cells were treated with100nM MeSG for 3, 6, 9, 12, 24 hours, or with ER stress inducer thapsigargin (Thap). Protein was extracted for western blotting to test the activation of the ER stress pathway. MeSG did not significantly effect PERK phosphorylation at these time points (). However, Thap did cause PERK phosphorylation in B16F10 cells. MeSG induced eIF2α phosphorylation at 24 hours (). Total CRT expression levels were not changed (). 30 nM MeSG treatment (EC50 for CRT exposure in B16F10) showed that PERK phosphorylation was increased at 3 hours (Supplement 3A, B). In UACC903 cells, 100 nM MeSG treatment didn’t cause either eIF2α or PERK phosphorylation (). However, thapsigargin did increase PERK and eIF2α phosphorylation to 1–2 fold. 6.5 nM MeSG treatments (EC50 for CRT exposure in UACC903) also shown similar results (Supplement-3E, F, G). In addition, intracellular eIF2α phosphorylation levels were measured by flow cytometry. In B16F10 cells, 100 nM MeSG induced significant eIF2α phosphorylation at 24 hours, however, the same condition didn’t cause eIF2α phosphorylation in UACC903 (Supplement 4), consistent with western blot analysis.
Figure 5. The effects of MeSG on ER stress related-proteins and PERK phosphorylation.
PERK inactivator increases CRT exposure by MeSG
To further determine the role of ER stress in inducing CRT exposure by MeSG, we pre-treated B16F10 cells with increasing concentrations of ER stress inhibitor tauroursodeoxycholatic acid (TUDCA) 2 hours (0.5, 1, 1.5 mM) prior to 24 hours MeSG. TUDCA is a natural bile acid that blocks the activation of ER-stress mediators.Citation52 Histograms of surface CRT level on B16F10 cells after this treatment are shown in . The surface CRT on cells treated with vehicle for 24 hours is represented in not-tinted blue and TUDCA treatment alone are represented in non-tinted green histograms; cell treated with 30 nM MeSG is represented in tinted blue histogram. The cells that are pre-treated with TUDCA then treated with 30 nM MeSG for 24 hours are represented in tinted green histograms. The shades of the green histograms increase to indicate the increased TUDCA concentration.
Figure 6. The relationship of MeSG-induced CRT exposure to ER stress and PERK phosphorylation.
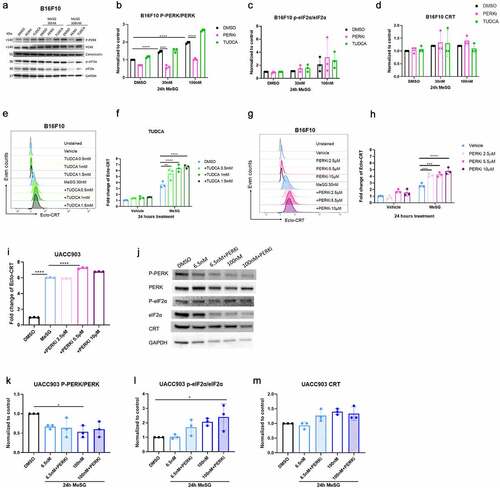
TUDCA alone had no significant effect on surface CRT, while MeSG increased surface CRT (). Interestingly, the adding of 2 hour TUDCA pre-treatment caused a further increase in surface CRT compared to MeSG treatment alone. This result implies that the inhibition of ER stress achieved by TUDCA pre-treatment cannot block CRT exposure by MeSG.
To determine the role of PERK phosphorylation in CRT exposure by MeSG, we pretreated B16F10 cells with increasing concentrations of PERK kinase activity inhibitor GSK2606414 (PERKi)Citation53 prior to 24 hours of PERKi and MeSG combination treatment. Histograms of surface CRT intensity on cells after this treatment are shown in . The surface CRT on cells treated with only 2 hours PERKi pre-treatment (2.5, 5.5, 10 µM) are represented in gradient shades of non-tinted pink histograms; cell treated with 30 nM MeSG is represented in tinted blue histogram. The cells that are pre-treated with PERKi then treated with MeSG and PERKi for 24 hours are represented in tinted pink histograms. Similar to what we observed in TUDCA pre-treated cells, combination of PERKi pre-treatment and MeSG/PERKi treatment increased surface CRT compared to MeSG treatment alone. Quantification of these results () demonstrates that PERKi pre-treatment leads to a significant increase of CRT exposure compared to MeSG treatment alone. Similarly, the PERKi pre-treatment in UACCC903 showed that 5.5 µM PERKi increased CRT exposure to a greater level compared to MeSG alone at 6.5 nM (). These results indicate that PERK inhibition achieved by PERKi cannot block CRT exposure induced by MeSG.
To confirm that PERKi did inhibit PERK phosphorylation, we also detected PERK phosphorylation by Western blotting (). B16F10 cells were pre-treated with either PERKi (5.5 μM) or TUDCA (0.5 mM) for 2 hours and then treated with either 30 or 100 nM MeSG for additional 24 hours. MeSG caused PERK phosphorylation at 30 nM (Lane 4) compared to vehicle (Lane 1) and an even greater phosphorylation by 100 nM treatment (Lane 7). PERKi treatment (Lane 5, 8) reduced the intensity of phospho-PERK band compared to MeSG treatment (Lane 4, 7). Quantification of blots in shows that PERKi pre-treatment reduced almost half of PERK phosphorylation by MeSG. Therefore, even though PERKi efficiently inhibits MeSG-induced PERK phosphorylation, it cannot block the CRT exposure induced by MeSG.
We also pretreated UACC903 with 5.5 μM PERKi for 2 hours prior to 24 hours of 6.5 nM or 100 nM MeSG/5.5 μM PERKi treatment. WB results show that PERKi didn’t change PERK phosphorylation, but it increased eIF2α phosphorylation compared to 100 nM MeSG alone. Therefore, MeSG induced surface CRT exposure is independent of ER stress and PERK activation.
PERK is not required for the mechanism of CRT exposure by MeSG
To further validate that PERK is not involved in the CRT exposure by MeSG, we performed PERK knockdown via PERK siRNA. B16F10 cell were transfected with PERK siRNA or scramble RNA for 48 hours via lipofectamine 3000, then treated with either 100 nM MeSG or vehicle control DMSO for 24 hours. Western blotting confirmed the knockdown of PERK (). However, MeSG increased eIF2α phosphorylation in PERK KD cells (). ImageStream analysis showed that the intensity of surface CRT (in green) on PERK knockdown cells was similar to WT or scRNA transfected tumor cells (). Quantification of surface CRT intensity confirmed that MeSG still induced CRT exposure in the absence of PERK ().
Figure 7. PERK and ERp57 knockdown to explore their role in MeSG induced CRT exposure.
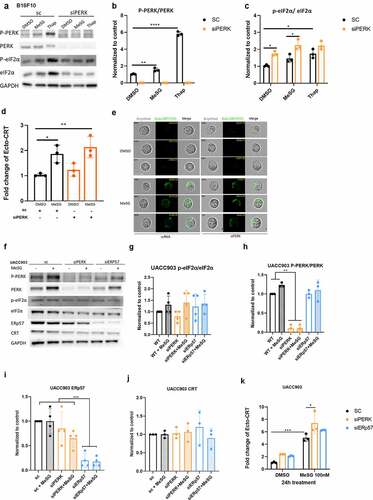
In UACC903 cells, the PERK knockdown reduced more than 80% of total PERK expression and almost completely ablated PERK phosphorylation () Similar to MeSG treatment in control cells, MeSG caused a slight eIF2α phosphorylation in PERK KD cells but did not change total CRT expression level (). However, again, we see that PERK KD cell exposed to MeSG induced an even higher CRT exposure than MeSG alone ().
As mentioned before, () MeSG does not induce ERp57 exposure. To further explore if ERp57 is required for MeSG induced CRT exposure, we knocked down total ERp57 expression by siERp57 ( lane 5,6, K). We observed that the absence of ERp57 did not reduce CRT surface exposure induced by MeSG (). This result, together with the PERKi pre-treatment experiment demonstrate that MeSG induces CRT exposure in a PERK and ERp57-independent pathway.
Caspase inhibitors rescue cells from apoptosis caused by MeSG without impacting CRT exposure
The second module of the canonical CRT exposure pathway is defined as the apoptotic module. This module involves the activation of caspase 8 and BAX/BAK. Therefore, we investigated if MeSG induces apoptosis in both B16F10 and UACC903 cells. Fluorescent conjugates of annexin V are widely used to identify apoptotic cells because of its high affinity for phospholipid phosphatidylserine (PS).Citation54 In normal healthy cells, PS is located on the inner leaflet of the plasma membrane. However, during apoptosis, PS translocate from the inner to the outer leaflet of the plasma membrane. Therefore, Annexin-V staining cells are considered apoptotic. 7-Aminoactinomycin D (7-AAD)Citation55 is a fluorescent chemical compound with strong affinity for DNA, but it cannot readily pass through intact cell membranes. Hence, cells with compromised membranes (dead cells) will stain with 7-AAD. Generally, Annexin-V (-)/7-AAD (-) cells are considered live cells, Annexin-V (+)/7-AAD (-) cells are at early apoptosis, and Annexin-V (+)/7-AAD (+) cells are at late apoptosis.
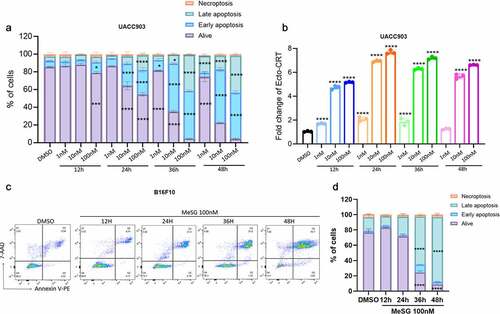
UACC903 cells were treated with 1, 10, or 100 nM MeSG for 12, 24, 36 and 48 hours, or with DMSO alone for 24 hours. Cells were then stained with PE-conjugated Annexin-V and 7-AAD to measure apoptosis. Simultaneously, surface CRT was also measured. For MeSG treated cells, we compared the percentage of cells in four apoptosis stages to DMSO treated cells. We found that MeSG induces apoptosis in a concentration and time-dependent manner. The earliest significant apoptosis was induced by 12 hours with 100 nM treatment as shown by the significant smaller live cell population (purple) and larger early apoptosis cell population (blue) (). At 24 hours, apoptosis was detected in both 10 nM and 100 nM treatments. After 36 hours, even 1 nM MeSG induced apoptosis and both 10 and 100 nM treatments caused more than half of cells to undergo apoptosis. Interestingly, with the same sample, we found that as low as 1 nM MeSG at 12-hour treatment already induced significant CRT exposure compared to control (). This evidence strongly argued that UACC903 is more sensitive to the CRT exposure ability of MeSG than inducing apoptosis. In addition, maximum CRT exposure (8-fold) was achieved with 100 nM MeSG treatment at 24 hours. After that, higher concentrations and longer exposure to MeSG treatment had no further effect. In B16F10 cells, over half of the cells progressed to late apoptosis by 36 hours of 100 nM MeSG treatment ().
Figure 8. MeSG induce apoptosis in UACC903 cells before CRT exposure.
To understand if induction of apoptosis is required for CRT-exposure caused by MeSG, we utilized pan-caspase inhibitor Z-VAD-FMKCitation56 and caspase 8 specific inhibitor Z-IETD-FMK.Citation57
We cotreated UACC903 cells with 6.5 or 100 nM MeSG and with Z-IETD-FMK (20 μM) or Z-VAD-FMK (25 μM) for 24 hours. 6.5 nM MeSG was sufficient to induce apoptosis and 100 nM MeSG led to increased apoptosis (). For 6.5 nM treatment, neither Z-VAD nor Z-IETD rescued the cells from apoptosis. For 100 nM treatment, both Z-IETD-FMK and Z-VAD-FMK rescued cells from apoptosis as the live cell population was significantly increased. (Increased from 71% to 76% by Z-IETD-FMK, increased from 71% to 78% by Z-VAD-FMK) and decreased the early apoptosis population (). Due to the low amount of apoptosis at the early time point it is difficult to tell if these changes are truly biologically significant. Interestingly, for the same sample we found that Z-VAD-FMK and 100 nM MeSG treatment increased CRT exposure above MeSG alone, and Z-IETD-FMK showed a similar trend (). These results indicate that at this early 24 hour time point the cellular commitment to surface CRT exposure is not dependent on caspase 8 activation.
Figure 9. Inhibition of caspase activation can rescue cells from apoptosis induced by MeSG but can not inhibit CRT exposure.
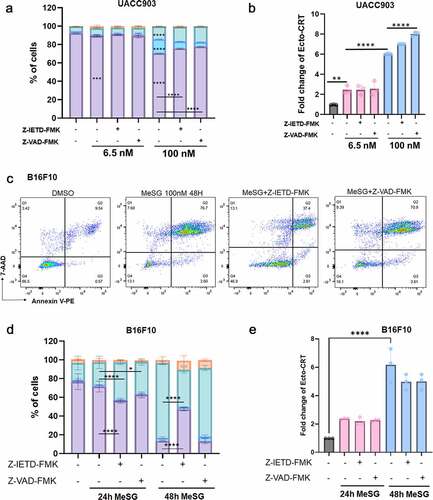
In addition, we co-treated B16F10 cells with 100 nM MeSG and Z-VAD-FMK or Z-IETD-FMK for 24 or 48 hours. At 24 hour treatment in this cell line there was a decrease in live cells with both caspase inhibitors. At 48 hours treatment, 100 nM MeSG caused the majority of cells to progress to late apoptosis. Z-IETD-FMK significantly rescued cells from apoptosis as shown by 40% less cells at late apoptosis. Z-VAD-IETD only slightly rescued cells (). In this cell line as in the UACC903 cell line there was little change in the surface CRT exposure ().
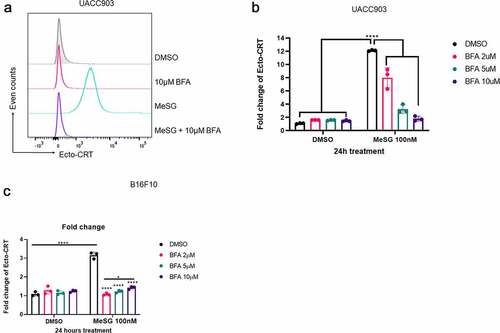
Translocation module is involved in CRT exposure by MeSG
The last module on the canonical CRT exposure pathway is the translocation module. CRT first anterograde traffics from ER to Golgi, then presents on the cell surface through SNARE dependent exocytosis. To understand if this module is required for the CRT exposed induced by MeSG, we utilized Brefeldin A (BFA). Brefeldin A is a reversible inhibitor of protein translocation from ER to the Golgi apparatus. It inhibits binding of the cytosolic coat protein to Golgi membranes.Citation58UACC903 were pre-treated with 2, 5 or 10 μM BFA for 2 hours then treated with 100 nM MeSG alone for 24 hours. BFA inhibited CRT exposure in a concentration-dependent manner: 2 μM BFA reduced 4-fold, 5 μM BFA reduced 8-fold CRT exposure and 10 μM BFA completely blocked CRT exposure (). B16F10 cells were similarly treated. Two hours pretreatment of 2,5,10 μM BFA-pretreatment completely blocked MeSG-induced CRT exposure (). These findings indicate that the source of cell surface CRT before MeSG treatment is the ER and the translocation module is required for CRT exposure.
Figure 10. Induction of calreticulin exposure by MeSG can be blocked by Brefeldin A pre-treatment.
Discussion
We speculated that ICD is the reason why MeSG could enhance the efficacy of anti-PD1 in a murine melanoma model. Since surface CRT, which is efficiently induced by MeSG, can serve as an “eat me” signal, we performed a phagocytosis assay. We found that MeSG treatment increased tumor cell phagocytosis by BMDCs. This outcome could be the result of DAMP signals, or a reduction in cell surface “don’t eat me” signals on the cancer cells. To rule out the reduction of “don’t’ eat me” signaling we measured the surface level of “don’t eat me” signal CD-47 and found that MeSG does not alter surface levels of this protein. This finding suggests CRT exposure is important for enhanced tumor cell phagocytosis after MeSG treatment. In both murine B16F10 and human UACC903 cell lines, we found MeSG induces CRT exposure in a time and concentration dependent manner. When compared to B16F10 cells, UACC903 cells are more sensitive to the induction of CRT exposure upon MeSG treatment. Indeed, treatment with only 1 nM of MeSG for 24 hours induced significant CRT exposure in UACC903 cells. Also notable was the magnitude of the CRT exposure response in UACC903 cells, MeSG induces an 18-fold increase compared to vehicle. This motivated us to explore the molecular mechanism of CRT exposure by MeSG.
Our studies point to a further expansion of the mechanism compared with earlier findings in melanoma cells. In B16F10 cells, adding a PERK inhibitor successfully reduced PERK phosphorylation induced by MeSG. To our surprise this treatment actually increased CRT exposure in a dose dependent manner on co-treatment with MeSG. Further, PERK knockdown with siRNA in both B16F10 and UACC903 cell lines indicated that PERK is not required for MeSG to induce CRT exposure. This result led us to test if there is an increased eIF2α phosphorylation in these cell lines upon MeSG treatment. While in the B16F10 cell line we saw some eIF2α phosphorylation at 24 hours this was well after the CRT exposure was elicited at 12 hours leading us to the conclusion it is not required to initiate CRT exposure. We did not detect either eIF2α or PERK phosphorylation by MeSG in UACC903 under any conditions. This difference in the murine and human cell lines was confirmed by flow cytometry. This result leads us to the conclusion that ER-stress modulated by eIF2α phosphorylation is not required for the CRT translocation seen in these cells and that it is likely that the eIF2α phosphorylation noted at 24 hours in B16.F10 cells is the result of the process that is initiated by the drug treatment after CRT exposure has reached maximal response. In addition, we found that co-treatment with the ER-stress inhibitor TUDCA was unable to reduce the CRT exposure induced by MeSG, suggesting that the ER-stress response is not required to induce CRT exposure.
Numerous previous studies implicated an ER-stress response to CRT exposure and eIF2α phosphorylation is the marker of ER stress that most correlated with CRT exposure.Citation39,Citation59 Indeed, disrupting eIF2α phosphatase (PP1/GADD34) can also lead to CRT exposure under some circumstances indicating that simply increasing the phosphorylation of eIF2α could be enough to trigger ICD.Citation60 eIF2α phosphorylation in CRT exposure was initially thought to be regulated solely by the eIF2α kinase, PERK, and its activation by phosphorylation. More recently, Paola Giglio et al reported that mitoxantrone (MTX) and doxorubicin (DOXO) induce eIF2α phosphorylation leading to CRT exposure in melanoma cell lines, but do not up-regulate other ER stress markers TRB3, Xbp1 or CHOP indicating ER-stress is not absolutely required for this effect. In addition PERK-phosphorylation was not required for eIF2α phosphorylation.Citation61 On the contrary, they found that other eIF2α kinases, PKR (protein kinase RNA-activated) and to a lesser extent GCN2 (general control nonderepressible 2), are required for MTX/DOXO mediated eIF2α phosphorylation in melanoma cells. In addition to this result, another group found that eIF2α phosphorylation driven by the kinase (EIF2AK1 also known as Heme Responsive Inhibitor, HRI) is a strong inducer of ICD and CRT translocation to the surface after radaporfin photodynamic therapy.Citation62 This appears to be driven by ER and Golgi apparatus perturbations induced by oxidative stress leading to eventual mitochondrial induced cell death by the machinery of the intrinsic apoptosis pathway.Citation62
It has been previously reported that a second ER resident protein disulfide isomerase ERp57 (also known as PDIA3) is expressed on the cell surface with CRT.Citation50,Citation63 In 2019 it was further demonstrated in Jurkat cells that ERp57 and integrin coordinate the extra-ER expression of CRT including the cell surface expression in the context of ICD.Citation64 These authors knocked out both ERp57 and CRT and demonstrated that CRT exposure in ICD is dependent on ERp57, but ERp57 surface exposure is not dependent on CRT.Citation65 We tested whether treatment with MeSG induced increased surface exposure of ERp57 and found that it did not. We also identified that knockdown of ERp57 in UACC903 cell line didn’t reduce CRT exposure by MeSG. This result further suggests that MeSG is not reliant on the same mechanisms for CRT exposure as other ICD inducing agents.
We show that MeSG can induce significant apoptosis in both cell lines tested but that human UACC903 cells are more susceptible than murine B16F10 cells. In the canonical model of ICD induced CRT surface exposure caspase-8 activation followed by Bap31 cleavage and downstream activation of BAX/BAK are essential for CRT exposure.Citation39 We use caspase 8-specific inhibitor Z-IETD-FMK and pan-caspase inhibitor Z-VAD-FMK to understand if caspase 8 is required for CRT exposure by MeSG. Interestingly, both Z-IETD-FMK and Z-VAD-FMK rescue UACC903 cells from apoptosis, however, they do not suppress CRT exposure in MeSG treated cells. Similarly to the human cell line, Z-IETD-FMK significantly rescued B16F10 cells from apoptosis induced by 48 hours 100 nM MeSG treatment but did not significantly reduce CRT surface exposure. Interestingly, the pan caspase inhibitor does not effect the apoptosis in this murine cell line. This could signal that the ultimate fate of this cell line is not a traditional apoptosis. Indeed Z-VAD-FMK has been shown to sensitize cells to necroptosis and so at this late stage it is possible that these two mechanisms are both at play leading to a failure of rescue with this pan-caspase inhibitor.Citation66
The totality of this data suggests that MeSG induces apoptosis/necroptosis and CRT exposure via different mechanisms, and that at least the second step of the canonical ICD pathway is not required for CRT exposure. Recently, AD Garg et al reported that hypericin-based PDT (Hyp-PDT) requires PERK, BAX/BAK for CRT exposure, but caspase-8 activation and eIF2α phosphorylation are not induced.Citation67 An anticancer peptide RT53Citation68 also induces CRT exposure in a caspase and eIF2α-independent pathway.Citation69 RT53 does not induce eIF2α phosphorylation and it induced CRT aggregation which cannot be suppressed by Z-VAD-FMK. It is speculated that RT53 causes ICD via some form of necrosis.Citation69 Interestingly, the necrosis generated by RT53 was not blocked by necrostatin-1 an inhibitor of receptor-interacting protein kinase (RIPK) 1-mediated necroptosis,Citation70 nor by cyclosporine A which blocks necrosis mediated by mitochondrial disruption.Citation71 This finding indicates that the necrosis caused by RT53 doesn’t fit either of these common ICD pathways Thus it appears from our study that MeSG may be more related to these alternative forms of ICD than that caused by the canonical inducers such as radiation or anthracyclines.
As noted above in canonical ICD mechanisms ERp57 is translocated to the cell surface with CRT, however we did not see this with MeSG treatment. To further define the penultimate events of CRT surface exposure we tested if the anterograde transport from the Golgi is still required as has been shown with traditional ICD inducers. We do find that the inhibition of ER-Golgi trafficking by BFA completely blocks CRT exposure. This suggest that the translocation module is involved in CRT exposure by MeSG and in this regard the MeSG is utilizing the same pathway as other compounds such as anthracyclines.
Our results point to a potential novel mechanism of CRT surface exposure with schweinfurthin treatment. Our earlier results demonstrated CRT exposure with two compounds of this class, TTI-4242 and MeSG (TTI-3114), indicating that this is likely a class effect. The precise mechanism of action of this class of compound has yet to be described, however, numerous lines of evidence point to the involvement of lipid signaling systems such as oxysterol binding proteinsCitation27,Citation72,Citation73 and Golgi trafficking disruptions,Citation28 as well as cholesterol associated signaling more broadly.Citation17,Citation74 These results point to a possible divergence between the mechanisms of cell death or apoptosis induced by the schweinfurthins and the induction of CRT. Indeed we can see robust CRT exposure with 30 nM treatment of B16F10 cells that require 1 μM MeSG treatment for 48 hours to induce growth inhibition.
Because immune therapies like anti-PD-1 monoclonal antibodies show such promise but also such variable effects and potential for autoimmune adverse events, we believe that this novel mechanism of ICD induction can be exploited for clinical use. Much recent work has shown the involvement of additional forms of cell death such as necroptosisCitation75 and ferroptosisCitation76 in ICD (see ) and these could be implicated in some of our observations such as the failure of pan-caspase inhibition to block what we perceived as apoptosis in our studies. We are currently exploring further the roles of apoptotic proteins such as Bax/Bak, additional kinases which may signal through alternative mechanisms such as PKR and GCN2,Citation61 as well as mechanisms underpinning other forms of cell death in these effects.Ultimately it will be important to determine the direct targets which engage the induction of ICD with this class of drugs while moving them toward clinical translation.
Material and methods
Reagents and antibodies
PERK inhibitor I (GSK2606414), tauroursodeoxycholic acid (TUDCA) were purchased from Sigma-Aldrich (St. Louis, MO, USA). Anti- Phospho-PERK (Thr980) # MA5-15033, Flow Calreticulin Polyclonal Antibody # PA3-900 were purchased from ThermoFisher Scientific. Anti-total PERK (#3192), anti-total eIF2α (#9722), anti-phospho-eIF2α (Ser51) #3398, anti-total Calreticulin (#12238), anti-Vinculin (#13901), and HRP-linked Anti-rabbit IgG Antibody(#7074S) were obtained from Cell Signaling Technology (Beverly, MA, USA). Anti-ERp57 (ab13506), Anti-GAPDH (ab9485) were obtained from Abcam (Cambridge, MA, USA). Goat anti-rabbit AlexaFluor 488-conjugated secondary antibody were purchased from Life Technologies.(cat#:2251171 Life Technologies). Lipofectamine 3000® was used for all transfections (Invitrogen).
Cell line and culture conditions
For all experiments, melanoma B16F10 cell line (American Type Culture Collection, Manassas, VA, USA) and UACC-903 cell line were cultured in RPMI-1640 (Gibco, Life Technologies, NY, USA) supplemented with 10%fetal bovine serum (FBS. GE Healthcare Life Sciences, Logan, Utah), incubated in a humidified environment at 37°C and 5% CO2. B16F10 cell line was obtained from American Type Culture Collection (ATCC CRL 6457). UACC903 cells were obtained from the NCI-Frederick Cancer DCTD Tumor/Cell line Repository and was generously donated by Dr.Jeffrey Trent. Cells were collected using trypsin/EDTA (ethylene diamine- tetra-acetic acid) 0.25% phenol red (Gibco, Life Technologies, NY, USA).
RNA interference:
Human PERK (sc-36213), human ERp57 (sc-35341), Mouse PERK (sc-36214) siRNA, and non-targeting scramble siRNA oligo ribonucleotides were purchased from Santacruze (Dallas, TX). 0.4–1 × 10⁶ cells/well were seeded in 60 mm dishes and incubated for overnight, then transfected with indicated siRNA (100–300 pmol) by lipofactamine3000 (Invitrogen) approach as recommended by the supplier. After 24–48 hours transfection. Cells were treated with the indicated agents for 24 hours and then harvested for flow cytometry or Western blotting assay. Western blotting was used to assess protein down-regulation as described below.
Western blot
Cells lysates protein concentration was measured by the Micro BCA™ protein assay (Thermo Scientific, Chelmsford,MA, USA) and electrophoresed in NuPAGE 4–12% Bis-Tris Gel gels, transferred to polyvinylidene fluoride membranes. Using standard techniques, and immunoblotted with the corresponding primary and HRP-conjugated secondary antibodies. Blots were blocked with gelatin for an hour then incubated with indicated primary antibodies in 5% TBS-T overnight at 4°C. Primary antibodies were: anti-eIF2α (1:1000), P-eIF2α (1:1000), vinculin (1:2000); anti -PERK (1:1000), anti-P-PERK (1:1000), anti-CRT (1:1000). Detection was achieved using horseradish peroxidase-conjugate secondary antibody (anti-mouse 1:1000; anti-rabbit 1:3000). Membrane-bound immune complexes were visualized using Amersham Hyperfilm ECL (GE Healthcare Chicago, IL) in a Chemi-Doc imaging system (Bio-Rad). Densitometry of each protein normalized to vinculin or GAPDH was calculated using the Bio-Rad Image-Lab software.
Flow cytometry
Ecto-calreticulin, cell surface ERp57 and CD47 evaluation
B16F10, UACC903 wild-type or gene knockdown cells were seeded at 1–1.5 × 10⁵ cells per well in 12-well plates and cultured in 10% FBS supplemented RPMI-1640 medium overnight. Then the cells were treated with indicated conditions when they reached 70–80% confluency. Cells were harvested by a mixture of Versene solution with 15% of 0.25% EDTA-trypsin, then washed twice in FACS buffer (2%FBS+ 0.1% NaNs in PBS), then transferred to 96-well round-bottom plates at 1–2 x 10^5 cell per well. Cells were stained with anti-calreticulin antibody (1:1000; Abcam, ab2970) in FACS buffer for 30 minutes at 4°C followed by two washes. Cells were stained with goat anti-rabbit AlexaFluor 488-conjugated secondary antibody (cat#:2251171 Life Technologies) in FACS buffer for 30 minutes at 4°C. After two washes, the cells were labeled with 7-AAD to exclude the dead cells. Cell viability after different treatments is shown in supplement- 5. A total of 2 × 10⁵ fluorescent cells were acquired using the BD FACSCanto10™ (Becton-Dickinson) flow cytometer. Data were analyzed with FlowJo software (v. 10.8). For cell surface ERp57 evaluation, after indicted treatment the cells were harvested as described before and washed twice by FACS buffer. The cells were stained with anti-ERp57 antibody (Abcam, ab13506) at 1:1000 dilution for 30 minutes at 4°C, followed by two washes. Then the cells were labeled with goat anti-rabbit AlexaFluor 488-conjugated secondary antibody for 30 minutes at 4°C. After two washes, the cells were analyzed by BD FACSCanto10™ flow cytometer. For cell surface CD47 evaluation, after indicated treatment, the cells were harvested as described before and washed twice with FACS buffer. Then the cells were transferred to round-bottom 96-well plate and stained with FITC-conjugated anti-CD47 monoclonal antibody (Thermo Fisher, # 11–0479-42) at 5ul/sample for 30 minutes at 4°C. The the cells were washed twice with FACS buffer and analyzed by flow cytometry.
Intracellular p-eIF2α detection
The detection of intracellular phosphorylated protein is modified from.Citation77 After the indicated treatment, cells were trypsinized and washed twice in PBS, then fixed in 4% PFA at 4°C for 30 min, and then permeabilized in ice-cold 80% MeOH for 10 min. The samples were washed twice in FACS buffer (PBS + 2% FBS) and then incubated with the primary rabbit anti-p-eIF2α (CST, #3398S) at 1:100 dilution in FACS buffer at 4°C for 45 min. Samples were washed twice in FACS buffer and incubated in the secondary goat anti-rabbit Alexa 488 antibody (Invitrogen, A11070) at 1:200 dilution in FACS buffer at 4°C for 45 min. Samples were washed once in FACS buffer and kept in FACS buffer + 2% PFA at 4°C until analysis with a FACSCanto10 (BD Biosciences).
Analysis of surface CRTl:
The sample preparation for ImagStream analysis is the same as described for flow cytometry. After the incubation of anti-rabbit AlexaFluor 488-conjugated secondary antibody, the cell samples were washed and incubated with Hoechst33342 at 1:4000 dilution for 15 minutes. After washing, the cells were resuspended in 100 µl PBS and run on ImageStreamX MKII. ImageStream data were analyzed with AMNIS IDEAS Software. To measure the intensity of surface CRT, we generated a new “mask” on IDEAS to identify the regions of interest. We first generated the Dilate mask for CRT-FITC staining. Then we used the ErodeMask and eroded 6 pixels to generate the cytosol mask. Eventually, membrane masks were generated using Dilate Mask on the CRT-FITC staining and subtracting the cytosol mask using Boolean Logic. (Supplement-6).
Apoptosis measurement
Generally, 1–1.5 × 10⁵ cells treated as indicated were harvested as described before were washed twice in FACS buffer (2%FBS+ 0.1% NaNs in PBS). Then cells were transferred to Eppendorf tubes in 100 µl Annexin V binding buffer per tube and stained with 5 µl PE Annexin V and 5 µl 7-AAD for 15 min at room temperature in the dark. Then cells were transferred to flow tubes with 400 µl Annexin V binding buffer per tube. Cell sample were analyzed by BD FACSCanto10™ flow cytometer within an hour.
Phagocytosis assay
Generation of DCs in vitro
Dendritic cells were derived from bone marrow of C57BL/6 mice as previously described.Citation78 The phenotype of harvested cells is determined by flow cytometry. The cells with high dendritic cell surface markers CD11c and CD11b but low cell surface markers CD86 and MHCII were considered immature dendritic cells.
Stain tumor cells:
B16F10 cells were seeded at 1 × 10⁶ per dish in 10 cm petri dishes and cultured in 10 ml RPMI culture medium overnight. Then the B16F10 cells were stained with mixture of 7 ml serum-free media and 50 nM CellTrackerTM green CMFDA at 37°C for 30 min. Then the cells were washed with RPMI culture medium and incubated overnight at 37°C. Followed by DMSO, 100 nM MeSG or 2.5 µM doxorubicin treatments for 24 hours.
Co-culture the labeled B16F10 cells with the immature DCs
On second day, the treated B16F10 cells were trypsinized and then collected in RPMI culture medium. The cell number of BMDCs and the labeled B16F10 cells were counted with hemocytometer. 400,000 BMDCs + 400,000 B16F10 cells (ratio 1:1) were seeded in 6-well Ultra-low attachment plates with a total volume of 4 ml per well. Then the cells were co-cultured for 5 h at 37°C.
Immunostaining
BMDCs and B16F10 cells mixture were transferred to round-bottom 96-well plate followed by two washes and then incubated with Fc block (anti-CD16/CD32). And then stained with 1:100 APC-CD11c at 4°C for 30 min. Then the cells were washed twice and stained with Hoechst33342 at 1:4000 dilution for 15 minutes. Then the cells were washed and incubated in 2% PFA at 4°C for 20 min, followed by wash and resuspended in 100 µl PBS to be ready for flow cytometry. For each sample, 5000 cells were acquired by ImageStreamX MKII and analyzed with AMNIS IDEAS Software. To determine the phagocytic events the Internalization wizard in the IDEAS was used. Single cells were selected in the dot plot with respect to aspect and aspect-ratio. Then the green fluorescence positive cells (FITC) were selected by gating on cells with high Max-Pixel_MC_FITC and Intensity_MC_Intensity values. Then the internalization score is presented in the histogram of Internalization_Erode_FITC. Phagocytotic events were chosen by selecting the population with internalization score above 0. (Supplement-2).
Statistics
All experiments were repeated at least three times. Western blotting images shown in the manuscript are from a representative experiment in a triplicate. Student’s T-test were used to compare the difference between two treatment groups. When compare the differences among ≥3 groups, we used one way ANOVA with Tukey’s multiple comparisons posttest. A p value of ≤0.05 was considered significant. All statistical analysis were performed using GraphPad Prism 7 software.
Author contribution
RZ, RJH, TDS and JDN helped conceptualize the project, interpret the results and write the manuscript. RZ carried out all experiments and data analysis.
Supplemental Material
Download Zip (1.2 MB)Acknowledgments
This work was funded by a Penn State University Professorship in Medical Oncology, the Miriam Beckner Cancer Research Endowment and a gift from Highmark to the Penn State Cancer Institute. We thank Jianhong Zhang from Penn State College of Medicine’s Flow Cytometry Core (RRID:SCR_021134) for assistance with flow cytometry and ImageStream analysis. Amnis ImageStream X Mk II Imaging Cytometer (Luminex, Seattle, Wash) was funded, in part, under a grant with the Pennsylvania Department of Health using Tobacco CURE Funds. The Department specifically disclaims responsibility for any analyses, interpretations or conclusions. The compound TTI-3114 (MeSG) was supplied by IOThera Inc. (formerly Terpenoid Therapeutics Inc by Material Transfer Agreement with Penn State College of Medicine).
Disclosure statement
RJH and JDN have financial and ownership interest in Terpenoid Therapeutics Incorporated and IOThera Incorporate which provided TTI-3114 for these experiments. RZ and TDS report no conflicts of interest.
Supplementary material
Supplemental data for this article can be accessed online at https://doi.org/10.1080/2162402X.2022.2104551
Additional information
Funding
References
- Sharma P, Allison JP. Immune checkpoint targeting in cancer therapy: toward combination strategies with curative potential. Cell. 2015;161(2):205–19. Epub 2015/04/11. PubMed PMID: 25860605; PMCID: PMC5905674. doi: 10.1016/j.cell.2015.03.030.
- Ribas A, Wolchok JD. Cancer immunotherapy using checkpoint blockade. Science (New York, NY). 2018;359(6382):1350–1355. Epub 2018/03/24. PubMed PMID: 29567705; PMCID: PMC7391259. doi: 10.1126/science.aar4060.
- Przybylski DJ, Bergsbaken JJ, Piccolo JK. Unleashing the power of immunotherapy and targeted therapy combinations: advancing cancer care or discovering unknown toxicities? J Oncol Pharm Prac: Off Pub Inter Soc Oncol Pharm Prac. 2021;27(4):930–938. Epub 2021/01/08. PubMed PMID: 33406979. doi: 10.1177/1078155220984235.
- Motzer R, Alekseev B, Rha SY, Porta C, Eto M, Powles T, Grünwald V, Hutson TE, Kopyltsov E, Méndez-Vidal MJ, et al. Lenvatinib plus pembrolizumab or everolimus for advanced renal cell carcinoma. N Engl J Med. 2021;384(14):1289–1300. Epub 2021/02/23. PubMed PMID: 33616314. doi: 10.1056/NEJMoa2035716
- Zhu M, Yang M, Zhang J, Yin Y, Fan X, Zhang Y, Qin S, Zhang H, Yu F. Immunogenic cell death induction by ionizing radiation. Frontiers in Immunology. 2021;12:705361. Epub 2021/09/08. PubMed PMID: 34489957; PMCID: PMC8417736. doi: 10.3389/fimmu.2021.705361.
- Voorwerk L, Slagter M, Horlings HM, Sikorska K, van de Vijver KK, de Maaker M, Nederlof I, Kluin RJC, Warren S, Ong S, et al. Immune induction strategies in metastatic triple-negative breast cancer to enhance the sensitivity to PD-1 blockade: the TONIC trial. Nat Med. 2019;25(6):920–928. Epub 2019/05/16. PubMed PMID: 31086347. doi: 10.1038/s41591-019-0432-4.
- Feola S, Russo S, Ylösmäki E, Cerullo V. Oncolytic ImmunoViroTherapy: a long history of crosstalk between viruses and immune system for cancer treatment. Pharmacol Ther. 2021;236:108103. Epub 2021/12/27. PubMed PMID: 34954301. doi: 10.1016/j.pharmthera.2021.108103.
- Huang H, Zhou J, Chen H, Li J, Zhang C, Jiang X, Ni C. The immunomodulatory effects of endocrine therapy in breast cancer. Journal of Experimental & Clinical Cancer Research: CR. 2021;40(1):19. Epub 2021/01/09. PubMed PMID: 33413549; PMCID: PMC7792133. doi: 10.1186/s13046-020-01788-4.
- Marin-Acevedo JA, Kimbrough EO, Lou Y. Next generation of immune checkpoint inhibitors and beyond. J Hematol Oncol. 2021;14(1):45. Epub 2021/03/21. PubMed PMID: 33741032; PMCID: PMC7977302. doi: 10.1186/s13045-021-01056-8.
- Yi M, Zheng X, Niu M, Zhu S, Ge H, Wu K. Combination strategies with PD-1/PD-L1 blockade: current advances and future directions. Mol Cancer. 2022;21(1):28. Epub 2022/01/23. PubMed PMID: 35062949. doi: 10.1186/s12943-021-01489-2.
- Yu J, Sun H, Cao W, Song Y, Jiang Z. Research progress on dendritic cell vaccines in cancer immunotherapy. Exp Hematol Oncol. 2022;11(1):3. Epub 2022/01/26. PubMed PMID: 35074008. doi: 10.1186/s40164-022-00257-2.
- Swinney DC. Phenotypic vs. target-based drug discovery for first-in-class medicines. Clin Pharmacol Ther. 2013;93(4):299–301. Epub 2013/03/21. PubMed PMID: 23511784. doi: 10.1038/clpt.2012.236.
- Chabner BA. NCI-60 Cell Line Screening: a Radical Departure in its Time. J Natl Cancer Inst. 2016;108(5):djv388. Epub 2016/01/13. PubMed PMID: 26755050. doi: 10.1093/jnci/djv388.
- Shoemaker RH. The NCI60 human tumour cell line anticancer drug screen. Nat Rev Cancer. 2006;6(10):813–823. PubMed PMID: ISI:000241303000017. doi:10.1038/nrc1951.
- Covell DG, Huang RL, Wallqvist A. Anticancer medicines in development: assessment of bioactivity profiles within the national cancer institute anticancer screening data. Mol Cancer Ther. 2007;6(8):2261–2270. PubMed PMID: WOS:000248663000013. doi:10.1158/1535-7163.mct-06-0787.
- Beutler JA, Shoemaker RH, Johnson T, Boyd MR. Cytotoxic geranyl stilbenes from Macaranga schweinfurthii. J Nat Prod. 1998;61(12):1509–1512. PubMed PMID: ISI:000077879700011. doi:10.1021/np980208m.
- Koubek EJ, Weissenrieder JS, Neighbors JD, Hohl RJ. Schweinfurthins: lipid modulators with promising anticancer activity. Lipids. 2018;53(8):767–784. Epub 2018/10/20. PubMed PMID: 30334267. doi: 10.1002/lipd.12088.
- Beutler JA, Jato J, Cragg GM, Boyd MR. Schweinfurthin D, a cytotoxic stilbene from Macaranga schweinfurthii. Nat Prod Lett. 2000;14(5):399–404. PubMed PMID: ISI:000089742200012. doi:10.1080/10575630008043774.
- Klausmeyer P, Van QN, Jato J, McCloud TG, Beutler JA. Schweinfurthins I and j from Macaranga schweinfurthii. J Nat Prod. 2010;73(3):479–481. PubMed PMID: WOS:000275885000035. doi:10.1021/np9006348.
- Yoder BJ, Cao S, Norris A, Miller JS, Ratovoson F, Razafitsalama J, Andriantsiferana R, Rasamison VE, Kingston DG. Antiproliferative prenylated stilbenes and flavonoids from Macaranga alnifolia from the Madagascar rainforest. J Nat Prod. 2007;70(3):342–346. Epub 2007/02/28. PubMed PMID: 17326683; PMCID: PMC2614403. doi: 10.1021/np060484y.
- Thoison O, Hnawia E, Gueritte-Voegelein F, Sevenet T. Plants of new-caledonia .140. Vedelianin, a Hexahydroxanthene derivative isolated from Macaranga vedeliana. Phytochemistry. 1992 PubMed PMID: ISI:A1992HM38900080;31(4):1439–1442. doi:10.1016/0031-9422(92)80315-6.
- Beutler JA, Jato J, Cragg G, Wiemer DF, Neighbors JD, Salnikova MS, Hollingshead M, Scudiero DA, and McCloud TG. The Schweinfurthins: issues in development of a plant-derived anticancer lead. In: Bogers RJ editor. Medicinal and aromatic plants. New York, NY: Springer; 2005. p. 301–309.
- Kodet JG, Beutler JA, Wiemer DF. Synthesis and structure activity relationships of schweinfurthin indoles. Bioorg Med Chem. 2014;22(8):2542–2552. PubMed PMID: WOS:000334338000019. doi:10.1016/j.bmc.2014.02.043.
- Mente NR, Wiemer AJ, Neighbors JD, Beutler JA, Hohl RJ, Wiemer DF. Total synthesis of (R,R,R)– and (S,S,S)–Schweinfurthin F: differences of bioactivity in the enantiomeric series. Biorg Med Chem Lett. 2007;17(4):911–915. doi:10.1016/j.bmcl.2006.11.096.
- Neighbors JD, Salnikova MS, Beutler JA, Wiemer DF. Synthesis and structure-activity studies of schweinfurthin B analogs: evidence for the importance of a D-ring hydrogen bond donor in expression of differential cytotoxicity. Bioorg Med Chem. 2006;14(6):1771–1784. Epub 2005/11/18. PubMed PMID: 16290161. doi: 10.1016/j.bmc.2005.10.025.
- Ulrich NC, Kodet JG, Mente NR, Kuder CH, Beutler JA, Hohl RJ, Wiemer DF. Structural analogues of schweinfurthin F: probing the steric, electronic, and hydrophobic properties of the D-ring substructure. Bioorg Med Chem. 2010;18(4):1676–1683. PubMed PMID: WOS:000274425500033. doi:10.1016/j.bmc.2009.12.063.
- Burgett AWG, Poulsen TB, Wangkanont K, Anderson DR, Kikuchi C, Shimada K, Okubo S, Fortner KC, Mimaki Y, Kuroda M, et al. Natural products reveal cancer cell dependence on oxysterol-binding proteins. Nat Chem Biol. 2011;7(9):639–647. PubMed PMID: WOS:000294381400015. doi:10.1038/nhembio.625.
- Bao X, Zheng W, Sugi NH, Agarwala K, Xu Q, Wang Z, Tendyke K, Lee W, Parent L, Wei L, et al. Small molecule schweinfurthins selectively inhibit cancer cell proliferation and mTOR/AKT signaling by interfering with trans-Golgi-network trafficking. Cancer Biol Ther. 2015;16(4):1–13. doi:10.1080/15384047.2015.1019184.
- Kuder CH, Weivoda MM, Zhang Y, Zhu J, Neighbors JD, Wiemer DF, Hohl RJ. 3-Deoxyschweinfurthin B lowers cholesterol levels by decreasing synthesis and increasing export in cultured cancer cell lines. Lipids. 2015:1–13. doi:10.1007/s11745-015-4083-z.
- Kokolus KM, Haley JS, Koubek EJ, Gowda R, Dinavahi SS, Sharma A, Claxton DF, Helm KF, Drabick JJ, and Robertson GP, et al. Schweinfurthin natural products induce regression of murine melanoma and pair with anti-PD-1 therapy to facilitate durable tumor immunity. Oncoimmunology. 2018;8(2):e1539614–5. PMCID: PMC Journal - In Process.
- Stevens JW, Meyerholz DK, Neighbors JD, Morcuende JA. 5’-methylschweinfurthin G reduces chondrosarcoma tumor growth Journal of orthopaedic research: official publication of the orthopaedic research society. J Orthop Res: Off Pub Orthop Res Soc. 2018;36(4):1283–1293. Epub 2017/09/30. PubMed PMID: 28960476. doi: 10.1002/jor.23753.
- Fucikova J, Kepp O, Kasikova L, Petroni G, Yamazaki T, Liu P, Zhao L, Spisek R, Kroemer G, Galluzzi L. Detection of immunogenic cell death and its relevance for cancer therapy. Cell Death Dis. 2020;11(11):1013. Epub 2020/11/28. PubMed PMID: 33243969; PMCID: PMC7691519 Samsara Therapeutics. G.K. has been holding research contracts with Bayer Healthcare, Genentech, Glaxo Smyth Kline, Institut Mérieux, Lytix Pharma, PharmaMar, Sotio, and Vasculox. He is on the Board of Directors of the Bristol Myers Squibb Foundation France and is a scientific co-founder of everImmune, Samsara Therapeutics, and Therafast Bio. L.G. received research support from Lytix and Phosplatin, consulting fees from OmniSEQ, Astra Zeneca, Inzen, and the Luke Heller TECPR2 Foundation, and is a member of the Scientific Advisory Committee of Boehringer Ingelheim, The Longevity Labs, and OmniSEQ. All other authors have no conflicts to declare. doi: 10.1038/s41419-020-03221-2.
- Fucikova J, Kasikova L, Truxova I, Laco J, Skapa P, Ryska A, Spisek R. Relevance of the chaperone-like protein calreticulin for the biological behavior and clinical outcome of cancer. Immunol Lett. 2018;193:25–34. Epub 2017/11/28. PubMed PMID: 29175313. doi: 10.1016/j.imlet.2017.11.006.
- Krysko DV, Garg AD, Kaczmarek A, Krysko O, Agostinis P, Vandenabeele P. Immunogenic cell death and DAMPs in cancer therapy. Nat Rev Cancer. 2012;12(12):860–875. Epub 2012/11/16. PubMed PMID: 23151605. doi: 10.1038/nrc3380.
- Gardai SJ, McPhillips KA, Frasch SC, Janssen WJ, Starefeldt A, Murphy-Ullrich JE, Bratton DL, Oldenborg PA, Michalak M, Henson PM. Cell-surface calreticulin initiates clearance of viable or apoptotic cells through trans-activation of LRP on the phagocyte. Cell. 2005;123(2):321–334. Epub 2005/10/22. PubMed PMID: 16239148. doi: 10.1016/j.cell.2005.08.032.
- Radogna F, Diederich M. Stress-induced cellular responses in immunogenic cell death: implications for cancer immunotherapy. Biochem Pharmacol. 2018;153:12–23. PubMed PMID: WOS:000434102600003. doi:10.1016/j.bcp.2018.02.006.
- Kroemer G, Galluzzi L, Kepp O, Zitvogel L. Immunogenic cell death in cancer therapy. Annu Rev Immunol. 2013;31:51–72. Epub 2012/11/20. PubMed PMID: 23157435. doi: 10.1146/annurev-immunol-032712-100008.
- Wiersma VR, Michalak M, Abdullah TM, Bremer E, Eggleton P. Mechanisms of translocation of ER chaperones to the cell surface and immunomodulatory roles in cancer and autoimmunity. Front Oncol. 2015;5 PubMed PMID: WOS:000359071800001. doi:10.3389/fonc.2015.00007.
- Panaretakis T, Kepp O, Brockmeier U, Tesniere A, Bjorklund AC, Chapman DC, Durchschlag M, Joza N, Pierron G, van Endert P, et al. Mechanisms of pre-apoptotic calreticulin exposure in immunogenic cell death. EMBO J. 2009;28(5):578–590. Epub 2009/01/24. PubMed PMID: 19165151; PMCID: PMC2657583. doi: 10.1038/emboj.2009.1.
- Madeo F, Durchschlag M, Kepp O, Panaretakis T, Zitvogel L, Fröhlich KU, Kroemer G. Phylogenetic conservation of the preapoptotic calreticulin exposure pathway from yeast to mammals. Cell Cycle (Georgetown, Tex). 2009;8(4):639–642. Epub 2009/02/03. PubMed PMID: 19182525. doi: 10.4161/cc.8.4.7794.
- Nakamura M, Moriya M, Baba T, Michikawa Y, Yamanobe T, Arai K, Okinaga S, Kobayashi T. An endoplasmic reticulum protein, calreticulin, is transported into the acrosome of rat sperm. Exp Cell Res. 1993;205(1):101–110. Epub 1993/03/01. PubMed PMID: 8453984. doi: 10.1006/excr.1993.1063.
- Nakamura M, Oshio S, Tamura A, Okinaga S, Arai K. Antisera to calreticulin inhibits sperm motility in mice. Biochem Biophys Res Commun. 1992;186(2):984–990. Epub 1992/07/31. PubMed PMID: 1497681. doi: 10.1016/0006-291x(92)90843-a.
- Park BJ, Lee DG, Yu JR, Jung SK, Choi K, Lee J, Lee J, Kim YS, Lee JI, Kwon JY, et al. Calreticulin, a calcium-binding molecular chaperone, is required for stress response and fertility in Caenorhabditis elegans. Mol Biol Cell. 2001;12(9):2835–2845. Epub 2001/09/13. PubMed PMID: 11553721; PMCID: PMC59717. doi: 10.1091/mbc.12.9.2835.
- Radogna F, Dicato M, Diederich M. Natural modulators of the hallmarks of immunogenic cell death. Biochem Pharmacol. 2019;162:55–70. Epub 2019/01/08. PubMed PMID: 30615863. doi: 10.1016/j.bcp.2018.12.016.
- Zhou J, Wang G, Chen Y, Wang H, Hua Y, Cai Z. Immunogenic cell death in cancer therapy: present and emerging inducers. J Cell Mol Med. 2019;23(8):4854–4865. Epub 2019/06/19. PubMed PMID: 31210425; PMCID: PMC6653385. doi: 10.1111/jcmm.14356.
- Vaes RDW, Hendriks LEL, Vooijs M, De Ruysscher D. Biomarkers of radiotherapy-induced immunogenic cell death. Cells. 2021;10(4):930. Epub 2021/05/01. PubMed PMID: 33920544; PMCID: PMC8073519. doi: 10.3390/cells10040930.
- Tsao H, Zhang X, Benoit E, Haluska FG. Identification of PTEN/MMAC1 alterations in uncultured melanomas and melanoma cell lines. Oncogene. 1998;16(26):3397–3402. Epub 1998/08/06. PubMed PMID: 9692547. doi: 10.1038/sj.onc.1201881.
- Tsao H, Goel V, Wu H, Yang G, Haluska FG. Genetic interaction between NRAS and BRAF mutations and PTEN/MMAC1 inactivation in melanoma. J Invest Dermatol. 2004;122(2):337–341. Epub 2004/03/11. PubMed PMID: 15009714; PMCID: PMC2586668. doi: 10.1046/j.0022-202X.2004.22243.x.
- Feng R, Zhao H, Xu J, Shen C. CD47: the next checkpoint target for cancer immunotherapy. Crit Rev Oncol Hematol. 2020;152:103014. Epub 2020/06/15. PubMed PMID: 32535479. doi: 10.1016/j.critrevonc.2020.103014.
- Panaretakis T, Joza N, Modjtahedi N, Tesniere A, Vitale I, Durchschlag M, Fimia GM, Kepp O, Piacentini M, Froehlich KU, et al. The co-translocation of ERp57 and calreticulin determines the immunogenicity of cell death. Cell Death Differ. 2008;15(9):1499–1509. Epub 2008/05/10. PubMed PMID: 18464797. doi: 10.1038/cdd.2008.67.
- Jessop CE, Chakravarthi S, Garbi N, Hämmerling GJ, Lovell S, Bulleid NJ. ERp57 is essential for efficient folding of glycoproteins sharing common structural domains. EMBO J. 2007;26(1):28–40. Epub 2006/12/16. PubMed PMID: 17170699; PMCID: PMC1782378. doi: 10.1038/sj.emboj.7601505.
- Kusaczuk M. Tauroursodeoxycholate-bile acid with chaperoning activity: molecular and cellular effects and therapeutic perspectives. Cells. 2019;8(12):1471. Epub 2019/11/24. PubMed PMID: 31757001; PMCID: PMC6952947. doi: 10.3390/cells8121471.
- Mahameed M, Wilhelm T, Darawshi O, Obiedat A, Tommy WS, Chintha C, Schubert T, Samali A, Chevet E, Eriksson LA, et al. The unfolded protein response modulators GSK2606414 and KIRA6 are potent KIT inhibitors. Cell Death Dis. 2019;10(4):300. Epub 2019/04/02. PubMed PMID: 30931942; PMCID: PMC6443726 Ltd. The other authors declare that they have no conflict of interest. doi: 10.1038/s41419-019-1523-3.
- van Engeland M, Nieland LJ, Ramaekers FC, Schutte B, Reutelingsperger CP. Annexin V-affinity assay: a review on an apoptosis detection system based on phosphatidylserine exposure. Cytometry. 1998;31(1):1–9. Epub 1998/02/05. PubMed PMID: 9450519. doi: 10.1002/(sici)1097-0320(19980101)31:1<1::aid-cyto1>3.0.co;2-r.
- Schmid I, Krall WJ, Uittenbogaart CH, Braun J, Giorgi JV. Dead cell discrimination with 7-amino-actinomycin D in combination with dual color immunofluorescence in single laser flow cytometry. Cytometry. 1992;13(2):204–208. Epub 1992/01/01. PubMed PMID: 1547670. doi: 10.1002/cyto.990130216.
- Van Noorden CJ. The history of Z-VAD-FMK, a tool for understanding the significance of caspase inhibition. Acta Histochem. 2001;103(3):241–251. Epub 2001/08/03. PubMed PMID: 11482370. doi: 10.1078/0065-1281-00601.
- Gregoli PA, Bondurant MC. Function of caspases in regulating apoptosis caused by erythropoietin deprivation in erythroid progenitors. J Cell Physiol. 1999;178(2):133–143. Epub 1999/02/27. PubMed PMID: 10048577. doi: 10.1002/(sici)1097-4652(199902)178:2<133::aid-jcp2>3.0.co;2-5.
- Chardin P, McCormick F. Brefeldin A: the advantage of being uncompetitive. Cell. 1999;97(2):153–155. Epub 1999/04/29. PubMed PMID: 10219235. doi: 10.1016/s0092-8674(00)80724-2.
- Kepp O, Menger L, Vacchelli E, Locher C, Adjemian S, Yamazaki T, Martins I, Sukkurwala AQ, Michaud M, Senovilla L, et al. Crosstalk between ER stress and immunogenic cell death. Cytokine Growth Factor Rev. 2013;24(4):311–318. Epub 2013/06/22. PubMed PMID: 23787159. doi: 10.1016/j.cytogfr.2013.05.001.
- Kepp O, Galluzzi L, Giordanetto F, Tesniere A, Vitale I, Martins I, Schlemmer F, Adjemian S, Zitvogel L, Kroemer G. Disruption of the PP1/GADD34 complex induces calreticulin exposure. Cell Cycle (Georgetown, Tex). 2009;8(23):3971–3977. Epub 2009/11/11. PubMed PMID: 19901557. doi: 10.4161/cc.8.23.10191.
- Giglio P, Gagliardi M, Tumino N, Antunes F, Smaili S, Cotella D, Santoro C, Bernardini R, Mattei M, Piacentini M, et al. PKR and GCN2 stress kinases promote an ER stress-independent eIF2α phosphorylation responsible for calreticulin exposure in melanoma cells. Oncoimmunology. 2018;7(8):e1466765. Epub 2018/09/18. PubMed PMID: 30221067; PMCID: PMC6136861. doi: 10.1080/2162402x.2018.1466765.
- Gomes-da-Silva LC, Zhao L, Bezu L, Zhou H, Sauvat A, Liu P, Durand S, Leduc M, Souquere S, Loos F, et al. Photodynamic therapy with redaporfin targets the endoplasmic reticulum and Golgi apparatus. EMBO J. 2018;37(13). Epub 2018/05/29. PubMed PMID: 29807932; PMCID: PMC6028029. doi: 10.15252/embj.201798354.
- Obeid M, Tesniere A, Ghiringhelli F, Fimia GM, Apetoh L, Perfettini JL, Castedo M, Mignot G, Panaretakis T, Casares N, et al. Calreticulin exposure dictates the immunogenicity of cancer cell death. Nat Med. 2007;13(1):54–61. Epub 2006/12/26. PubMed PMID: 17187072. doi: 10.1038/nm1523.
- Lam STT, Lim CJ. Cancer biology of the endoplasmic reticulum lectin chaperones calreticulin, calnexin and PDIA3/ERp57. Vol. 59 . Agellon L.B, Michalak M editors. Progress in Molecular and Subcellular Biology. New York, NY: Springer Cham. 181–196; 2021. doi: 10.1007/978-3-030-67696-4_9.
- Liu CC, Leclair P, Pedari F, Vieira H, Monajemi M, Sly LM, Reid GS, Lim CJ. Integrins and ERp57 coordinate to regulate cell surface calreticulin in immunogenic cell death. Front Oncol. 2019;9:411. Epub 2019/06/14. PubMed PMID: 31192123; PMCID: PMC6546883. doi: 10.3389/fonc.2019.00411.
- Werthmöller N, Frey B, Wunderlich R, Fietkau R, Gaipl US. Modulation of radiochemoimmunotherapy-induced B16 melanoma cell death by the pan-caspase inhibitor zVAD-fmk induces anti-tumor immunity in a HMGB1-, nucleotide- and T-cell-dependent manner. Cell Death Dis. 2015;6(5):e1761. Epub 2015/05/15. PubMed PMID: 25973681; PMCID: PMC4669707. doi: 10.1038/cddis.2015.129.
- Garg AD, Krysko DV, Verfaillie T, Kaczmarek A, Ferreira GB, Marysael T, Rubio N, Firczuk M, Mathieu C, Roebroek AJ, et al. A novel pathway combining calreticulin exposure and ATP secretion in immunogenic cancer cell death. EMBO J. 2012;31(5):1062–1079. Epub 2012/01/19. PubMed PMID: 22252128; PMCID: PMC3298003. doi: 10.1038/emboj.2011.497.
- Jagot-Lacoussiere L, Kotula E, Villoutreix BO, Bruzzoni-Giovanelli H, Poyet JL. A cell-penetrating peptide targeting AAC-11 specifically induces cancer cells death. Cancer Res. 2016;76(18):5479–5490. Epub 2016/07/14. PubMed PMID: 27406828. doi: 10.1158/0008-5472.can-16-0302.
- Pasquereau-Kotula E, Habault J, Kroemer G, Poyet JL. The anticancer peptide RT53 induces immunogenic cell death. PLoS One. 2018;13(8):e0201220. Epub 2018/08/07. PubMed PMID: 30080874; PMCID: PMC6078289 the donor) of an instrument to GK. This does not alter our adherence to PLOS ONE policies on sharing data and materials. doi: 10.1371/journal.pone.0201220.
- Cao L, Mu W. Necrostatin-1 and necroptosis inhibition: pathophysiology and therapeutic implications. Pharmacological Research. 2021;163:105297. Epub 2020/11/13. PubMed PMID: 33181319; PMCID: PMC7962892. doi: 10.1016/j.phrs.2020.105297.
- Zhu H, Sun A. Programmed necrosis in heart disease: molecular mechanisms and clinical implications. J Mol Cell Cardiol. 2018;116:125–134. Epub 2018/02/10. PubMed PMID: 29426003. doi: 10.1016/j.yjmcc.2018.01.018.
- Moosavi B, Gao M, Zhu XL, Yang GF. The anti-cancer compound Schweinfurthin A targets Osh2 and disrupts lipid metabolism in the yeast model. Bioorg Chem. 2020;94:103471. Epub 2019/12/10. PubMed PMID: 31813476. doi: 10.1016/j.bioorg.2019.103471.
- Péresse T, Kovacs D, Subra M, Bigay J, Tsai MC, Polidori J, Gautier R, Desrat S, Fleuriot L, Debayle D, et al. Molecular and cellular dissection of the oxysterol-binding protein cycle through a fluorescent inhibitor. J Biol Chem. 2020;295(13):4277–4288. Epub 2020/02/23. PubMed PMID: 32075908; PMCID: PMC7105299. doi: 10.1074/jbc.RA119.012012.
- Kuder CH, Sheehy RM, Neighbors JD, Wiemer DF, Hohl RJ. Functional evaluation of a fluorescent schweinfurthin: mechanism of cytotoxicity and intracellular quantification. Mol Pharmacol. 2012;82(1):9–16. PubMed PMID: WOS:000305470000002. doi:10.1124/mol.111.077107.
- Niu X, Chen L, Li Y, Hu Z, He F. Ferroptosis, necroptosis, and pyroptosis in the tumor microenvironment: perspectives for immunotherapy of SCLC. Semin Cancer Biol. 2022; Epub 2022/03/16. PubMed PMID: 35288298. doi: 10.1016/j.semcancer.2022.03.009.
- Demuynck R, Efimova I, Naessens F, Krysko DV. Immunogenic ferroptosis and where to find it? Journal for Immunotherapy of Cancer. 2021;9(12):e003430. Epub 2021/12/15. PubMed PMID: 34903554; PMCID: PMC8671998. doi: 10.1136/jitc-2021-003430.
- Rabouw HH, Visser LJ, Passchier TC, Langereis MA, Liu F, Giansanti P, van Vliet ALW, Dekker JG, van der Grein SG, Saucedo JG, et al. Inhibition of the integrated stress response by viral proteins that block p-eIF2-eIF2B association. Nature Microbiology. 2020;5(11):1361–1373. Epub 2020/07/22. PubMed PMID: 32690955. doi: 10.1038/s41564-020-0759-0.
- Tagaram HR, Watson AM, Lemonnier FA, Staveley-O’Carroll K, Tevethia SS, Schell TD. An SV40 VP1-derived epitope recognized by CD8+ T cells is naturally processed and presented by HLA-A*0201 and cross-reactive with human polyomavirus determinants. Virology. 2008;376(1):183–190. Epub 2008/04/12. PubMed PMID: 18402997; PMCID: PMC2464359. doi: 10.1016/j.virol.2008.02.033.