
ABSTRACT
NKG2D is a major natural killer (NK) cell-activating receptor that recognizes eight ligands (NKG2DLs), including MICA, and whose engagement triggers NK cell effector functions. As NKG2DLs are upregulated on tumor cells but tumors can subvert the NKG2D-NKG2DL axis, NKG2DLs constitute attractive targets for antibody (Ab)-based immuno-oncology therapies. However, such approaches require a deep characterization of NKG2DLs and NKG2D cell surface expression on primary tumor and immune cells. Here, using a bioinformatic analysis, we observed that MICA is overexpressed in renal cell carcinoma (RCC), and we also detected an association between the NKG2D-MICA axis and a diminished overall survival of RCC patients. Also, by flow cytometry (FC), we observed that MICA was the only NKG2DL over-expressed on clear cell renal cell carcinoma (ccRCC) tumor cells, including cancer stem cells (CSC) that also coexpressed NKG2D. Moreover, tumor-infiltrating leukocytes (TIL), but not peripheral blood lymphoid cells (PBL) from ccRCC patients, over-expressed MICA, ULBP3 and ULBP4. In addition, NKG2D was downregulated on peripheral blood NK cells (PBNK) from ccRCC patients but upregulated on tumor-infiltrating NK cells (TINK). These TINK exhibited impaired degranulation that negatively correlated with NKG2D expression, diminished IFN-γ production, upregulation of TIM-3, and an impaired glucose intake upon stimulation with cytokines, indicating that they are dysfunctional, display features of exhaustion and an altered metabolic fitness. We conclude that ccRCC patients exhibit a distorted MICA-NKG2D axis, and MICA emerges as the forefront NKG2DL for the development of targeted therapies in ccRCC.
Background
NK cells and cytotoxic T lymphocytes (CTL) constitute the most relevant effector cells that mediate tumor cell elimination through their cytolytic activity and the secretion of cytokines such as interferon (IFN)-γ.Citation1 NK cell frequency in blood, tumor infiltration and function are associated with improved patient survival in several cancers.Citation2–4 These findings highlight their crucial role in tumor immunity and fostered the interest in exploiting the immunotherapeutic potential of NK cells to eradicate tumor cells in oncology patients.Citation5,Citation6 As such, several monoclonal Abs (mAbs) and bioactive assets that regulate NK cell activity against tumors are under investigation.Citation7 Nonetheless, eradication of solid tumors represents a tough challenge because NK cell-based strategies in immuno-oncology must overcome the immunosuppressive tumor microenvironment (TME) that induces NK cell exhaustion and dysfunction.Citation8,Citation9 Exhaustion in NK cells has been associated with decreased expression of several activating receptors and upregulation of NKG2A, PD-1 and TIM-3.Citation10–13 Recently, it was demonstrated that prolonged stimulation of NK cells with plate-bound agonists of NKp46 and NKG2D generated an exhaustion signature characterized by downregulation of activating receptors such as CD16, NKG2D, NKp46 and DNAM-1, upregulation of inhibitory receptors such as TIGIT, CD96 and TIM-3, impaired cytokine production and cytotoxic activity, and metabolic defects, resulting in a decreased in vivo persistence, function and tumor control.Citation14 Upregulation of CD96Citation15(p96) and TIGITCitation12,Citation16 has been associated with NK cell exhaustion by others, while NK cell effector function could be reversed by blockade of TIM-3.Citation11 Therefore, targeting novel molecules as well as combination strategies with immune checkpoint inhibitors (ICI) emerged as attractive possibilities to foster NK cell activity against tumors.Citation17,Citation18
NK cells detect tumor cells through germline-encoded receptors that trigger their effector functions.Citation19,Citation20 One of the most relevant and well characterized activating receptors is NKG2D (CD314), encoded by the klrk1 gene.Citation21,Citation22 Interference with NKG2D function by in vivo blockade or gene knockout leads to an increased susceptibility to spontaneous tumor development and tumor progression.Citation23,Citation24 Accordingly, attempts to capitalize on NKG2DLs as molecular targets in immuno-oncology are underway. In humans, eight different NKG2DLs have been described.Citation25–27 These NKG2DLs are the MHC class I-chain related proteins A and B (MICA and MICB) and the members of the UL-16 binding protein (ULBP) family, also known as Retinoic Acid Early Transcripts (RAET) 1, ULBP1 (RAET1I), ULBP2 (RAET1H), ULBP3 (RAET1N), ULBP4 (RAET1E), ULBP5 (RAET1G) and ULBP6 (RAET1L).Citation21,Citation27
Although MICA and MICB transcripts could be detected in many normal tissues,Citation28 the expression of the proteins is highly restricted to tumor cells.Citation27,Citation29–33 Expression of MICA/B was also observed in many tumors and normal epithelia by standard and confocal microscopy using frozen tissue sections, with a predominant intracellular localization.Citation34 Also, we previously observed that melanoma cell lines and metastatic melanomas display an intracellular pool of MICA but only some of them exhibit cell surface MICA.Citation35 Other NKG2DLs have also been shown to be over-expressed on tumors and mobilize NKG2D-dependent NK cell effector functions.Citation32,Citation36,Citation37 However, NKG2DLs are also involved in tumor-immune escape that subvert the biological function of NKG2D due to their shedding induced by tumor-secreted metalloproteases or phosphatidylinositol phospholipase C or their secretion in exosomes.Citation38–42 Therefore, although targeting NKG2DLs emerged as an attractive pipeline in immuno-oncology,Citation43–45 their expression on the cell surface of freshly isolated solid tumors has only partially been addressed.
Antibody-dependent cell-mediated cytotoxicity (ADCC) is one of the major NK cell-mediated effector functions and responsible for the therapeutic efficacy of several mAbs currently used to treat cancer patients.Citation46,Citation47 We previously observed that cell surface MICA constitutes a druggable target because anti-MICA Abs generated by immunization with a chimeric protein significantly delayed the growth of MICA-expressing tumors in part due to the induction of ADCC.Citation48 Complementary results were published recently using another chimeric protein as cancer vaccine that elicits anti-MICA Abs that trigger T cell- and NK cell-mediated tumor elimination.Citation49 Targeting MICA and MICB has been also assessed using mAbs.Citation43,Citation44,Citation50–52 However, to successfully trigger ADCC against NKG2DLs, these molecules should be expressed on the tumor cell surface, which should be unambiguously assessed on primary tumors by strategies such as classical FC or cytometry-time-of-flight (CYTOF). Such approaches would allow the selection of the optimal NKG2DL to be targeted and mitigate risks in clinical trials with putative anti-NKG2DL Abs because it would facilitate the selection of patients with higher chances of clinical benefit.
Renal cell carcinomas constitute the most frequent type of kidney cancer, with a global incidence in 2018 of 4.6 cases per 100,000 individuals according to GLOBOCAN 2020. The most frequent RCC is ccRCC (70–75% of all RCC), followed by papillary RCC (PRCC), chromophobe RCC (ChRCC) and other less frequent types of RCC. Conversely, other kidney tumors such as renal oncocytoma (RO) are benign. Prognosis is good for patients diagnosed at early stages of RCC (five-year survival rates of 81% for stage I RCC and 74% for stage II RCC) but the prognosis worsens for patients with stages III and IV of RCC.Citation53–55 RCC patients can be treated by partial or radical nephrectomy, kinase inhibitors or, more recently, with ICI that target the PD-1/PD-L1 axis.Citation56,Citation57 Accordingly, the modulation of the immune system seems to provide novel therapeutic opportunities for RCC patients. However, recurrence and metastasis remain as a major problem for these patients. As tumor immunoevasion strategies impact on TINK and might involve the NKG2D-NKG2DL axis,Citation58,Citation59 discovering novel targets is of major interest for immunotherapy and the NKG2D-NKG2DL axis has emerged as a promising target in immuno-oncology.Citation45
In this context, we explored the expression of NKG2DLs on ccRCC, assessed their expression on CSC (which have been linked to recurrence and metastatic potentialCitation60), characterized the expression of NKG2DLs and NKG2D on TIL and analyzed PBNK and TINK effector functions. Our results indicate that MICA is indeed the only NKG2DL expressed on the cell surface of tumor cells, that CSC coexpress MICA and NKG2D, that TINK express high levels of NKG2D and several NKG2DLs including MICA, and that they display a dysfunctional phenotype with features of exhaustion and metabolic abnormalities. In this scenario of tumor-driven immune dysregulation, MICA emerges as a forefront target in immuno-oncology.
Methods
Patients and samples
Peripheral blood mononuclear cells (PBMC) were isolated from the blood of healthy donors (HD, provided by the Blood Bank of the Hospital Churruca-Visca of Buenos Aires) or from kidney cancer patients (drawn just before nephrectomy) by Ficoll-Paque™ Plus (GE Life Sciences) centrifugation. Blood and nephrectomies were provided by the urology service from the Centro de Educación Médica e Investigaciones Clínicas “Norberto Quirno” (CEMIC) or the Hospital Alemán, both from the city of Buenos Aires. The characteristics of the patients are listed in . A total of 38 patients with ccRCC, 6 patients with ChRCC, 4 patients with RO and 33 HD were included in the study. Diagnosis of each RCC was confirmed by the pathology service. This study was conducted according to the guidelines of the Declaration of Helsinki and approved by the Institutional Ethics Committee of IBYME (protocol CE003-03/2014, date of approval: March 20, 2014) or of the Hospital Alemán (date of approval: June 15, 2018). Also, informed consent was obtained from all subjects involved in the study. Only patients older than 18 y with a presumptive or confirmed diagnosis of kidney cancer that have not received treatment for cancer and that signed the informed consent were included in this study (inclusion criteria).
Table 1. Patients with RCC included in the study.
Preparation of tumor cell suspensions
Surgical biopsies of human RCC were obtained from patients subjected to partial or radical nephrectomy and used for the preparation of single-cell suspensions, as previously described.Citation59 Briefly, tumors were cut into small pieces and subjected to mechanical dissociation and filtration through nylon mesh (70 or 100 µm) in the presence of phosphate-buffered saline. After washing with saline solution, cells were used for labeling with mAbs and FC analysis. In some cases, tumor-infiltrating immune cells were enriched by Ficoll-Paque™ Plus (GE Life Sciences) centrifugation. All procedures, except the centrifugations, were performed on ice. Tumor and blood samples were used as soon as they were obtained, and they were not freeze-thawed.
Cell cultures
PBMC from HD and ccRCC patients, as well as TIL were cultured in complete RPMI medium (RPMI-1640 from Gibco, supplemented with fetal bovine serum 10% from Natocor-Córdoba, Argentina-, sodium pyruvate 54 ng/ml, glutamine 0,292 mg/ml, both from Invitrogen and gentamycin 40 μg/ml from Bagó) at 37°C for an overnight period. K562 cells (used to stimulate NK cells and assess degranulation) were obtained from ATCC and were cultured in complete RPMI medium.
Bioinformatic analysis
Data about expression of genes encoding NKG2DLs in human normal kidney and tumors were obtained from The Human Protein Atlas (https://www.proteinatlas.org/) and expressed as TPM (Transcripts Per Million) for human normal kidney or as FPKM (Fragments Per Kilobase Million) for different tumors. To compare expression in normal kidney vs kidney tumors, expression was normalized against a set of reference genes suitable for normalization of kidney samples (PGAM1, NOP10, FIS1, GANAB, NDUFB11, HEBP1 and HDGF)Citation61 and against a set of highly uniform genes strongly expressed in 16 normal human tissues (adrenal, adipose, brain, breast, colon, heart, kidney, liver, lung, lymph, ovary, prostate, skeletal muscle, testes, thyroid and white blood cells) that have been proposed to be useful for calibration (C1orf43, CHMP2A, EMC7, GPI, PSMB2, PSMB4, RAB7A, REEP5, SNRPD3, VCP and VPS29).Citation62 Data presented correspond to 32 samples of human normal kidney and 877 samples of human RCC (528 ccRCC, 285 PRCC and 64 ChRCC). Analysis of overall survival of patients with ccRCC (533 samples) was performed using the R2 Genomics Analysis and Visualization Platform (http://r2.amc.nl). The results shown here are based upon data generated by The Cancer Genome Atlas (TCGA) Research Network: https://www.cancer.gov/tcga identified as Tumor Kidney Renal Clear Cell Carcinoma – TCGA – 533 – rsem – tcgars, ID: KIRC, R2 internal identifier: ps_avgpres_tcgakirc533_tcgars.Citation63 Samples were analyzed and divided according to high and low expression of NKG2DLs and NK cell receptors. High vs. low values for different parameters were defined using the Kaplan Scan cutoff mode.
Antibodies and reagents
The following mAbs against human molecules were used for FC: APC/Cy7 anti-CD45 (HI30), PerCP/Cy5.5 anti-CD33 (WM53), PerCP/Cy5.5 anti-CD34 (581), FITC anti-CD3 (UCHT1), PE anti-NKG2D (1D11), PE/Cy7 anti-CD44 (IM7), APC anti-CD105 (43A3), BV421 anti-TIM-3 (F38-2E2), BV421 anti-IFN-γ (4S.B3), BV421 anti-CD107a (H4A3) and Alexa Fluor (AF) 488 anti-PD1 (EH12.2H7) from BioLegend; AF488 anti-MICA (159,227), APC anti-MICB (236,511), AF488 anti-ULBP1 (170,818), APC anti-ULBP2/5/6 (165,903), PE anti-ULBP3 (166,510) and PE anti-ULBP4 (709,116) from Biotechne; APC and PE/Cy7 anti-CD56 (N901) from Beckman Coulter; and VF450 and PE/Cy7 anti-CD3 (UCHT1), VF450 anti-CD8a (OKT8) and VF450 anti-CD4 (OKT4) from TONBO. Human IL-12 and human IL-15 were from PeproTech; human IL-18 was from MBL International; Zombie Aqua Fixable Viability Kit, monensin and brefeldin A (Golgi Stop and Golgi Plug respectively) were from BioLegend; 2-NBDG (2-(N-(7-Nitrobenz-2-oxa-1,3-diazol-4-yl) Amino)-2-Deoxyglucose) was from ThermoFisher Scientific.
Flow cytometry
Flow cytometry was performed as described.Citation59 Nonspecific staining was blocked with 10% normal mouse serum. Expression of IFN-γ was analyzed by intracellular FC using Fix/Perm Buffer (BioLegend). Viability was assessed with Zombie Acqua (BioLegend). Cells were analyzed in a MACSQuant10 or in a MASQuant16 flow cytometer (Miltenyi Biotec). Data were analyzed using FlowJo X software (BD), and results were expressed as median fluorescence intensity (MFI), as relative MFI (rMFI) calculated as the MFI of the specific mAb divided by the MFI of the “fluorescence minus one” (FMO) control or as percentage of positive cells. For comparison of PBNK with TINK, we used rMFI because the FMO of the tumor samples was higher than the FMO of the blood samples (higher autofluorescence). Peripheral blood lymphoid cells (PBL) were defined as CD33−CD45+ cells; PBNK cells were defined as CD33−CD45+CD3−CD56+ cells; TIL were defined as CD34−CD45+ cells; TINK were defined as CD34−CD45+CD3−CD56+ cells; cells enriched in CSC were defined as CD105+CD44+ cells.
ELISA for soluble MICA
Soluble MICA (sMICA) in plasma of HD and ccRCC patients was assessed using the commercial DuoSet ELISA system (Biotechne, DIY1300) following the instructions provided by the manufacturer.
Degranulation and IFN-γ production by NK cells
PBMC or TIL were used to assess IFN-γ and degranulation by NK cells (defined as CD3−CD56+ cells) as previously described.Citation64,Citation65 To assess IFN-γ production, cells were stimulated with IL-12 (10 ng/ml), IL-15 (1 ng/ml) and IL-18 (10 ng/ml) for 18 h, monensin (2 µM) and brefeldin A (5 µg/ml) were added during the last 5 h of culture, and the frequency of IFN-γ-producing NK cells was assessed by FC. To assess degranulation, cells were cultured for 5 h with K562 cells at an E:T ratio of 1:1, in the presence of monensin (2 µM), brefeldin A (5 µg/ml) and BV421-labeled anti-CD107a mAb, and the frequency of CD107a+ NK cells was assessed by FC.
Glucose uptake assay
PBMC from HD and ccRCC patients as well as tumor cell suspensions enriched in tumor-infiltrating immune cells were cultured in the presence or in the absence of IL-12 (10 ng/ml), IL-15 (1 ng/ml) and IL-18 (10 ng/ml) for 18 h at 37°C in complete RPMI medium. After washing with saline solution, cells were cultured in RPMI without glucose for 1 h at 37°C (starvation), the fluorescent glucose analog 2-NBDG was added, cells were cultured for one additional hour, washed twice with cold saline solution, labeled with anti-CD45, anti-CD3 and anti-CD56 mAbs and analyzed by FC. The capacity of NK cells to incorporate glucose was determined as the glucose intake in the presence of stimuli divided the glucose intake in the absence of stimuli.
Statistical analysis
For the comparison of PBL from HD with PBL from ccRCC patients and for the comparison of PBNK from HD with PBNK from ccRCC patients, two-tailed or one-tailed unpaired t-test with Welch’s correction (when samples passed the normality test) or with Mann-Whitney’s correction (when samples did not pass the normality test) were used. For the comparison of PBL with TIL or PBNK with TINK both from ccRCC patients, two-tailed or one-tailed paired t-tests with Wilcoxon rank test were used. The D’Agostino & Pearson normality test was used to evaluate whether each experimental group follows a Gaussian distribution. For the comparison of CD105−CD44+ with CD105+CD44+ cells, a two-tailed paired t-test with Wilcoxon rank test was used. For correlation analysis, one-tailed or two-tailed paired Spearman correlation was applied. Unless indicated, two-tailed tests were used. One-tailed tests were used only to assess NK cell degranulation (), IFN-γ-producing NK cells () and TIM-3 expression ( A and b). A two-way ANOVA test with Sidak post-hoc test and Tukey post-hoc test were used for the analysis of the glucose uptake assay because three experimental groups were compared. Data were analyzed using GraphPad Prism 9 software.
Figure 1. MICA RNA is overexpressed in the 3 most frequent RCC types (ccRCC, PRCC and ChRCC). A) Expression of MICA expressed as FPKM (Fragments Per Kilobase Million) in different tumors. B) Relative expression to reference genes of MICA, ULBP1, ULBP3 and ULBP4 in human normal kidney (n = 32), ccRCC (n = 528), PRCC (n = 285) and ChRCC (n = 64). Data were obtained from The Human Protein Atlas (https://www.proteinatlas.org/).
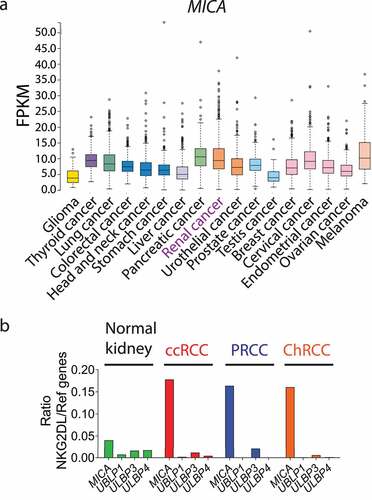
Figure 2. MICA is the most overexpressed NKG2DL on ccRCC tumor cells. A) Heatmap of expression of NKG2DLs on tumor cells from patients with ccRCC (n = 33), ChRCC (n = 6) and RO (n = 4). Blue (1) to red (4) represent increasing expression. The heatmap was built using the rMFI for each NKG2DL. B) Expression of MICA on tumor cells from patients with ccRCC (n = 33), ChRCC (n = 6) and RO (n = 4). C) Representative plots of side scatter (SSC-A) and MICA expression from two patients with high (ccRCC007) and average (ccRCC037) expression of MICA. Numbers within plots correspond to the MFI of MICA expression. Vertical lines in plots of panel C indicate the FMO. D) sMICA amounts detected in plasma of HD (n = 10) and ccRCC patients (n = 25) assessed by ELISA.
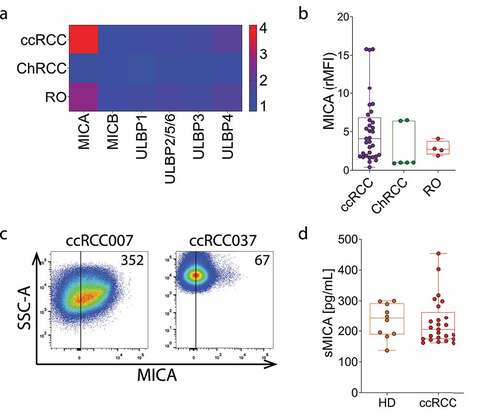
Figure 3. Expression of MICA, ULBP3/RAET1N and NKG2D are associated with decreased overall survival in ccRCC. Overall survival analysis (Kaplan-Meier) of data using the R2 Genomics Analysis and Visualization Platform (http://r2.amc.nl) according to high (blue) and low (red) expression of A) MICA, ULBP3/RAET1N and ULBP4/RAET1E, B) the NK cell activation receptors klrk1 (NKG2D), ncr1 (NKp46), DNAM-1 (CD226), ncr3 (NKp30), ncr2 (NKp44) and klrf1 (NKp80) and C) the NK cell inhibitory receptors klrc1 (NKG2A), TIGIT and lilrb1 (CD85j/ILT2). The analysis was performed on a database that contains 533 samples. The number of samples with high expression were 123 (MICA), 201 (ULBP3/RAET1N), 402 (ULBP4/RAET1E), 234 (klrk1), 353 (ncr1), 423 (DNAM-1), 398 (ncr3), 411 (ncr2), 346 (klrf1), 328 (klrc1), 283 (TIGIT) and 117 (lilrb1) while the number of samples with low expression were 410 (MICA), 332 (ULBP3/RAET1N), 131 (ULBP4/RAET1E), 299 (klrk1), 180 (ncr1), 110 (DNAM-1), 135 (ncr3), 122 (ncr2), 187 (klrf1), 205 (klrc1), 250 (TIGIT) and 416 (lilrb1). Log-rank Mantel–Cox test was applied.
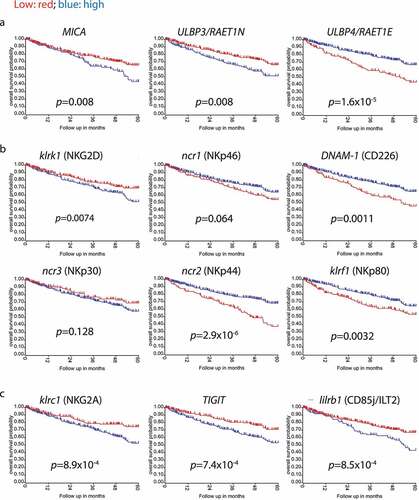
Figure 4. MICA, ULBP3 and ULBP4 are overexpressed on TIL from ccRCC patients. A) Expression of MICA on TIL vs PBL from ccRCC patients (n = 32, left), and on PBL from ccRCC patients (n = 31) and HD (n = 32, right). B) Representative plots of SSC-A and MICA expression from two patients with high (ccRCC007) and average (ccRCC037) expression of MICA. Numbers within plots correspond to the MFI of MICA expression. C) Expression of ULBP3 on TIL vs PBL from ccRCC patients (n = 32, left) and on PBL from ccRCC patients (n = 32) and HD (n = 32, right). D) Representative plots of SSC-A and ULBP3 expression from two patients with high (ccRCC005) and average (ccRCC034) expression of ULBP3. Numbers within plots correspond to the MFI of ULBP3 expression. E) Expression of ULBP4 on TIL vs PBL from ccRCC patients (n = 28, left) and on PBL from ccRCC patients (n = 29) and HD (n = 29, right). F) Representative plots of SSC-A and ULBP4 expression from two patients with high (ccRCC034) and average (ccRCC009) expression of ULBP4. Numbers within plots correspond to the MFI of ULBP4 expression. G) Heatmap of the expression of NKG2DLs on TINK, TICD4+ and TICD8+ from patients with ccRCC (n = 5). Blue (2) to red (10) represent increasing expression. The heatmap was built using the rMFI for each NKG2DL. H) Representative plots of CD4, CD8 and CD56 expression vs MICA expression in one patient with average expression of MICA (ccRCC008). Numbers within plots correspond to the MFI of MICA expression. I) Correlation analysis between the expression of MICA on TIL and on tumor cells in patients with ccRCC (n = 33). Vertical lines in plots of panels B, D, F and H indicate the FMO. t-test with Wilcoxon rank test was applied in left graphs of panels A, C and E. t-test with Mann-Whitney´s correction was applied in right graphs of panels A, C and E. Correlation analysis for non-parametric data (Spearman correlation) was applied in I. ****, p < .0001.
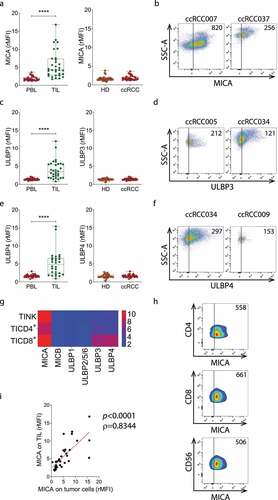
Figure 5. CSC coexpress MICA and NKG2D. A) Frequency of MICA+NKG2D+ in CD105−CD44+ and CD105+CD44+ cells from ccRCC patients (n = 6). Each dot represents the data from one patient. B) Representative plots of expression of NKG2D and MICA on CD105−CD44+ and CD105+CD44+ cells from one representative ccRCC patient. Numbers within plots correspond to the percentage of cells within each region (MICA+NKG2D+ and MICA−NKG2D−). C) Intensity of expression (MFI) of MICA (green, left y axis) and of NKG2D (Orange, right y axis) in CD105−CD44+ and CD105+CD44+ cells from each patient analyzed. D) Correlation analysis between the expression of NKG2D and MICA on CD105+CD44+MICA+NKG2D+ cells in the 6 ccRCC patients analyzed. t-test with Wilcoxon rank test was applied in A. Correlation analysis for non-parametric data (Spearman correlation) was applied in D. *, p < .05.
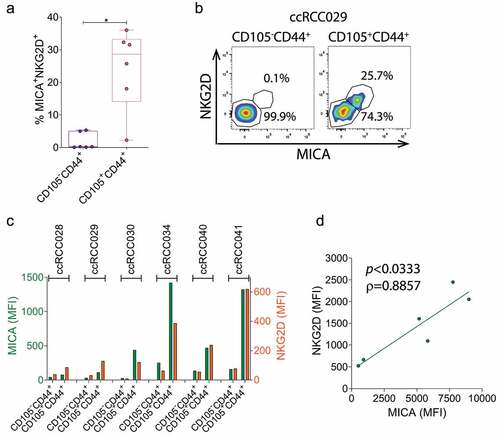
Figure 6. NKG2D is downregulated on PBNK but is upregulated on TINK in ccRCC patients, and these TINK are dysfunctional. A) Expression of NKG2D assessed as frequency of NKG2D+ cells (left) or rMFI (right) on PBNK from HD (n = 29) and ccRCC patients (n = 28). B) Expression of NKG2D assessed as frequency of NKG2D+ cells (n = 24, left) or rMFI (n = 25, right) on PBNK and TINK from ccRCC patients. C) Representative plots of NKG2D and CD56 expression on PBNK from one HD with average NKG2D expression, one ccRCC patient with average NKG2D expression (ccRCC016) and one ccRCC patient with low NKG2D expression (ccRCC028), and on TINK from one ccRCC patient with high NKG2D expression (ccRCC043) and one ccRCC patient with average NKG2D expression (ccRCC021). Numbers within plots correspond to the MFI of NKG2D expression. D) Degranulation, assessed as percentage of CD107a+ cells after stimulation with K562 cells, of PBNK from HD and ccRCC patients (n = 7, left) and of PBNK and TINK from ccRCC patients (n = 6, right). E) Representative plots of CD107a and CD56 expression in PBNK from one HD with average degranulation, in PBNK from one ccRCC patient with average degranulation (ccRCC016) and in TINK from one ccRCC patient with average degranulation (ccRCC021). Numbers within plots correspond to the percentage of CD107a+ NK cells. F) Frequency of IFN-γ+ cells after stimulation with cytokines in PBNK from HD and ccRCC patients (n = 8, left) and in PBNK and TINK from ccRCC patients (n = 6, right). G) Representative plots of IFN-γ and CD56 expression in PBNK from one HD with average IFN-γ production, in PBNK from one ccRCC patient with average IFN-γ production (ccRCC021) and in TINK from one ccRCC patient with average IFN-γ production (ccRCC021). Numbers within plots correspond to the percentage of IFN-γ+ NK cells. H) Correlation analysis between degranulation (frequency of CD107a+ cells) and NKG2D expression in PBNK (n = 6, left) or TINK (n = 5, right) from ccRCC patients. Horizontal lines in plots of panels C, E and G indicate the FMO. t-test with Mann-Whitney´s correction was applied in left graph of panel A. t-test with Welch´s correction was applied in right graph of panel A. t-test with Wilcoxon rank test was applied in panel B. One-tailed t-test with Mann-Whitney´s correction was applied in left graph of panel D. One-tailed t-test with Wilcoxon rank test was applied in right graph of panel D. One-tailed t-test with Welch´s correction was applied in left graph of panel F. t-test with Wilcoxon rank test was applied in right graph of panel F. Correlation analysis for non-parametric data (Spearman correlation) was applied in H. *, p < .05; ***, p < .001.
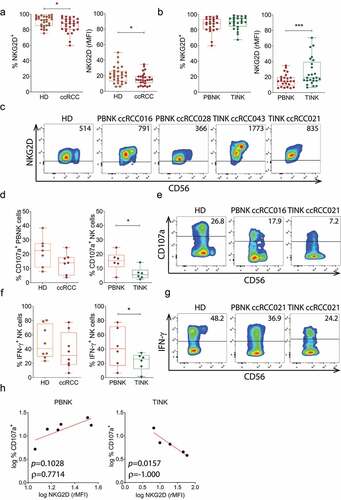
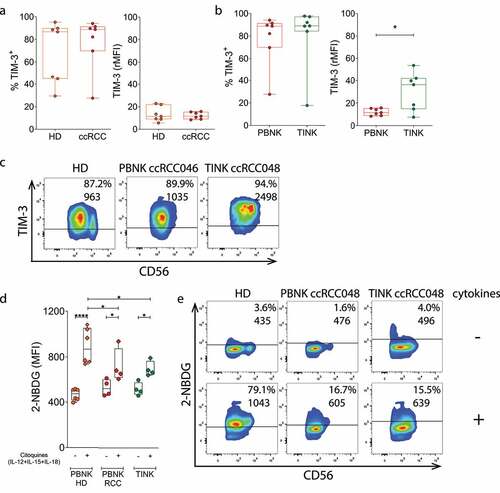
Figure 7. TINK display an exhausted phenotype and metabolic abnormalities. A) Expression of the exhaustion-associated marker TIM-3 assessed as frequency of TIM-3+ cells (left) or rMFI (right) in PBNK from HD (n = 7) and ccRCC patients (n = 7). B) Expression of TIM-3 assessed as frequency of TIM-3+ cells (n = 7, left) or rMFI (n = 7, right) in PBNK and TINK from ccRCC patients. C) Representative plots of TIM-3 and CD56 expression on PBNK from one HD with average TIM-3 expression, on PBNK from one ccRCC patient with average TIM-3 expression (ccRCC046) and on TINK from one ccRCC patient with average TIM-3 expression (ccRCC048). Numbers within plots correspond to the percentage of TIM-3+ NK cells (upper line) and MFI of TIM-3 (lower line). D) Glucose uptake assessed as intensity of fluorescence produced by 2-NBDG in PBNK from HD (n = 6), and in PBNK and in TINK from ccRCC patients (n = 4) before (-) and after (+) stimulation with cytokines (IL-12, IL-15 and IL-18). E) Representative plots of 2-NBDG fluorescence and CD56 expression in PBNK from one HD, in PBNK from one ccRCC patient (ccRCC048) and in TINK from one ccRCC patient (ccRCC048). Numbers within plots correspond to the percentage of 2-NBGD+ NK cells (upper line) and MFI of 2-NBDG (lower line). Horizontal lines in plots of panels C and E indicate the FMO. One-tailed t-test with Mann-Whitney´s correction was applied in panel A. One-tailed t-test with Wilcoxon rank test was applied in panel B. Two-way ANOVA with Sidak post hoc was applied in D to compare 2-NBDG uptake of NK cells in the absence vs in the presence of cytokines. Two-way ANOVA with Tukey post hoc was applied in D to compare 2-NBDG uptake of PBNK from HD with PBNK from ccRCC patients and with TINK stimulated with cytokines. *, p < .05; **, p < .01.
Results
MICA is markedly upregulated in ccRCC, PRCC and ChRCC but barely expressed in human normal kidney
An analysis of the abundance of MICA RNA across different tumors performed at the Human Protein Atlas (https://www.proteinatlas.org/) revealed that RCC is among the tumor types that exhibited higher expression of MICA (). We also compared the expression of MICA, ULBP1/RAET1I, ULBP3/RAET1N and ULBP4/RAET1E in normal kidneys (n = 32) and in the three most frequent RCC (n = 877), namely ccRCC (n = 528), PRCC (n = 285) and ChRCC (n = 64). As the database provides the expression of NKG2DLs in normal kidney in TPM while for RCC the expression is presented in FPKM, we normalized the expression of NKG2DLs in each sample using a panel of reference genes suitable for the comparison of human kidney samples (PGAM1, NOP10, FIS1, GANAB, NDUFB11, HEBP1 and HDGF). We found that MICA was the only NKG2DL that exhibited a marked upregulation in the 3 RCC types, compared to normal kidneys (). Accordingly, the ratio between tumor and normal tissue indicated that MICA exhibited an upregulation of 4 times in ccRCC, PRCC and ChRCC.
Bioinformatic analyses based on data deposited in the TCGA have the limitation of being based on the expression of RNA, which does not account for post-translational modifications that may affect the expression or cellular localization of proteins. Therefore, to achieve a deeper understanding of the NKG2D-NKG2DL axis in the context of ccRCC, we analyzed their expression in cell suspensions obtained from partial or radical nephrectomies of patients with RCC using a multicolor FC panel designed to gate on tumor cells, TIL, tumor-infiltrating CD4+ T cells, tumor-infiltrating CD8+ T cells and TINK (Figure S1). A heatmap analysis of the rMFI for each NKG2DL in 33 ccRCC, 6 ChRCC and 4 RO samples demonstrated that MICA was the only NKG2DL overexpressed mainly on ccRCC tumor cell surface (). Moreover, higher expression of MICA was observed in ccRCC compared to ChRCC and RO ( b and c), although the differences were not statistically significant. In addition, we assessed the amount of sMICA in plasma of HD and ccRCC patients but, comparatively, we observed that only a few ccRCC patients presented increased amounts of sMICA (). Therefore, considering the low frequency of ChRCC and RO samples, we focused the rest of our work on ccRCC samples.
Higher expression of MICA, ULBP3/RAET1N and klrk1 (NKG2D) are associated with lower overall survival in ccRCC
As several tumor immune escape mechanisms impact on TINK and may involve the NKG2D-NKG2DL axis, we analyzed how the expression of NKG2DLs and several NK cell receptors affect the overall survival in ccRCC using the R2 Genomics Analysis and Visualization Platform (http://r2.amc.nl). Higher expression of MICA and ULBP3/RAET1N were associated with a worsened overall survival, while higher expression of ULBP4/RAET1E was associated with improved overall survival (). The analysis of several NK cell activating receptors revealed that klrk1 (NKG2D) was the only one whose increased expression was associated with reduced overall survival, while expression of DNAM-1, ncr2 (NKp44) and klrf1 (NKp80) were associated with improved overall survival and expression of ncr1 (NKp46) and ncr3 (NKp30) did not affect survival (). Moreover, higher expression of major NK cell inhibitory receptors such as klrc1 (NKG2A), TIGIT and lilrb1 (CD85j/ILT2) were also associated with an impaired overall survival (). Therefore, although most NK cell activation and inhibitory receptors affect survival as expected according to their functions and current paradigms, NKG2D and two of its known NKG2DLs (MICA and ULBP3/RAET1N) behaved in a contrasting manner and could therefore be involved in events that wane antitumor immunity and contribute to tumor progression.
MICA is also expressed on TIL and on CSC which also co-express NKG2D
An analysis of the expression of NKG2DLs on lymphoid cells revealed that TIL, but not PBL from either ccRCC patients or HD, expressed MICA ( A and b), ULBP3 ( C and d) and ULBP4 ( E and f), suggesting that the TME promotes NKG2DL expression on TIL. To address which lymphoid cell subset expresses these NKG2DLs, we evaluated MICA, ULBP3 and ULBP4 expression on tumor infiltrating CD4+ T cells (TICD4+), CD8+ T cells (TICD8+) and TINK cells. We observed that MICA was mostly expressed on TINK, TICD4+ and TICD8+ T cells, while ULBP3 and ULBP4 expression was mostly observed in TICD8+ cells ( g and h). In addition, we observed the existence of a robust correlation between the expression of MICA on TIL and tumor cells ().
Expression of NKG2DLs together with aberrant coexpression of NKG2D on tumor cells has been associated with oncogenic stimulation, tumor initiation and cell growth in ovarian cancer. Therefore, we analyzed the expression of NKG2D on ccRCC tumor cells staining also for the CSC-associated markers CD105 and CD44 to gate on CD105−CD44+ and CD105+CD44+ cells. We observed that a small fraction of tumor cells coexpressed NKG2D and MICA, and that these MICA+NKG2D+ cells were particularly enriched in the CD105+CD44+ cell population compared to the CD105−CD44+ cell population (). Moreover, we observed a positive correlation between the intensity of expression of NKG2D and MICA in the CD105+CD44+MICA+NKG2D+ cell population ().
PBNK and TINK display opposite altered expression of NKG2D, and only TINK exhibit suppressed effector functions
Data presented in indicate that a higher expression of klrk1 (NKG2D) is associated with impaired overall survival in ccRCC. Therefore, we investigated the expression of NKG2D on NK cells and their effector function in PBNK and TINK (). Although ccRCC patients did not exhibit altered frequencies of PBNK (not shown), PBNK from ccRCC patients exhibited a slight but significantly reduced frequency of NKG2D+ cells and down-regulation of NKG2D when compared to HD but TINK exhibited a significantly upregulated expression of NKG2D when compared to PBNK (). These results indicate that the different mechanisms of immunosuppression operating in periphery and within the TME have contrasting consequences on the expression of NKG2D on PBNK and TINK.
To explore whether the aberrant TINK phenotype characterized by an upregulated expression of NKG2D with concomitant expression of NKG2DLs is accompanied by functional abnormalities, we analyzed their degranulation in response to stimulation with K562 cells, and their production of IFN-γ in response to stimulation with IL-12, IL-15 and IL-18. Although PBNK from ccRCC patients exhibited similar degranulation than PBNK from HD, TINK exhibited a significantly impaired degranulation ability (). Moreover, PBNK from ccRCC patients exhibited similar frequency of IFN-γ-producing cells than PBNK from HD, but TINK exhibited a significantly reduced frequency of IFN-γ-producing cells (). In addition, degranulation in response to K562 cells exhibited a trend toward a positive correlation with NKG2D expression in PBNK but a significant negative correlation with NKG2D expression in TINK from ccRCC patients (). Therefore, TINK are dysfunctional in ccRCC patients and NKG2D might be involved in this dysfunctionality.
Dysfunctional TINK in ccRCC exhibit features of exhausted cells and metabolic abnormalities.
As impaired effector function is one of the characteristics of NK cell exhaustion, we explored the expression of the exhaustion-associated marker TIM-3 on PBNK from HD and on PBNK and TINK from ccRCC patients. Similar frequencies of TIM-3+ NK cells were observed in the three NK cell compartments and the amount of TIM-3 expressed on PBNK did not differ between HD and ccRCC patients. However, TINK exhibited a significant upregulated expression of TIM-3 (). No differences in the frequency and expression of PD-1 were observed between PBNK from HD and ccRCC patients or between PBNK and TINK from ccRCC patients (not shown).
To assess whether these dysfunctional NK cells with signs of exhaustion also display an altered metabolic activity, we explored their glucose uptake ability in response to stimulation with IL-12, IL-15 and IL-18 using the fluorescent glucose analogue 2-NBDG. We observed that PBNK from HD, PBNK from ccRCC patients and TINK significantly increased their glucose uptake in response to the cytokines. However, PBNK and TINK from ccRCC patients exhibited a markedly impaired glucose uptake in response to the cytokines when compared to PBNK from HD (). These results indicate that PBNK and TINK from ccRCC patients exhibit metabolic abnormalities that impact on their ability to respond to activation stimuli such as cytokines.
Discussion
Previous analyses of RNAseq data indicate that MICA is the NKG2DL that exhibits the highest expression in malignancies of the lung, colorectal, stomach, liver and breast, and that it exhibits a very low mutational burden.Citation48 MICA can either promote tumor cell elimination when expressed on the tumor cell surface (immunosurveillance) or facilitate immune escape when shed by tumor cells.Citation45 This suppressive activity can be due to a down-modulation and degradation of NKG2D on NK cellsCitation38,Citation39 or by the blockade of NKG2D induced after binding soluble MICA.Citation50 However, it remains unknown which of these opposing functions of MICA prevails in each cancer type. Nonetheless, this dual function positions MICA as an attractive target for the development of immuno-oncology therapeutic strategies. Abs that target MICA/B may promote NK cell-mediated ADCC and Ab-dependent cell phagocytosis (ADCP) by macrophages against tumors that express MICA, fostering tumor cell elimination (immunosurveillance). Also, these Abs may form immune complexes with shed (soluble) MICA that in turn would be cleared by macrophages, consequently interfering with the tumor immune escape mechanisms mediated by soluble MICA. This has opened the interest in the development of therapeutic anti-MICA Abs. However, to mitigate risks and increase the chances of success of such approaches, cell surface expression of the target protein should be unambiguously established on primary, freshly isolated tumor cells. Although there are some reports about the expression of MICA on the cell surface in leukemias,Citation32 multiple myeloma cells,Citation66–68 blasts of Sezary patientsCitation69 and gastric tumor cells,Citation70 most studies with solid tumors were performed by immunohistochemistry.Citation29,Citation30,Citation37,Citation71 In this work, as a critical path toward the identification and validation of novel targets in immuno-oncology, we conducted a thorough analysis of the expression of different NKG2DLs in RCC. A bioinformatic analysis of RNAseq data demonstrated that MICA was markedly overexpressed in the three most frequent RCC types (ccRCC, PRCC and ChRCC) compared to normal kidneys. However, this upregulated expression of MICA (and of ULBP3/RAET1N) was associated with impaired overall survival in ccRCC, likely indicating that tumor immune escape mechanisms that involve MICA (and ULBP3/RAET1N) might be overriding their role in immunosurveillance. Also, klrk1 (NKG2D) was the only activating receptor analyzed whose increased expression was associated with impaired overall survival. These results suggest that the NKG2D-NKG2DL axis in ccRCC might be involved in tumor promoting mechanisms as has been reported in inflammation-driven hepatocellular carcinoma,Citation72 and that might contribute to a diminished survival of patients.
This analysis was based on RNAseq datasets from 533 whole ccRCC samples that include RNA from tumor cells and cells from the TME. Accordingly, it does not consider the occurrence of post-translational modifications that may affect the expression and/or the cellular localization of proteins. Therefore, conclusions should be interpreted with caution. Consequently, we analyzed the expression of NKG2DLs in cell suspensions obtained from partial or radical nephrectomies of patients with RCC using multicolor FC. In line with the bioinformatic analyses, we observed that MICA was the only NKG2DL overexpressed mainly on ccRCC tumor cells. Moreover, only a few ccRCC patients presented increased amounts of sMICA in plasma, suggesting that shedding of this NKG2DL by ccRCC tumors is not a major tumor evasion mechanism. Also, TIL but not PBL from paired patients, expressed MICA, ULBP3 and ULBP4 on their cell surface, suggesting that local mechanisms operating in the TME might trigger NKG2DL expression on TIL. Expression of MICA was detected mostly on TINK, TICD4+ and TICD8+ T cells, and it correlated with the expression of MICA on tumor cells. Whether expression of MICA on TIL arises as a result of activation of lymphoid cellsCitation73,Citation74 or is an acquisition by trogocytosis, a phenomenon that can involve MICA,Citation75 is still unclear. However, for ULBP3 and ULBP4, we can speculate that TIL synthesize these NKG2DLs as we have not observed their expression on tumor cells.
Recurrence is a major problem in patients with ccRCC, and it has been suggested that CSCs that are resistant to conventional treatment modalities actively participate in this phenomenon due to their tumor-initiating capacity.Citation76 In RCC, a fraction of tumor cells that express CD105 and the adhesion molecule CD44 are enriched in CSC that exhibit enhanced tumorigenicity, clonogenic ability, expression of stem cell markers and other features.Citation60 As coexpression of NKG2DLs and NKG2D on tumor cells has been associated with oncogenic stimulation, tumor initiation and cell growth,Citation77,Citation78 we explored if CD105+CD44+ cells in ccRCC were enriched in MICA+NKG2D+ cells. Our results demonstrated that indeed, a subset of CD105+CD44+, but not CD105−CD44+ bulk tumor cells, were significantly enriched in MICA+NKG2D+ cells, with a linear correlation between the expression of NKG2D and MICA in the CD105+CD44+MICA+NKG2D+ cell population. Therefore, it is likely that the tumor-initiating cells that constitute a fraction of the CD105+CD44+ cells are MICA+NKG2D+ cells that, in virtue of a cis and/or trans engagement of NKG2D by MICA, might sustain their oncogenic potential.Citation77,Citation78 These results are in contrast with what was observed in acute myelogenous leukemia (AML), where NKG2DLs were detected on bulk AML cells but not on leukemia stem cells (LSC), endowing LSC with resistance to NK cell-mediated killing.Citation79 Similar results were obtained in breast cancer with MICA expression.Citation80 Nevertheless, our results suggest that, at least in ccRCC, targeting MICA with Abs might eliminate bulk tumor cells and CSCs, which might result in a reduction of recurrence.
Paradoxically, we also observed that higher expression of klrk1 (NKG2D) was associated with impaired overall survival in ccRCC, in spite of previous reports that indicate that NKG2DLs shed by tumors promote either downregulation or blockade of NKG2D.Citation32,Citation37,Citation50,Citation69 We observed that indeed, PBNK from ccRCC patients expressed less NKG2D than PBNK from HD, a fact that might be due to the presence of soluble MICA in blood.Citation38,Citation39,Citation81 Conversely, TINK expressed increased amounts of NKG2D compared to PBNK from paired patients. The unusual TINK phenotype characterized by an upregulated expression of NKG2D with concomitant expression of MICA was accompanied by an impaired degranulation ability and a reduced IFN-γ production. Furthermore, such impaired degranulation in response to K562 cells (that express NKG2DLs) negatively correlated with NKG2D expression in TINK from ccRCC patients. Others have also observed that TINK from ccRCC patients display impaired degranulationCitation82,Citation83 and cytokine production,Citation83 but the underlying mechanisms remain elusive. We think that chronic stimulation of TINK through NKG2D by MICA expressed within the TME might drive NK cells progressively into a dysfunctional state and that, to sustain the ability of NK cells to sense tumor cells that express MICA, they may respond upregulating NKG2D expression. Interestingly, sustained stimulation of NK cells generates exhausted NK cells that initially display reduced expression of NKG2D but that recover NKG2D expression over time.Citation14 Therefore, we conclude that the apparent paradoxical expression of NKG2D on NK cells from ccRCC patients (downregulated expression on PBNK vs. upregulated expression on TINK) indicates that soluble MICA might constitute the dominant effect that provokes downregulation of NKG2D on PBNK, while the chronic stimulation of TINK in the TME by MICA expressed on the cell surface of the tumor cells can override the effects of soluble MICA on NKG2D expression. A preferential recognition of cell surface vs. soluble MICA by NKG2D might be the result of a functional affinity (avidity) of NKG2D for MICA when this ligand is displayed in a two-dimensional space such as the tumor cell membrane compared to the soluble form of the same ligand.
The dysfunctional TINK detected in this study also display an activated phenotype skewed toward inhibition and characterized by a reduced expression of activation receptors such as CD16, DNAM-1, NKp30, NKp46 and NKp80, with increased expression of inhibitory receptors such as CD85j and PD-1, as we observed in a previous study.Citation59 Increased expression of TIM-3 detected in the current study also indicates that these TINK exhibited features of exhausted NK cells, probably because of different mechanisms that operate in periphery and within the TME. Exhaustion in NK cells has been associated with decreased expression of several activating receptors and upregulation of inhibitory receptors such as NKG2A, PD-1, TIM-3, CD96 and TIGIT,Citation10–13,Citation15,Citation16 but in our study we only could assess TIM-3 due to the limited amount of samples. However, NK cells from patients with metastatic melanoma, esophageal cancer and hepatitis B virus‑related hepatocellular carcinoma also have been shown to be dysfunctional and exhibit increased TIM-3 expression, which was associated with tumor progression and poor prognosis.Citation11,Citation84,Citation85 Moreover, as mAb-mediated TIM-3 blockade reinvigorated these NK cells,Citation11 TIM-3, together with NKG2A.Citation86 may represent a major NK-cell exhaustion marker. Moreover, exhausted NK cells with reduced expression of activating receptors, upregulated expression of inhibitory receptors including TIM-3, impaired effector functions and metabolic defects that resulted in a decreased in vivo persistence, function and tumor control can emerge after prolonged stimulation through NKp46 and NKG2D.Citation14 Therefore, our findings suggest that the dysfunctional TINK with increased TIM-3 expression and an impaired glucose uptake ability in response to stimulation with IL-12, IL-15 and IL-18 in ccRCC likely emerge because of chronic stimulation. Glucose uptake was assessed using the fluorescent glucose analog 2-NBDG because it represents a valuable tool to assess such parameter in complex cell suspensions by FC. However, our data should be interpreted with caution due to some discrepancies in the 2-NBDG uptake assays reported in mouse T cells.Citation87 Nonetheless, our data obtained with human NK cells indicate that, in accordance with the features of exhausted cells, TINK from ccRCC patients exhibit an altered metabolic fitness when confronted to prototypical stimuli, which probably weakens their crucial anti-tumor effector functions.
In summary, our results indicate that MICA represents an attractive target for immuno-oncology aimed at eliminating tumor cells in ccRCC. Targeting MICA with mAbs,Citation43,Citation44,Citation50–52,Citation88 with vaccine-induced AbsCitation48,Citation49 or with pan-specific engineered CAR-NK or CAR-T cellsCitation89–91 might also contribute to the elimination of CSC, likely reducing the risk of recurrence and metastasis, and of dysfunctional TINK, making space for the infiltration of the tumor by a new wave of fully functional NK cells that would create a new TME and contribute to the therapeutic effect. Therefore, our results based on studies performed on ccRCC, integrated with previous results,Citation43,Citation44,Citation48,Citation50–52,Citation88,Citation92 validate MICA as novel target in immuno-oncology and open new venues for the development of targeted therapies against NKG2DLs in these patients that might also be applicable to other malignancies.
List of abbreviations
| Ab | = | antibody |
| ADCC | = | Ab-dependent cell-mediated cytotoxicity |
| ADCP | = | Ab-dependent cell phagocytosis |
| AML | = | acute myelogenous leukemia |
| ccRCC | = | clear cell renal cell carcinoma |
| ChRCC | = | chromophobe renal cell carcinoma |
| CSC | = | cancer stem cells |
| CTL | = | cytotoxic T lymphocytes |
| CYTOF | = | cytometry-time-of-flight |
| FC | = | flow cytometry |
| FMO | = | fluorescence minus one |
| FPKM | = | Fragments Per Kilobase Million |
| HD | = | healthy donor |
| ICI | = | immune checkpoint inhibitors |
| LSC | = | leukemia stem cells |
| mAb | = | monoclonal antibody |
| MFI | = | median fluorescence intensity |
| NK | = | natural killer |
| NKG2DLs | = | NKG2D ligands |
| PBL | = | peripheral blood lymphoid cells |
| PBMC | = | peripheral blood mononuclear cells |
| PBNK | = | peripheral blood NK cells |
| PRCC | = | papillary renal cell carcinoma |
| RCC | = | renal cell carcinoma |
| rMFI | = | relative MFI |
| RO | = | renal oncocytoma |
| sMICA | = | soluble MICA |
| TCGA | = | The Cancer Genome Atlas |
| TICD4+ | = | tumor infiltrating CD4+ T cells |
| TICD8+ | = | tumor infiltrating CD8+ T cells |
| TIL | = | tumor-infiltrating leukocytes |
| TINK | = | tumor-infiltrating NK cells |
| TME | = | tumor microenvironment |
| TPM | = | Transcripts Per Million. |
Authors’ contributions
F.S. performed and designed most of the experiments and analyzed the data. S.Y.N., J.M.S., A.Z., M.V.R. X.L.R.I., A.T. and A.D.F. contributed experimentally to the data presented in some figures. A.R., C.A., F.P.S., N.R., H.R.P, G.V., L.R., M.M., F.F., N.B. and L.B. provided the nephrectomies and the data of the patients. M.B.F. and C.I.D. contributed to the design of the study. C.I.D. also processed and analyzed the experimental data obtained in the lab. N.W.Z. conceived, designed and supervised the study and wrote the manuscript. All the authors reviewed and approved the manuscript.
Supplemental Material
Download Zip (1.4 MB)Acknowledgments
This work was funded with grants from the National Agency for Promotion of Science and Technology from Argentina (ANPCYT), the National Research Council of Argentina (CONICET) and the Trust in Science Program from GlaxoSmithKline (GSK), all to NWZ. The funders were not involved in the study design, collection, analysis, interpretation of data, the writing of this article or the decision to submit it for publication. All authors declare no other competing interests. We also thank to Fundación Williams and Fundación René Barón for providing financial assistance (donations) to our laboratory.
Disclosure statement
The authors declare that they have no competing interests.
Data availability statement
The datasets analyzed during the current study are available in The Human Protein Atlas (https://www.proteinatlas.org/) and in the R2 Genomics Analysis and Visualization Platform (http://r2.amc.nl) repositories.
Supplementary material
Supplemental data for this article can be accessed online at https://doi.org/10.1080/2162402X.2022.2104991
Additional information
Funding
References
- Cantoni C, Wurzer H, Thomas C, Vitale M. Escape of tumor cells from the NK cell cytotoxic activity. J Leukoc Biol. 2020;108(4):1339–17. doi:10.1002/JLB.2MR0820-652R.
- Cursons J, Souza-Fonseca-Guimaraes F, Foroutan M, Anderson A, Hollande F, Hediyeh-Zadeh S, Behren A, Huntington ND, Davis MJ. A gene signature predicting natural killer cell infiltration and improved survival in melanoma patients. Cancer Immunol Res. 2019;7(7):1162–1174. doi:10.1158/2326-6066.CIR-18-0500.
- Lee H, Quek C, Silva I, Tasker A, Batten M, Rizos H, Lim SY, Nur Gide T, Shang P, Attrill GH, et al. Integrated molecular and immunophenotypic analysis of NK cells in anti-PD-1 treated metastatic melanoma patients. Oncoimmunology. 2019;8(2):e1537581. doi:10.1080/2162402X.2018.1537581.
- Cózar B, Greppi M, Carpentier S, Narni-Mancinelli E, Chiossone L, Vivier E. Tumor-infiltrating natural killer cells. Cancer Discov. 2021;11(1):34–44. doi:10.1158/2159-8290.CD-20-0655.
- Hodgins JJ, Khan ST, Park MM, Auer RC, Ardolino M. Killers 2.0: NK cell therapies at the forefront of cancer control. J Clin Invest. 2019;129(9):3499–3510. doi:10.1172/JCI129338.
- Myers JA, Miller JS. Exploring the NK cell platform for cancer immunotherapy. Nat Rev Clin Oncol. 2021;18(2):85–100. doi:10.1038/s41571-020-0426-7.
- Guillerey C, Huntington ND, Smyth MJ. Targeting natural killer cells in cancer immunotherapy. Nat Immunol. 2016;17(9):1025–1036. doi:10.1038/ni.3518.
- Parkhurst MR, Riley JP, Dudley ME, Rosenberg SA. Adoptive transfer of autologous natural killer cells leads to high levels of circulating natural killer cells but does not mediate tumor regression. Clin Cancer Res. 2011;17(19):6287–6297. doi:10.1158/1078-0432.CCR-11-1347.
- Merino AM, Kim H, Miller JS, Cichocki F. Unraveling exhaustion in adaptive and conventional NK cells. J Leukoc Biol. 2020;108(4):1361–1368. doi:10.1002/JLB.4MR0620-091R.
- Bi J, Tian Z. NK cell exhaustion. Front Immunol. 2017;8:760. doi:10.3389/fimmu.2017.00760.
- da Silva IP, Gallois A, Jimenez-Baranda S, Khan S, Anderson AC, Kuchroo VK, Osman I, Bhardwaj N. Reversal of NK-cell exhaustion in advanced melanoma by Tim-3 blockade. Cancer Immunol Res. 2014;2(5):410–422. doi:10.1158/2326-6066.CIR-13-0171.
- Zhang C, Liu Y. Targeting NK cell checkpoint receptors or molecules for cancer immunotherapy. Front Immunol. 2020;11:1295. doi:10.3389/fimmu.2020.01295.
- Sun C, Xu J, Huang Q, Huang M, Wen H, Zhang C, Wang J, Song J, Zheng M, Sun H, et al. High NKG2A expression contributes to NK cell exhaustion and predicts a poor prognosis of patients with liver cancer. Oncoimmunology. 2017;6(1):e1264562. doi:10.1080/2162402X.2016.1264562.
- Myers JA, Schirm D, Bendzick L, Hopps R, Selleck C, Hinderlie P, Felices M, Miller JS. Balanced engagement of activating and inhibitory receptors mitigates human NK cell exhaustion. JCI Insight. 2022 Jun;21:e150079. doi:10.1172/jci.insight.150079.
- Sun H, Huang Q, Huang M, Wen H, Lin R, Zheng M, Qu K, Li K, Wei H, Xiao W, et al. Human CD96 correlates to natural killer cell exhaustion and predicts the prognosis of human hepatocellular carcinoma. Hepatology. 2019;70(1):168–183. doi:10.1002/hep.30347.
- Annese T, Tamma R, Ribatti D. Update in TIGIT Immune-Checkpoint Role in Cancer. Front Oncol. 2022;12:871085. doi:10.3389/fonc.2022.871085.
- Schnell A, Bod L, Madi A, Kuchroo VK. The yin and yang of co-inhibitory receptors: toward anti-tumor immunity without autoimmunity. Cell Res. 2020;30(4):285–299. doi:10.1038/s41422-020-0277-x.
- Souza-Fonseca-Guimaraes F, Cursons J, Huntington ND. The emergence of natural killer cells as a major target in cancer immunotherapy. Trends Immunol. 2019;40(2):142–158. doi:10.1016/j.it.2018.12.003.
- Vivier E, Tomasello E, Baratin M, Walzer T, Ugolini S. Functions of natural killer cells. Nat Immunol. 2008;9(5):503–510. doi:10.1038/ni1582.
- Kruse PH, Matta J, Ugolini S, Vivier E. Natural cytotoxicity receptors and their ligands. Immunol Cell Biol. 2014;92(3):221–229. doi:10.1038/icb.2013.98.
- Lanier LL. NKG2D receptor and its ligands in host defense. Cancer Immunol Res. 2015;3(6):575–582. doi:10.1158/2326-6066.CIR-15-0098.
- Wensveen FM, Jelencic V, Polic B. NKG2D: a master regulator of immune cell responsiveness. Front Immunol. 2018;9:441. doi:10.3389/fimmu.2018.00441.
- Smyth MJ, Swann J, Cretney E, Zerafa N, Yokoyama WM, Hayakawa Y. NKG2D function protects the host from tumor initiation. J Exp Med. 2005;202(5):583–588. doi:10.1084/jem.20050994.
- Guerra N, Tan YX, Joncker NT, Choy A, Gallardo F, Xiong N, Knoblaugh S, Cado D, Greenberg NM, Raulet DH. NKG2D-deficient mice are defective in tumor surveillance in models of spontaneous malignancy. Immunity. 2008;28(4):571–580. doi:10.1016/j.immuni.2008.02.016.
- Fernández-Messina L, Reyburn H, Vales-Gomez M. Human NKG2D-ligands: cell biology strategies to ensure immune recognition. Front Immunol. 2012;3:299. doi:10.3389/fimmu.2012.00299.
- Zhang J, Basher F, Wu JD. NKG2D ligands in tumor immunity: two sides of a coin. Front Immunol. 2015;6:97. doi:10.3389/fimmu.2015.00097.
- Schmiedel D, Mandelboim O. NKG2D ligands-critical targets for cancer immune escape and therapy. Front Immunol. 2018;9:2040. doi:10.3389/fimmu.2018.02040.
- Schrambach S, Ardizzone M, Leymarie V, Sibilia J, Bahram S. In vivo expression pattern of MICA and MICB and its relevance to auto-immunity and cancer. PLoS One. 2007;2(6):e518. doi:10.1371/journal.pone.0000518.
- Zhang X, Yan L, Jiao W, Ren J, Xing N, Zhang Y, Zang Y, Wang J, Xu Z. The clinical and biological significance of MICA in clear cell renal cell carcinoma patients. Tumour Biol. 2016;37(2):2153–2159. doi:10.1007/s13277-015-4041-7.
- Dambrauskas Z, Svensson H, Joshi M, Hyltander A, Naredi P, Iresjo BM. Expression of major histocompatibility complex class I-related chain A/B (MICA/B) in pancreatic carcinoma. Int J Oncol. 2014;44(1):99–104. doi:10.3892/ijo.2013.2156.
- Watson NF, Spendlove I, Madjd Z, McGilvray R, Green AR, Ellis IO, Scholefield JH, Durrant LG. Expression of the stress-related MHC class I chain-related protein MICA is an indicator of good prognosis in colorectal cancer patients. Int J Cancer. 2005;118(6):1445–1452. doi:10.1002/ijc.21510.
- Salih HR, Antropius H, Gieseke F, Lutz SZ, Kanz L, Rammensee HG, Steinle A. Functional expression and release of ligands for the activating immunoreceptor NKG2D in leukemia. Blood. 2003;102(4):1389–1396. doi:10.1182/blood-2003-01-0019.
- Yang FQ, Liu M, Yang FP, Zhang XL, Yang B, Guo CC, Huang JH, Che JP, Yan Y, Zheng JH. Matrix metallopeptidase 2 (MMP2) mediates MHC class I polypeptide-related sequence A (MICA) shedding in renal cell carcinoma. Actas Urol Esp. 2014;38(3):172–178. doi:10.1016/j.acuro.2013.09.015.
- Ghadially H, Brown L, Lloyd C, Lewis L, Lewis A, Dillon J, Sainson R, Jovanovic J, Tigue NJ, Bannister D, et al. MHC class I chain-related protein A and B (MICA and MICB) are predominantly expressed intracellularly in tumour and normal tissue. Br J Cancer. 2017;116(9):1208–1217. doi:10.1038/bjc.2017.79.
- Fuertes MB, Girart MV, Molinero LL, Domaica CI, Rossi LE, Barrio MM, Mordoh J, Rabinovich GA, Zwirner NW. Intracellular retention of the NKG2D ligand MHC class I chain-related gene A in human melanomas confers immune privilege and prevents NK cell-mediated cytotoxicity. J Immunol. 2008;180(7):4606–4614. doi:10.4049/jimmunol.180.7.4606.
- Sutherland CL, Rabinovich B, Chalupny NJ, Brawand P, Miller R, Cosman D. ULBPs, human ligands of the NKG2D receptor, stimulate tumor immunity with enhancement by IL-15. Blood. 2006;108(4):1313–1319. doi:10.1182/blood-2005-11-011320.
- McGilvray RW, Eagle RA, Watson NFS, Al-Attar A, Ball G, Jafferji I, Trowsdale J, Durrant LG. NKG2D ligand expression in human colorectal cancer reveals associations with prognosis and evidence for immunoediting. Clin Cancer Res. 2009;15(22):6993–7002. doi:10.1158/1078-0432.CCR-09-0991.
- Groh V, Wu J, Yee C, Spies T. Tumour-derived soluble MIC ligands impair expression of NKG2D and T-cell activation. Nature. 2002;419(6908):734–738. doi:10.1038/nature01112.
- Salih HR, Rammensee H-G, Steinle A. Down-regulation of MICA on human tumors by proteolytic shedding. J Immunol. 2002;169(8):4098–4102. doi:10.4049/jimmunol.169.8.4098.
- Waldhauer I, Steinle A. Proteolytic release of soluble UL16-binding protein 2 from tumor cells. Cancer Res. 2006;66(5):2520–2526. doi:10.1158/0008-5472.CAN-05-2520.
- Fernandez-Messina L, Ashiru O, Boutet P, Aguera-Gonzalez S, Skepper JN, Reyburn HT, Vales-Gomez M. Differential mechanisms of shedding of the glycosylphosphatidylinositol (GPI)-anchored NKG2D ligands. J Biol Chem. 2010;285(12):8543–8551. doi:10.1074/jbc.M109.045906.
- Ashiru O, Boutet P, Fernández-Messina L, Agüera-González S, Skepper JN, Valés-Gómez M, Reyburn HT. Natural killer cell cytotoxicity is suppressed by exposure to the human NKG2D ligand MICA*008 that is shed by tumor cells in exosomes. Cancer Res. 2010;70(2):481–489. doi:10.1158/0008-5472.CAN-09-1688.
- Lu S, Zhang J, Liu D, Li G, Staveley-O’Carroll KF, Li Z, Wu JD. Nonblocking monoclonal antibody targeting soluble MIC revamps endogenous innate and adaptive antitumor responses and eliminates primary and metastatic tumors. Clin Cancer Res. 2015;21(21):4819–4830. doi:10.1158/1078-0432.CCR-15-0845.
- de Andrade L F, Tay RE, Pan D, Luoma AM, Ito Y, Badrinath S, Tsoucas D, Franz B, May KF, Harvey CJ, et al. Antibody-mediated inhibition of MICA and MICB shedding promotes NK cell-driven tumor immunity. Science. 2018;359(6383):1537–1542. doi:10.1126/science.aao0505.
- Fuertes MB, Domaica CI, Zwirner NW. Leveraging NKG2D Ligands in Immuno-Oncology. Front Immunol. 2021;12:713158. doi:10.3389/fimmu.2021.713158.
- Ochoa MC, Minute L, Rodriguez I, Garasa S, Perez-Ruiz E, Inoges S, Melero I, Berraondo P. Antibody-dependent cell cytotoxicity: immunotherapy strategies enhancing effector NK cells. Immunol Cell Biol. 2017;95(4):347–355. doi:10.1038/icb.2017.6.
- Gauthier M, Laroye C, Bensoussan D, Boura C, Decot V. Natural Killer cells and monoclonal antibodies: two partners for successful antibody dependent cytotoxicity against tumor cells. Crit Rev Oncol Hematol. 2021;160:103261. doi:10.1016/j.critrevonc.2021.103261.
- Torres N, Regge MV, Secchiari F, Friedrich AD, Spallanzani RG, Raffo Iraolagoitia XL, Núñez SY, Sierra JM, Ziblat A, Santilli MC, et al. Restoration of antitumor immunity through anti-MICA antibodies elicited with a chimeric protein. J Immunother Cancer. 2020;8(1):e000233. doi:10.1136/jitc-2019-000233.
- Badrinath S, Dellacherie MO, Li A, Zheng S, Zhang X, Sobral M, Pyrdol JW, Smith KL, Lu Y, Haag S, et al. A vaccine targeting resistant tumours by dual T cell plus NK cell attack. Nature. 2022 May;25:1–7. doi:10.1038/s41586-022-04772-4.
- Du C, Bevers J, Cook R, Lombana TN, Rajasekaran K, Matsumoto M, Spiess C, Kim JM, Ye Z. MICA immune complex formed with alpha 3 domain-specific antibody activates human NK cells in a Fc-dependent manner. J Immunother Cancer. 2019;7(1):207. doi:10.1186/s40425-019-0687-9.
- Zhang J, Liu D, Li G, Staveley-O’Carroll KF, Graff JN, Li Z, Wu JD. Antibody-mediated neutralization of soluble MIC significantly enhances CTLA4 blockade therapy. Sci Adv. 2017;3(5):e1602133. doi:10.1126/sciadv.1602133.
- Mantovani S, Varchetta S, Mele D, Donadon M, Torzilli G, Soldani C, Franceschini B, Porta C, Chiellino S, Pedrazzoli P, et al. An Anti-MICA/B antibody and IL-15 rescue altered NKG2D-dependent NK cell responses in hepatocellular carcinoma. Cancers. 2020;12(12):3583. doi:10.3390/cancers12123583.
- Ricketts CJ, De Cubas AA, Fan H, Smith CC, Lang M, Reznik E, Bowlby R, Gibb EA, Akbani R, Beroukhim R, et al. The cancer genome atlas comprehensive molecular characterization of renal cell carcinoma. Cell Rep. 2018;23(1):313–326.e5. doi:10.1016/j.celrep.2018.03.075.
- Chevrier S, Levine JH, Zanotelli VRT, Silina K, Schulz D, Bacac M, Ries CH, Ailles L, Jewett MAS, Moch H, et al. An immune atlas of clear cell renal cell carcinoma. Cell. 2017;169(4):736–749.e18. doi:10.1016/j.cell.2017.04.016.
- Wong MCS, Goggins WB, Yip BHK, Fung FDH, Leung C, Fang Y, Wong SYS, Ng CF. Incidence and mortality of kidney cancer: temporal patterns and global trends in 39 countries. Sci Rep. 2017;7(1):15698. doi:10.1038/s41598-017-15922-4.
- Posadas EM, Limvorasak S, Figlin RA. Targeted therapies for renal cell carcinoma. Nat Rev Nephrol. 2017;13(8):496–511. doi:10.1038/nrneph.2017.82.
- Rini BI, Battle D, Figlin RA, George DJ, Hammers H, Hutson T, Jonasch E, Joseph RW, McDermott DF, Motzer RJ, et al. The society for immunotherapy of cancer consensus statement on immunotherapy for the treatment of advanced renal cell carcinoma (RCC). J Immunother Cancer. 2019;7(1):354. doi:10.1186/s40425-019-0813-8.
- Schleypen JS, Baur N, Kammerer R, Nelson PJ, Rohrmann K, Grone EF, Hohenfellner M, Haferkamp A, Pohla H, Schendel DJ, et al. Cytotoxic markers and frequency predict functional capacity of natural killer cells infiltrating renal cell carcinoma. Clin Cancer Res. 2006;12(3 Pt 1):718–725. 12/3/718 [pii]. doi:10.1158/1078-0432.CCR-05-0857.
- Ziblat A, Iraolagoitia XLR, Nuñez SY, Torres NI, Secchiari F, Sierra JM, Spallanzani RG, Rovegno A, Secin FP, Fuertes MB, et al. Circulating and tumor-infiltrating NK cells from clear cell renal cell carcinoma patients exhibit a predominantly inhibitory phenotype characterized by overexpression of CD85j, CD45, CD48 and PD-1. Front Immunol. 2021;12:681615. doi:10.3389/fimmu.2021.681615.
- Bussolati B, Bruno S, Grange C, Ferrando U, Camussi G. Identification of a tumor-initiating stem cell population in human renal carcinomas. FASEB J. 2008;22(10):3696–3705. doi:10.1096/fj.08-102590.
- Caracausi M, Piovesan A, Antonaros F, Strippoli P, Vitale L, Pelleri MC. Systematic identification of human housekeeping genes possibly useful as references in gene expression studies. Mol Med Rep. 2017;16(3):2397–2410. doi:10.3892/mmr.2017.6944.
- Eisenberg E, Levanon EY. Human housekeeping genes, revisited. Trends Genet. 2013;29(10):569–574. doi:10.1016/j.tig.2013.05.010.
- The Cancer Genome Atlas Research Network. Comprehensive molecular characterization of clear cell renal cell carcinoma. Nature. 2013;499(7456):43–49. doi:10.1038/nature12222.
- Nuñez SY, Ziblat A, Secchiari F, Torres NI, Sierra JM, Raffo Iraolagoitia XL, Araya RE, Domaica CI, Fuertes MB, and Zwirner NW. Human M2 macrophages limit NK cell effector functions through secretion of. J Immunol. 2018;200(3):1008–1015. doi:10.4049/jimmunol.1700737.
- Ziblat A, Domaica CI, Spallanzani RG, Iraolagoitia XL, Rossi LE, Avila DE, Torres NI, Fuertes MB, Zwirner NW. IL-27 stimulates human NK-cell effector functions and primes NK cells for IL-18 responsiveness. Eur J Immunol. 2015;45(1):192–202. doi:10.1002/eji.201444699.
- Jinushi M, Vanneman M, Munshi NC, Tai YT, Prabhala RH, Ritz J, Neuberg D, Anderson KC, Carrasco DR, Dranoff G. MHC class I chain-related protein A antibodies and shedding are associated with the progression of multiple myeloma. Proc Natl Acad Sci USA. 2008;105(4):1285–1290. doi:10.1073/pnas.0711293105.
- Fionda C, Malgarini G, Soriani A, Zingoni A, Cecere F, Iannitto ML, Ricciardi MR, Federico V, Petrucci MT, Santoni A, et al. Inhibition of glycogen synthase kinase-3 increases NKG2D ligand MICA expression and sensitivity to NK cell-mediated cytotoxicity in multiple myeloma cells: role of STAT3. J Immunol. 2013;190(12):6662–6672. doi:10.4049/jimmunol.1201426.
- Zingoni A, Cecere F, Vulpis E, Fionda C, Molfetta R, Soriani A, Petrucci MT, Ricciardi MR, Fuerst D, Amendola MG, et al. Genotoxic stress induces senescence-associated ADAM10-dependent release of NKG2D MIC ligands in multiple myeloma cells. J Immunol. 2015;195(2):736–748. doi:10.4049/jimmunol.1402643.
- Dulphy N, Berrou J, Campillo JA, Bagot M, Bensussan A, Toubert A. NKG2D ligands expression and NKG2D-mediated NK activity in Sezary patients. J Invest Dermatol. 2009;129(2):359–364. doi:10.1038/jid.2008.256.
- Ribeiro CH, Kramm K, Galvez-Jiron F, Pola V, Bustamante M, Contreras HR, Sabag A, Garrido-Tapia M, Hernandez CJ, Zuniga R, et al. Clinical significance of tumor expression of major histocompatibility complex class I-related chains A and B (MICA/B) in gastric cancer patients. Oncol Rep. 2016;35(3):1309–1317. doi:10.3892/or.2015.4510.
- Okita R, Yukawa T, Nojima Y, Maeda A, Saisho S, Shimizu K, Nakata M. MHC class I chain-related molecule A and B expression is upregulated by cisplatin and associated with good prognosis in patients with non-small cell lung cancer. Cancer Immunol Immunother. 2016;65(5):499–509. doi:10.1007/s00262-016-1814-9.
- Sheppard S, Ferry A, Guedes J, Guerra N. The paradoxical role of NKG2D in cancer immunity. Front Immunol. 2018;9:1808. doi:10.3389/fimmu.2018.01808.
- Molinero LL, Fuertes MB, Rabinovich GA, Fainboim L, Zwirner NW. Activation-induced expression of MICA on T lymphocytes involves engagement of CD3 and CD28. J Leukoc Biol. 2002;71:791–797.
- Cerboni C, Zingoni A, Cippitelli M, Piccoli M, Frati L, Santoni A. Antigen-activated human T lymphocytes express cell-surface NKG2D ligands via an ATM/ATR-dependent mechanism and become susceptible to autologous NK- cell lysis. Blood. 2007;110(2):606–615. doi:10.1182/blood-2006-10-052720.
- Domaica CI, Fuertes MB, Rossi LE, Girart MV, Avila DE, Rabinovich GA, Zwirner NW. Tumour-experienced T cells promote NK cell activity through trogocytosis of NKG2D and NKp46 ligands. EMBO Rep. 2009;10(8):908–915. doi:10.1038/embor.2009.92.
- Bussolati B, Dekel B, Azzarone B, Camussi G. Human renal cancer stem cells. Cancer Lett. 2013;338(1):141–146. doi:10.1016/j.canlet.2012.05.007.
- Cai X, Dai Z, Reeves RS, Caballero-Benitez A, Duran KL, Delrow JJ, Porter PL, Spies T, Groh V. Autonomous stimulation of cancer cell plasticity by the human NKG2D lymphocyte receptor coexpressed with its ligands on cancer cells. PLoS One. 2014;9(10):e108942. doi:10.1371/journal.pone.0108942.
- Cai X, Caballero-Benitez A, Gewe MM, Jenkins IC, Drescher CW, Strong RK, Spies T, Groh V. Control of Tumor Initiation by NKG2D Naturally Expressed on Ovarian Cancer Cells. Neoplasia. 2017;19(6):471–482. doi:10.1016/j.neo.2017.03.005.
- Paczulla AM, Rothfelder K, Raffel S, Konantz M, Steinbacher J, Wang H, Tandler C, Mbarga M, Schaefer T, Falcone M, et al. Absence of NKG2D ligands defines leukaemia stem cells and mediates their immune evasion. Nature. 2019;572(7768):254–259. doi:10.1038/s41586-019-1410-1.
- Wang B, Wang Q, Wang Z, Jiang J, Yu SC, Ping YF, Yang J, Xu SL, Ye XZ, Xu C, et al. Metastatic consequences of immune escape from NK cell cytotoxicity by human breast cancer stem cells. Cancer Res. 2014;74(20):5746–5757. doi:10.1158/0008-5472.CAN-13-2563.
- Waldhauer I, Goehlsdorf D, Gieseke F, Weinschenk T, Wittenbrink M, Ludwig A, Stevanovic S, Rammensee HG, Steinle A. Tumor-associated MICA is shed by ADAM proteases. Cancer Res. 2008;68(15):6368–6376. doi:10.1158/0008-5472.CAN-07-6768.
- Prinz PU, Mendler AN, Brech D, Masouris I, Oberneder R, Noessner E. NK-cell dysfunction in human renal carcinoma reveals diacylglycerol kinase as key regulator and target for therapeutic intervention. Int J Cancer. 2014;135(8):1832–1841. doi:10.1002/ijc.28837.
- Xia Y, Zhang Q, Zhen Q, Zhao Y, Liu N, Li T, Hao Y, Zhang Y, Luo C, Wu X. Negative regulation of tumor-infiltrating NK cell in clear cell renal cell carcinoma patients through the exosomal pathway. Oncotarget. 2017;8(23):37783–37795. doi:10.18632/oncotarget.16354.
- Zheng Y, Li Y, Lian J, Yang H, Li F, Zhao S, Qi Y, Zhang Y, Huang L. TNF-α-induced Tim-3 expression marks the dysfunction of infiltrating natural killer cells in human esophageal cancer. J Transl Med. 2019;17(1):165. doi:10.1186/s12967-019-1917-0.
- Yu L, Liu X, Wang X, Yan F, Wang P, Jiang Y, Du J, Yang Z. TIGIT+ TIM-3+ NK cells are correlated with NK cell exhaustion and disease progression in patients with hepatitis B virus‑related hepatocellular carcinoma. Oncoimmunology. 2021;10(1):1942673. doi:10.1080/2162402X.2021.1942673.
- André P, Denis C, Soulas C, Bourbon-Caillet C, Lopez J, Arnoux T, Bléry M, Bonnafous C, Gauthier L, Morel A, et al. Anti-NKG2A mab is a checkpoint inhibitor that promotes anti-tumor immunity by unleashing both T and NK cells. Cell. 2018;175(7):1731–1743.e13. doi:10.1016/j.cell.2018.10.014.
- Sinclair LV, Barthelemy C, Cantrell DA. Single Cell Glucose Uptake Assays: a Cautionary Tale. Immunometabolism. 2020;2(4):e200029. doi:10.20900/immunometab20200029.
- Wu X, Zhang Y, Li Y, Schmidt-Wolf IGH. Increase of antitumoral effects of cytokine-induced killer cells by antibody-mediated inhibition of MICA shedding. Cancers. 2020;12(7):1818. doi:10.3390/cancers12071818.
- Afolabi LO, Afolabi MO, Sani MM, Okunowo WO, Yan D, Chen L, Zhang Y, Wan X. Exploiting the CRISPR-Cas9 gene-editing system for human cancers and immunotherapy. Clin Transl Immunology. 2021;10(6):e1286. doi:10.1002/cti2.1286.
- Michaux A, Mauën S, Breman E, Dheur M-S, Twyffels L, Saerens L, Jacques-Hespel C, Gauthy E, Agaugué S, Gilham DE, et al. Clinical Grade Manufacture of CYAD-101, a NKG2D-based, First in Class, Non-Gene-edited Allogeneic CAR T-Cell Therapy. J Immunother. 2022;45(3):150–161. doi:10.1097/CJI.0000000000000413.
- Leivas A, Valeri A, Córdoba L, García-Ortiz A, Ortiz A, Sánchez-Vega L, Graña-Castro O, Fernández L, Carreño-Tarragona G, Pérez M, et al. NKG2D-CAR-transduced natural killer cells efficiently target multiple myeloma. Blood Cancer J. 2021;11(8):146. doi:10.1038/s41408-021-00537-w.
- Ferrari de Andrade L, Kumar S, Luoma AM, Ito Y, Alvesda Silva PH, Pan D, Pyrdol JW, Yoon CH, Wucherpfennig KW. Inhibition of MICA and MICB shedding elicits NK-cell-mediated immunity against tumors resistant to cytotoxic T cells. Cancer Immunol Res. 2020;8(6):769–780. doi:10.1158/2326-6066.CIR-19-0483.