
ABSTRACT
Although it has proven difficult to demonstrate the clinical efficacy of therapeutic vaccination as a monotherapy in advanced cancers, its combination with an immunomodulatory treatment to reduce intra-tumor immunosuppression and improve vaccine efficacy is a very promising strategy. In this context, we are studying the combination of a vaccine composed of peptides of the tumor antigen survivin (SVX vaccine) with the anti-angiogenic agent sunitinib in a colorectal carcinoma model. To this end, we have been focusing on administration scheduling and have highlighted a therapeutic synergy between SVX vaccine and sunitinib when the vaccine was administered at the end of anti-angiogenic treatment. In this setting, a prolonged control of tumor growth associated with an important percentage of complete tumor regression was observed. Studying the remodeling induced by each therapy on the immunological and angiogenic tumor microenvironment over time we observed, during sunitinib treatment, a transient increase in polymorphonuclear myeloid-derived suppressor cells (PMN-MDSCs) and a decrease in NK cells in the tumor microenvironment. In contrast, after sunitinib treatment was stopped, a decrease in PMN-MDSC populations has been observed in the tumor, associated with an increase in NK cells, pericyte coverage of tumor vessels and CD8+ T cell population and functionality. In conclusion, sunitinib treatment results in the promotion of an immune-favorable tumor microenvironment that can guide the optimal sequence of vaccine and anti-angiogenic combination to reinforce their synergy.
Introduction
The development of immunotherapies and targeted treatment has led to significant progress in successfully managing cancer. Nevertheless, each of these strategies used as monotherapy is only effective in a limited number of patients and problems of toxicity and resistance to treatment arise.Citation1–4 To overcome these difficulties, combination therapy approaches are emerging and are the subject of a significant number of clinical trials.Citation5–9
In this regard, the combination of therapeutic vaccination with other immunomodulatory treatments seems very promising.Citation10–12 Indeed, although it has proven difficult to demonstrate the clinical efficacy of therapeutic vaccination as a monotherapy, it remains the only immunotherapy capable of inducing an antitumor-specific immune response. Its combination with immunomodulatory treatments to reduce intra-tumor immunosuppression is the subject of numerous studies.
Among these, the combination of therapeutic vaccination with an anti-angiogenic agent seems particularly relevant as tumor angiogenesis plays an important immunosuppressive role during cancer development.Citation13–15 The tortuous structure of tumor-associated vessels and their leakage contribute to the establishment of a hypoxic microenvironment known to alter the immune response, in particular through the involvement of HIF transcription factors in immunometabolism.Citation16 In addition, the anergic phenotype of tumor-associated endothelial cells contributes to the formation of a physical barrier to the infiltration of effector immune cells into the tumor microenvironment and acts as a vascular checkpoint participating in the immune escape induced during tumor development.Citation17 The combination of anti-angiogenic treatment (AAT) with cancer vaccine could therefore limit the induction of such an immunosuppressive microenvironment and facilitate the entry and functionality of vaccine-induced specific T cells.
The apoptosis inhibitor survivin is a tumor-associated antigen of particular interest as a target for anti-cancer immunotherapies as it is highly overexpressed in many cancers.Citation18 High expression of survivin by tumor cells is associated with decreased overall survival, increased recurrence and resistance to cytotoxic therapies.Citation19 In addition to its role in apoptosis and cell division in tumor cells, survivin expression is also associated with the development of tumor angiogenesis by participating in the escalation of vascular growth factor VEGF-A production in the tumor microenvironment.Citation20
We have previously demonstrated the therapeutic efficacy of a new cancer vaccine (SVX) composed of long synthetic peptides of the survivin protein in different tumor models. This vaccine containing multiple CD4 and CD8 epitopes has shown immunogenicity in vitro in healthy donors and spontaneous responses against the peptides have been observed in patients with different cancers. Immunization of tumor-bearing mice induced specific and memory multifunctional CD8+ and CD4+ T cell responses.Citation21 However, an escape in terms of tumor growth was observed in animals failing to achieve complete tumor regression and optimization strategies need to be considered.
In this study, we thus investigated the optimization of the SVX vaccine in combination with the AAT sunitinib (a tyrosine kinase inhibitor that mainly targets the VEGF-VEGFR pathway) by focusing on the importance of the administration schedule between these two therapies and by studying the immune remodeling induced by this anti-angiogenic molecule.
Materials and methods
Mice
Female BALB/cANRj mice from Janvier Labs were used in experiments at 8–10 weeks of age. All mice were housed in the INSERM U970-PARCC animal facility under specific pathogen-free conditions. Experiments were approved by the local Paris-Descartes Ethics Committee for Animal Research (CEEA 19–027).
Tumor cells
CT26 colorectal carcinoma and Renca renal cortical adenocarcinoma cell lines (from ATCC) were used as previously described.Citation21
Vaccine and adjuvants
SVX vaccine is composed of three long synthetic peptides derived from the native sequence of the human tumor antigen survivin: S1 (17–34), S2 (84–110) and S3 (122–142), purchased from Genosphere Biotechnologies. As previously described,Citation21 prime immunization consists of a subcutaneous (s.c.) injection with 100 µg of each SVX peptide (S1+ S2+ S3) adjuvanted with 50 µg of CpG oligonucleotides (Litenimod, Oligovax SAS) emulsified in incomplete Freund’s adjuvant (IFA, Sigma-Aldrich). A boost is performed 7 days after the first immunization without adjuvant.
Tumor inoculation, immunizations, and sunitinib treatment
Mice were s.c. inoculated with 5 × 10⁵ CT26 cells suspended in 100 µL PBS into the right side of the abdomen. Tumor growth was monitored twice a week using a caliper and tumor volumes were calculated as (tumor length × tumor width2)/2. In experiments studying the impact of SVX vaccination on tumor angiogenesis, mice were immunized with SVX + CpG/IFA at day 4 and boosted one week later (d11). In all conditions using anti-angiogenic therapy, 0.8 mg/mice of sunitinib malate powder (Pfizer) was solubilized in a final volume of 100 µL of DMSO:PBS (1:1), corresponding to a treatment of 40 mg/kg/day, and administered by oral gavage for 14 consecutive days. When testing different administration schedules between SVX vaccine and sunitinib, the treatment protocol started either with vaccination or sunitinib as further detailed in the manuscript. As tumor growth varies over time with each treatment, the mice were separated into two groups at the start of each treatment so that each group contained mice with equal variations in tumor volume.
VEGF-A dosage
Tumors harvested at different time points were weighed and mechanically dissociated in Bio-Plex Cell Lysis buffer (Bio-Rad) using gentleMACS Dissociator (Miltenyi Biotec) and total proteins were determined by bicinchoninic acid assay (Pierce, Thermo Fisher Scientific). VEGF-A levels in tumor lysates were evaluated by enzyme-linked immunosorbent assay (ELISA) using the manufacturer’s protocol on 100 µg of protein (Mouse VEGF DuoSet ELISA, R&D Systems Bio-Techne).
Immunofluorescence in situ and quantification
To assess tumor hypoxia, mice were intraperitoneally (i.p.) injected with 1.5 mg of pimonidazole hydrochloride (HypoxyprobeTM) one hour prior to sacrifice. Frozen tumor sections (7 µm) were fixed in ice-cold acetone for 5 min, blocked for endogenous biotins (Avidin/Biotin Blocking Kit, Vector Laboratories) and saturated with a 5% bovine serum albumin solution (Sigma-Aldrich) for 30 minutes. Endothelial cells were labeled with a FITC-conjugated rat anti-mouse CD31 antibody (5 µg/mL, BioPharmingen 553372). Pericytes were either detected with biotin-coupled anti-α-sma primary antibody (2 µg/mL, Invitrogen MA5-11544) associated with Streptavidin-Cy3 (6 µg/mL JIR 016–160-084) or with a rabbit anti-NG2 primary antibody (5 µg/mL, Millipore AB5320) associated with Cy5 anti-rabbit antibody (1.5 µg/mL, JIR 711–175-152). Rabbit anti-pimonidazole antisera (1:100, Hypoxyprobe Omni Kit Pab2627) associated with Cy5 anti-rabbit antibody (5 µg/mL, JIR 711–175-152) and rat anti-CD8 primary antibody (2 µg/mL, eBioscience 14–0081-86) associated with AF594 anti-rat IgG (3.75 µg/mL, JIR 112–585-167) were used to analyze tumor hypoxia and CD8+ T cells respectively. Nuclei were labeled by DAPI staining (1 µg/mL). Stained tumor sections were scanned with a Vectra® automated microscope with 8–10 fields examined with InForm® Software (Akoya Biosciences). A tissue segmentation algorithm was used to determine either hypoxic areas, endothelial cells or pericytes by analyzing the percentage of positive areas for the associated markers. CD8+ cell counts were determined using a cell segmentation algorithm combined with phenotyping.
Isolation of immune cells from tumors and spleens
Spleens were collected and pressed through a 40 µm cell strainer, whereas tumors were chopped into small pieces with a scalpel, mechanically dissociated using gentleMACS Dissociator (Miltenyi Biotec) and filtered through a 70 µm cell strainer. Red blood cells were lysed in every sample with osmotic lysis buffer (NH4Cl 8.3 g/L, KHCO3 1 g/L, EDTA 500 mM). Cells were then washed in PBS to obtain a single-cell suspension.
Luminex
CD8+ T cells isolated from tumors were enriched by negative selection using EasySepTM Mouse CD8+ T cell Isolation Kit (STEMCELL Technologies) and 5 × 10⁴ cells/well were in vitro restimulated with anti-CD3/anti-CD28 beads (Thermo Fisher Scientific) following manufacturer’s protocol. At 24 h, supernatants were collected and a bead-based multiplex immunoassay (Luminex) was performed according to manufacturer’s indications (Bio-Rad) and analyzed on Bio-Plex 200 (Bio-Rad) to measure the levels of cytokines produced. The analytes concentration was calculated using a standard curve (5-PL regression) with Bio-Plex manager software. Non-detectable or non-relevant cytokines were not presented.
Flow cytometry
After performing cell viability labeling using the Live/Dead Fixable Aqua Dead Cell Stain Kit (Invitrogen) and FcR blocking with anti-CD16/32 antibody (clone 93), the following antibodies were used for surface staining: anti-mouse CD3 (145–2C11), CD45 (30-F11), MHC-II (M5/114.15.2), CD11c (N418), Ly-6C (HK1.4), CD8 (53–6.7), NKp46 (29A1.4), CD4 (RM4-5), CD11b (M1/70), Ly-6 G (1A8), F4/80 (T45-2342), and PD-1 (J43). For intracellular staining, samples were fixed/permeabilized using the FoxP3/Transcription Factor Staining Buffer Set (Invitrogen) and stained with anti-mouse FoxP3 (FJK-16s), anti-mouse Ki-67 (B56) and anti-human/mouse Granzyme B (GB11). All antibodies were purchased from BD Bioscience, Biolegend and Invitrogen. Acquisitions were performed on BD Fortessa X20 (Becton Dickinson), and data were analyzed with FlowJo Software (BD Biosciences).
Statistical analysis
Results are expressed as means ± SEM. Statistical comparisons were established using Prism V.9 GraphPad Software (San Diego California, USA). Statistical significance was determined by Mann–Whitney t-test or two-way ANOVA (analysis of variance) using Sidak’s multiple comparisons test and Tukey’s multiple comparisons test when appropriate. For correlation analysis, a Spearman correlation was performed. P-values lower than 0.05 (*) were considered significant.
Results
SVX therapeutic vaccine modulates tumor angiogenesis by transiently decreasing VEGF-A levels in the tumor
As we already demonstrated in our previous study,Citation21 the SVX vaccine allows a good control of tumor growth (Suppl. S1, A), but a progressive tumor escape occurred in mice that had not completely eliminated the tumor.
With the overall objective of combining the vaccine with an anti-angiogenic treatment and given the previously demonstrated link between survivin and VEGF-A expression,Citation20 we studied the impact of SVX vaccine on tumor neoangiogenesis over time. CT26 tumors were therefore harvested at different time after immunization to study VEGF-A levels, tumor hypoxia, microvascular density as well as pericyte coverage (). We observed an increase in the levels of VEGF-A per mg of tumor in control mice at day 14 compared to day 7 () at a time when tumor volume reached approximately 500 mm3 (). At the same time, the levels of VEGF-A in the tumor lysate of vaccinated mice were much lower and similar to those observed at day 21 in both groups ().
Figure 1. SVX vaccine modulates tumor angiogenesis with a transient decrease in VEGF levels in the tumor.
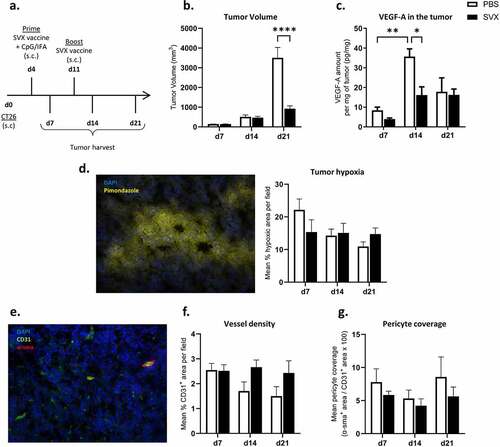
Tumor hypoxia in vaccinated and control mice was studied by in situ immunofluorescence using pimonidazole adduct staining, but no difference in hypoxic areas was observed throughout the experiment (, Suppl. S1, B). We further studied the vessel and pericyte density in these tumors (). No significant difference was observed in microvascular density over time in the control and treated groups (; Suppl. S1, C). Finally, although the SVX vaccine did not seem to affect tumor pericyte density (Suppl. S1, D-E) or pericyte coverage (), a negative correlation between pericyte density and tumor size at sacrifice was observed (Suppl. S1, F).
These results show that SVX vaccine slightly modulates tumor angiogenesis by decreasing VEGF-A levels in the tumor and suggest that it could benefit from a combination with an anti-angiogenic treatment to overcome microenvironment immunosuppression.
Combination of SVX vaccine and sunitinib shows synergistic effect when vaccine is administered after anti-angiogenic treatment
To assess the potential synergistic effect of combining SVX vaccine with an anti-angiogenic treatment, we selected sunitinib, which is used in the treatment of different cancersCitation4,Citation22 and which mainly targets the VEGF-VEGFR pathway and is known to modulate immunosuppression.Citation23,Citation24 We first set up two combination strategies in which the vaccination preceded the sunitinib treatment. The administration of sunitinib was then performed either after vaccine prime (d7) or vaccine boost (d14). When sunitinib was administered from day 7 to day 20, we observed marked control of tumor growth in the group treated with sunitinib alone compared with the control group (DMSO). However, no benefit accrued by adding SVX vaccine prior to sunitinib in this setting (). Importantly, delaying the start of sunitinib treatment gave a worse outcome. When administered alone, its effect on tumor growth control was lost and the addition of vaccination before treatment had no effect. Both the SVX + sunitinib and the sunitinib groups exhibited tumor growth similar to that in the control group (). Although no synergy was observed, these initial experiments demonstrated that early sunitinib administration provided sufficient tumor mass control to consider delaying immunization with the SVX vaccine.
Figure 2. Strong therapeutic efficacy of the combination when the vaccination is initiated at the end of sunitinib treatment.
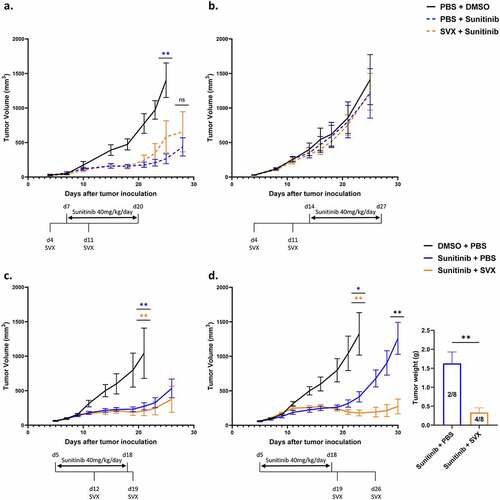
In this context, we set up two other combination strategies to assess the potential benefit of adding SVX vaccine after the initiation of sunitinib treatment (d5 to d18). The SVX vaccine was added after 1 week (d12) or at the end of sunitinib treatment (d19). The combination in which the vaccine was added concomitantly with sunitinib treatment (vaccine at d12) did not provide a beneficial effect. A good control of tumor volume was observed during sunitinib treatment followed by the onset of tumor regrowth after stoppage of anti-angiogenic treatment in both groups ().
In contrast, when the vaccine was added at the end of sunitinib treatment, a synergy between the two therapies was observed ( left). In this setting, in the group treated with sunitinib alone, tumor growth was well controlled throughout sunitinib treatment and then escaped after sunitinib was stopped. The addition of the SVX vaccine at this time enabled a very low tumor mass to be maintained over time and was associated with 50% (4/8) complete tumor regression compared to 25% (2/8) in mice treated with sunitinib alone ( right). The therapeutic effect of this combination was also confirmed in a model of renal cortical adenocarcinoma (Suppl. S2).
Altogether, these experiments highlight a lack of synergy in concomitant combination strategies between the vaccine and sunitinib, and a significant benefit of the combination when the vaccine is added subsequently to the anti-angiogenic treatment.
A marked increase in pericyte coverage and CD8+ T cell infiltration is observed only after sunitinib treatment is stopped
In order to understand the remodeling parameters induced by sunitinib on the tumor microenvironment and to explain the synergy of action observed when the SVX vaccine is added at the end of the anti-angiogenic treatment, we studied the impact of sunitinib over time on tumor angiogenesis and the immune infiltrate.
Tumor-bearing mice were therefore treated with sunitinib for 14 days starting d5 to d18 and tumors of control or treated mice were harvested at different times of the treatment, i.e. halfway through the treatment on d12, at the end of the treatment (d19) and one week after treatment was completed (d26) (). The therapeutic efficacy of sunitinib in terms of tumor mass control was significantly observed starting from d19, after 2 weeks of treatment (). We assessed the impact of sunitinib on microvascular density, pericyte coverage and CD8+ T cell infiltrate by in situ immunofluorescence ( and Suppl. S3).
Figure 3. Pericyte coverage and CD8+ T cell infiltration increase one week after the interruption of sunitinib.
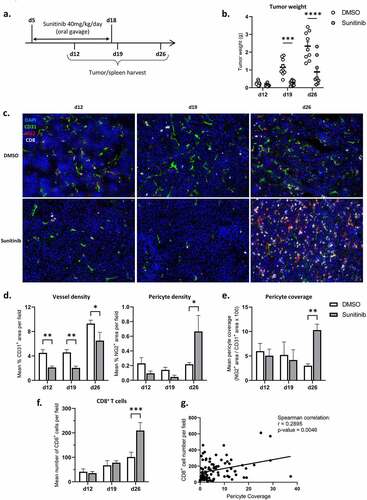
We observed an impact of sunitinib on microvascular density, during (d12 and d19) and after sunitinib treatment (d26), with a significant decrease in CD31+ areas in treated compared to non-treated mice ( left). However, one week after the end of treatment (d26), the density of pericytes in the tumors was markedly increased in treated mice ( right), leading to enhanced pericyte coverage at this time point ().
A strong increase in CD8+ T cell density was also highlighted after anti-angiogenic treatment discontinuation in the treated group () and a positive correlation was observed between CD8+ T cell infiltration and pericyte coverage of the tumors at d26, regardless of the group ().
Sunitinib treatment globally reduces the myeloid population in the spleen while transiently increasing polymorphonuclear MDSCs infiltrating the tumor
To further understand the remodeling induced by sunitinib during and after treatment we studied, by flow cytometry, the impact of the anti-angiogenic treatment on the different immune cell populations present in the tumor and in the spleen. First of all, the global immune infiltrate of the tumors was impacted by sunitinib treatment with a massive increase in the overall infiltration of CD45+ immune cells per gram of tumor at d26 in mice previously treated with sunitinib (). Given these important variations in terms of immune cell number between the different groups, we then studied the distribution of the different populations within this immune infiltrate, starting with the different myeloid populations.
Figure 4. Sunitinib decreases myeloid populations in the spleen over time but transiently increases PMN-MDSCs infiltrating the tumor. In the same experimental settings as described before, CT26-bearing mice were treated or not with sunitinib (d5 to d18). Tumors and spleens were harvested at d12, d19 or d26 to perform phenotyping analysis by flow cytometry (n = 14–18 mice/group/day).
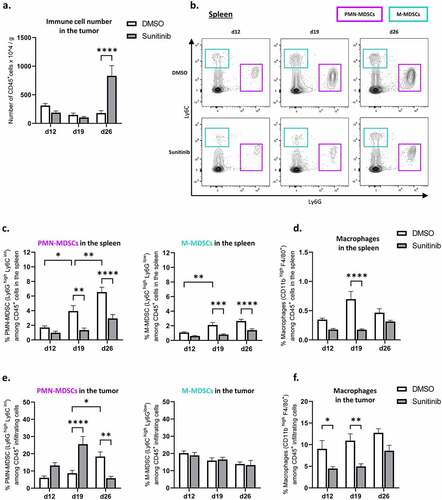
Different studies have previously demonstrated that sunitinib could have an impact on immunosuppressive populations, in particular on the myeloid-derived suppressor cell (MDSC) population in the spleen.Citation25,Citation26 According to the literatureCitation27,Citation28 and following the gating strategy presented in Suppl. S4, A, we studied the proportion of monocytic MDSCs (M-MDSCs) and polymorphonuclear MDSCs (PMN-MDSCs) among the immune cells in the spleen and tumor of both sunitinib-treated and non-treated mice over time, as well as the proportion of macrophages and dendritic cells.
Regarding the impact of sunitinib treatment on myeloid cells in the periphery, we observed a decrease in both PMN-MDSC and M-MDSC populations in the spleen of sunitinib-treated mice (), as previously described.Citation25,Citation26 Over time, MDSC populations, in particular PMN-MDSC populations, represented an increasing proportion of the immune cells in the spleen of control mice while remaining low in sunitinib-treated mice at all time points of the experiment (). In addition to this decrease in MDSCs in the spleen, a reduction in macrophages was also observed after two weeks of sunitinib treatment (d19) () as well as a reduction of dendritic cells during the anti-angiogenic treatment (Suppl. S5. A).
Although an accumulation of PMN-MDSCs overtime was also detected in the tumors of control mice, the impact of sunitinib on this infiltrating population was different than in the periphery. Indeed, an increase in the PMN-MDSC population infiltrating the tumors of treated animals was observed during sunitinib treatment, significantly at d19, followed by a decrease of this population after sunitinib treatment was stopped (d26) compared to control mice ( left). On the other hand, no change in the proportion of M-MDSCs infiltrating tumors was observed over time in treated or control animals ( right).
Finally, sunitinib treatment also impacted tumor-infiltrating macrophages, with a decrease in their proportion throughout the entire study which was statistically significant at d12 and d19 (). Alongside this decrease in macrophage populations, their phenotype also appears to be influenced by anti-angiogenic treatment with an increase in MHC class II expressing macrophages (Suppl. S5, B-C).
These results thus show a similar impact of sunitinib on macrophages in the spleen and the tumor, but also highlight differences in the modulation of PMN-MDSCs between the tumor and the periphery.
Substantial increase in NK cell population and proliferation one week after sunitinib treatment was stopped
We studied the NK cell populations in the spleen and infiltrating the tumor and overall reported a similar impact of sunitinib on this population in both organs. In the spleen, the proportion of NK cells in control mice was relatively constant over time. In treated mice, a decrease in NK cell percentage was observed during sunitinib treatment, significantly at d12, followed by an increase of this population one week after the anti-angiogenic treatment was stopped, compared to control mice (, left). In the tumor, the percentage of NK cells decreased over time in control mice and, as for the spleen, the proportion of NK cells decreased at day 12 in treated animals but increased strikingly at day 26, compared to controls (, right).
Figure 5. NK populations are decreased during sunitinib treatment and increased after the cessation of treatment in both tumor and spleen.
Moreover, a decrease in the proliferation of infiltrating NK cells over time was observed in untreated mice. In contrast, a significant increase in Ki67 expressing NK cells was detected at d26 in sunitinib-treated mice compared to controls ().
Considering the phenotype of these NK cells and precisely their expression of CD11b, a marker associated with NK cells maturation, we could observe a decrease in CD11b expression in the untreated group at d19, while the proportion of CD11b+ NK cells remained constant over time in mice treated with sunitinib ().
Sunitinib treatment induces an increase in total T lymphocytes and a decrease in Treg population and proliferation in the spleen but not in the tumor
In addition to its impact on myeloid populations, sunitinib has been reported to decrease the immunosuppressive regulatory T cell (Treg) population and proliferation.Citation26,Citation29 We therefore studied the impact of the treatment over time on spleen and tumor-infiltrating lymphocyte populations in the same experimental settings (Suppl. S4, B).
Sunitinib led to an early increase in total T lymphocytes among immune cells in the spleen and this effect was maintained throughout the time points studied ( top). On d19 and d26, a decrease in the proportion of regulatory T cells among total lymphocytes was observed in the spleen of sunitinib-treated mice compared to control mice ( top). In parallel, a decrease in the proliferation of these cells was observed in the spleen of sunitinib-treated mice as early as the first week of treatment (d12) ( top). Contrary to what was observed in the spleen, no significant difference was observed between sunitinib-treated and non-treated mice in the total T cell infiltrate and the proportion and the proliferation of regulatory T cells infiltrating the tumor in sunitinib-treated mice ( bottom and Suppl. S5, D).
Figure 6. Sunitinib treatment decreases Treg in the spleen and strongly increases CD8+ T cells population and function in the tumor.
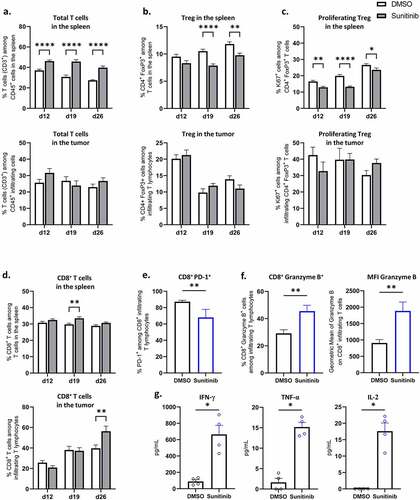
Strong increase in the proportion and function of CD8+ T cells in the tumor after sunitinib treatment
Finally, we studied the impact of the anti-angiogenic treatment on CD8+ T cells. While little impact was observed on the proportion of CD8+ T cells in the spleen ( top), a marked increase in CD8+ T cells infiltrating the tumor was detected one week after sunitinib treatment was stopped (d26) in treated mice compared to controls ( bottom), in line with the data obtained by immunofluorescence in situ (). To further analyze the modification on CD8+ infiltrating T cells at this time point, we assessed their phenotype and functionality at d26. Sunitinib led to a reduced expression of the immune checkpoint molecule PD-1 by CD8+ T cells in mice treated with sunitinib compared to controls (). Additionally, the treatment induced an increase in CD8+ T cell functionality as evidenced by an increased expression of the cytotoxicity molecule Granzyme B in percentage as well as in mean fluorescence intensity () and an enhanced production of the Th1-type cytokines IFN-γ, TNF-α and IL-2 ().
Discussion
Therapeutic vaccines when used as monotherapy have led so far to disappointing outcomes.Citation12,Citation30 But their association with other immunomodulatory treatments remains a very relevant field of research.Citation31–33 A major question raised by these therapeutic combinations is the administration protocol of each therapy.
In this study, we aimed to investigate the combination of the SVX therapeutic vaccine and the AAT sunitinib. The important connection between survivin expression and tumor angiogenesisCitation20 as well as the impact of the SVX vaccine on intra-tumor VEGF production shown in this study makes it a highly relevant target for this particular approach. Therefore, we studied in mice different administration schemes between the vaccine and the AAT in order to determine the protocol providing the best synergy of action between the two therapies. From this work, we have highlighted that only the protocol in which therapeutic vaccination was added at the end of sunitinib treatment resulted in a better tumor growth control than sunitinib treatment alone and was associated with 50% complete tumor regression. In the other protocols considered, whether vaccination was started before or after sunitinib treatment, totally or partially concomitant administration of these two therapies failed to show any therapeutic benefit.
These results are particularly interesting in view of the administration protocols that have been applied in clinical trials in which no benefit of the combination of AAT and vaccine was observed.Citation34 For example, in trials combining a therapeutic vaccine with sunitinib, patients were treated with the anti-angiogenic agent in 6-week cycles consisting of 4 weeks of treatment interspersed with 2 weeks off treatment and the immunization protocol was initiated after several cycles of anti-angiogenic treatment at the beginning of a subsequent cycle, thus after some remodeling of the tumor microenvironment by sunitinib, but always in cases where the two therapies overlap.Citation35,Citation36
Different studies have already been carried out in mice to investigate this question of administration schedule between therapeutic vaccination and sunitinib treatment.Citation37–40 However, their conclusions are conflicting and the experimental designs differ greatly in the type of therapeutic vaccine used, the number of immunizations and the mode and duration of sunitinib administration. Nonetheless, one study also suggested, as we do, that an initial remodeling of the tumor microenvironment by sunitinib was necessary to improve the efficacy of therapeutic vaccinationCitation38 and another study shows, as in our case, an important synergy of action between the two therapies when the administration scheme consisted of sunitinib treatment followed by immunization.Citation40
In order to better understand why, in our model, only this staggered association of sunitinib and SVX vaccine resulted in a therapeutic combination outcome, we were interested in understanding the remodeling parameters resulting from sunitinib treatment.
Looking at tumor vascularization we observed, as expected, a decrease in vessel density during the two weeks of sunitinib treatment, but this was not associated with a better pericyte coverage and the total immune infiltrate remained low during sunitinib treatment. In contrast, treatment discontinuation was accompanied by a large increase in pericyte coverage of tumor vessels, associated with massive infiltration of total immune cells, particularly NK cells and CD8+ T cells. This increase of pericyte coverage is interpreted in the literature as a sign of tumor vessel normalization, which is one of the proposed mechanisms of action of AAT allowing better recruitment of effector immune cells or drug delivery inside the tumor.Citation22,Citation39,Citation41 We therefore hypothesize that AAT leads to a remodeling of the tumor vasculature resulting in an increased CD8+ T cell recruitment. Importantly, not only the percentage of infiltrating CD8+ T cells increases after sunitinib treatment but they also exhibit higher functional capacity. PD-1 expression in CD8+ T cells is reduced after sunitinib treatment, as we have already shown,Citation42 and is associated with an increased expression of Granzyme B. Moreover, CD8+ infiltrating T cells from sunitinib-treated mice produce cytokines associated with an anti-tumoral Th1 response. Altogether, this profound remodeling of tumor vascularization and Th1 immune infiltration may provide a favorable ground for subsequent therapeutic vaccination.
Sunitinib has also been described to impact immunosuppressive cells in patients and in mice. A decrease in regulatory T cells and MDSCs has been observed in the blood of sunitinib-treated patients,Citation43,Citation44 with a described link between these two populations.Citation45–47 In mice, decreases in Treg and MDSC populations were also reported in the spleen after sunitinib treatment.Citation25,Citation26,Citation29 However, its impact on tumor infiltrating cells has been less documented and the results are more inconsistent across studies with some highlighting a decrease in tumor-infiltrating MDSC populations after sunitinib treatment,Citation25,Citation26,Citation40 an absence of modificationCitation38 or even an increase in tumor-infiltrating MDSCs, associated with an alteration of their phenotypes.Citation48 The reasons for these differences are numerous and may be due to the tumor modelCitation25 and the dose of sunitinib used,Citation40 which is particularly important given the strong link between hypoxia and MDSCsCitation49,Citation50 and may also explain the variations in the impact of sunitinib on tumor-infiltrating Tregs.Citation40 In this context, we observed, in agreement with the literature, a decrease in Treg and MDSC populations as well as a decrease in Treg proliferation in spleens of sunitinib-treated mice, and this even one week after treatment discontinuation (d26). However, no impact on Treg populations was observed within the tumor.
Interestingly, we observed a decrease in total MDSC populations in the tumor one week after sunitinib treatment was stopped (d26), while during treatment (d12 and 19) an increase in tumor-infiltrating PMN-MDSCs was observed. The different behavior of M-MDSCs and PMN-MDSCs under such sunitinib treatment inside the tumor may partly be due to their differential chemokines/chemokine receptors expression as it has been reported during the course of anti-VEGFR-2 therapy.Citation51,Citation52 This transient increase in tumor-infiltrating PMN-MDSCs could favor immunosuppression and consequently limit vaccine efficacy, justifying the absence of any benefit when sunitinib and therapeutic vaccination are combined in a concomitant manner. On the other hand, studies have suggested that PMN-MDSC populations may have less immunosuppressive capacity than M-MDSCs,Citation53 therefore additional functional analysis of these populations are needed in our model to confirm this hypothesis. In addition, we demonstrated a novel impact of sunitinib on other myeloid populations and specifically macrophages, both in the spleen and in the tumor. Although very interesting, this observation needs to be combined with further phenotypic and functional analysis in order to judge the significance of this effect.
Very interestingly, a transient decrease in tumor-infiltrating NK populations was also observed during treatment. Although a few studies, mainly in vitro, have shown an impact of tyrosine kinase inhibitors on NK cells,Citation54 this impact of sunitinib on tumor-infiltrating NKs has never been described before. A thorough analysis of the potential pro- or anti-tumoral role of this population needs to be carried out in order to draw conclusions concerning these changes.
In conclusion, this work has highlighted different remodeling parameters induced by sunitinib treatment, resulting in the promotion of an immune favorable tumor microenvironment. We hypothesize that the beneficial immune balance created by sunitinib treatment prior to SVX vaccination would magnify the vaccine-mediated immune responses. In this regard, the timely addition of the vaccination would have the potential to increase the survivin-specific population, long term memory and functionality of CD8+ T cells.
These results are of great importance in understanding the failures observed in clinical trials and provide new perspectives in terms of combination strategies and immune remodeling. The careful study of the impact of each of the therapies is necessary to understand and predict the next therapeutic combinations in cancer treatment in order to benefit the greatest number of patients.
Author contribution
AM and CT designed the experiments. AM, FM, TT, YA, IGF, CK, EM and PU performed the experiments. AM, FM, YA, CK, EM and CT interpreted data. AM, MT, ET and CT wrote and critically revised the manuscript. All authors read and agreed on the final version of the submitted manuscript.
Supplemental Material
Download PDF (1.3 MB)Acknowledgments
We thank the members of the animal facility as well as the cytometry and histology platforms of the PARCC-HEGP INSERM U970.
Disclosure statement
The authors report no conflict of interest
Data Availability Statement
The data that support the findings of this study are available from the corresponding author, CT, upon reasonable request.
Supplementary material
Supplemental data for this article can be accessed online at https://doi.org/10.1080/2162402X.2022.2110218
Additional information
Funding
References
- Zhong L, Li Y, Xiong L, Wang W, Wu M, Yuan T, Yang W, Tian C, Miao Z, Wang T, et al. Small molecules in targeted cancer therapy: advances, challenges, and future perspectives. Sig Transduct Target Ther. 2021;6:1–14. doi:10.1038/s41392-021-00572-w.
- Park Y-J, Kuen D-S, Chung Y. Future prospects of immune checkpoint blockade in cancer: from response prediction to overcoming resistance. Exp Mol Med. 2018;50:1–13. doi:10.1038/s12276-018-0130-1.
- Kalbasi A, Ribas A. Tumour-intrinsic resistance to immune checkpoint blockade. Nat Rev Immunol. 2020;20:25–39. doi:10.1038/s41577-019-0218-4.
- Ribatti D, Annese T, Ruggieri S, Tamma R, Crivellato E. Limitations of anti-angiogenic treatment of tumors. Transl Oncol. 2019;12:981–986. doi:10.1016/j.tranon.2019.04.022.
- Socinski MA, Jotte RM, Cappuzzo F, Orlandi F, Stroyakovskiy D, Nogami N, Rodríguez-Abreu D, Moro-Sibilot D, Thomas CA, Barlesi F, et al. Atezolizumab for first-line treatment of metastatic nonsquamous NSCLC. N Engl J Med. 2018;378:2288–2301. doi:10.1056/NEJMoa1716948.
- Rini BI, Plimack ER, Stus V, Gafanov R, Hawkins R, Nosov D, Pouliot F, Alekseev B, Soulières D, Melichar B, et al. Pembrolizumab plus axitinib versus sunitinib for advanced renal-cell carcinoma. N Engl J Med. 2019;380:1116–1127. doi:10.1056/NEJMoa1816714.
- Motzer RJ, Penkov K, Haanen J, Rini B, Albiges L, Campbell MT, Venugopal B, Kollmannsberger C, Negrier S, Uemura M, et al. Avelumab plus axitinib versus sunitinib for advanced renal-cell carcinoma. N Engl J Med. 2019;380:1103–1115. doi:10.1056/NEJMoa1816047.
- Finn RS, Qin S, Ikeda M, Galle PR, Ducreux M, Kim T-Y, Kudo M, Breder V, Merle P, Kaseb AO, et al. Atezolizumab plus bevacizumab in unresectable hepatocellular carcinoma. N Engl J Med. 2020;382:1894–1905. doi:10.1056/NEJMoa1915745.
- Vanneman M, Dranoff G. Combining immunotherapy and targeted therapies in cancer treatment. Nat Rev Cancer. 2012;12:237–251. doi:10.1038/nrc3237.
- Hollingsworth RE, Jansen K. Turning the corner on therapeutic cancer vaccines. NPJ Vaccines. 2019;4:7. doi:10.1038/s41541-019-0103-y.
- Karaki S, Anson M, Tran T, Giusti D, Blanc C, Oudard S, Tartour E. Is there still room for cancer vaccines at the era of checkpoint inhibitors. Vaccines (Basel). 2016:4. doi:10.3390/vaccines4040037.
- van der Burg SH, Arens R, Ossendorp F, van Hall T, Melief CJM. Vaccines for established cancer: overcoming the challenges posed by immune evasion. Nat Rev Cancer. 2016;16:219–233. doi:10.1038/nrc.2016.16.
- Fukumura D, Kloepper J, Amoozgar Z, Duda DG, Jain RK. Enhancing cancer immunotherapy using antiangiogenics: opportunities and challenges. Nat Rev Clin Oncol. 2018;15:325–340. doi:10.1038/nrclinonc.2018.29.
- Khan KA, Kerbel RS. Improving immunotherapy outcomes with anti-angiogenic treatments and vice versa. Nat Rev Clin Oncol. 2018;15:310–324. doi:10.1038/nrclinonc.2018.9.
- Mougel A, Terme M, Tanchot C. Therapeutic cancer vaccine and combinations with antiangiogenic therapies and immune checkpoint blockade. Front Immunol. 2019;10:467. doi:10.3389/fimmu.2019.00467.
- Krzywinska E, Stockmann CH. Metabolism and immune cell function. Biomedicines. 2018;6:56. doi:10.3390/biomedicines6020056.
- Huinen ZR, Huijbers EJM, van Beijnum JR, Nowak-Sliwinska P, Griffioen AW. Anti-angiogenic agents - overcoming tumour endothelial cell anergy and improving immunotherapy outcomes. Nat Rev Clin Oncol. 2021;18(8):527–540. doi:10.1038/s41571-021-00496-y.
- Ambrosini G, Adida C, Altieri DC. A novel anti-apoptosis gene, survivin, expressed in cancer and lymphoma. Nat Med. 1997;3:917–921. doi:10.1038/nm0897-917.
- Garg H, Suri P, Gupta JC, Talwar GP, Dubey S. Survivin: a unique target for tumor therapy. Cancer Cell Int. 2016;16:49. doi:10.1186/s12935-016-0326-1.
- Sanhueza C, Wehinger S, Castillo Bennett J, Valenzuela M, Owen GI, Quest AFG. The twisted survivin connection to angiogenesis. Mol Cancer. 2015;14:198. doi:10.1186/s12943-015-0467-1.
- Onodi F, Maherzi-Mechalikh C, Mougel A, Ben Hamouda N, Taboas C, Gueugnon F, Tran T, Nozach H, Marcon E, Gey A, et al. High therapeutic efficacy of a new survivin LSP-cancer vaccine containing CD4+ and CD8+ T-cell epitopes. Front Oncol. 2018;8. doi:10.3389/fonc.2018.00517.
- Lugano R, Ramachandran M, Dimberg A. Tumor angiogenesis: causes, consequences, challenges and opportunities. Cell Mol Life Sci. 2020;77:1745–1770. doi:10.1007/s00018-019-03351-7.
- Aparicio LMA, Fernandez IP, Cassinello J. Tyrosine kinase inhibitors reprogramming immunity in renal cell carcinoma: rethinking cancer immunotherapy. Clin Transl Oncol. 2017;19:1175–1182. doi:10.1007/s12094-017-1657-7.
- Lapeyre-Prost A, Terme M, Pernot S, Pointet A-L, Voron T, Tartour E, Taieb J. Immunomodulatory activity of VEGF in cancer. Int Rev Cell Mol Biol. 2017;330:295–342. doi:10.1016/bs.ircmb.2016.09.007.
- Ko JS, Rayman P, Ireland J, Swaidani S, Li G, Bunting KD, Rini B, Finke JH, Cohen PA. Direct and differential suppression of myeloid-derived suppressor cell subsets by sunitinib is compartmentally constrained. Cancer Res. 2010;70:3526–3536. doi:10.1158/0008-5472.CAN-09-3278.
- Ozao-Choy J, Ma G, Kao J, Wang GX, Meseck M, Sung M, Schwartz M, Divino CM, Pan P-Y, Chen S-H. The novel role of tyrosine kinase inhibitor in the reversal of immune suppression and modulation of tumor microenvironment for immune-based cancer therapies. Cancer Res. 2009;69:2514–2522. doi:10.1158/0008-5472.CAN-08-4709.
- Movahedi K, Guilliams M, Van den Bossche J, Van den Bergh R, Gysemans C, Beschin A, De Baetselier P, Van Ginderachter JA. Identification of discrete tumor-induced myeloid-derived suppressor cell subpopulations with distinct T cell-suppressive activity. Blood. 2008;111:4233–4244. doi:10.1182/blood-2007-07-099226.
- Veglia F, Sanseviero E, Gabrilovich DI. Myeloid-derived suppressor cells in the era of increasing myeloid cell diversity. Nat Rev Immunol. 2021;21(8):485–498. doi:10.1038/s41577-020-00490-y.
- Terme M, Pernot S, Marcheteau E, Sandoval F, Benhamouda N, Colussi O, Dubreuil O, Carpentier AF, Tartour E, Taieb J. VEGFA-VEGFR pathway blockade inhibits tumor-induced regulatory T-cell proliferation in colorectal cancer. Cancer Res. 2013;73:539–549. doi:10.1158/0008-5472.CAN-12-2325.
- Guo C, Manjili MH, Subjeck JR, Sarkar D, Fisher PB, Wang X-Y. Therapeutic cancer vaccines: past, present, and future. Adv Cancer Res. 2013;119:421–475. doi:10.1016/B978-0-12-407190-2.00007-1.
- Sharma P, Allison JP. The future of immune checkpoint therapy. Science. 2015;348:56–61. doi:10.1126/science.aaa8172.
- Gatti-Mays ME, Redman JM, Collins JM, Bilusic M. Cancer vaccines: enhanced immunogenic modulation through therapeutic combinations. Hum Vaccin Immunother. 2017;13:2561–2574. doi:10.1080/21645515.2017.1364322.
- McNeel DG. Therapeutic cancer vaccines: how much closer are we? BioDrugs. 2018;32:1–7. doi:10.1007/s40259-017-0257-y.
- Maj E, Papiernik D, Wietrzyk J. Antiangiogenic cancer treatment: the great discovery and greater complexity (review). Int J Oncol. 2016;49:1773–1784. doi:10.3892/ijo.2016.3709.
- Figlin RA, Tannir NM, Uzzo RG, Tykodi SS, Chen DYT, Master V, Kapoor A, Vaena D, Lowrance W, Bratslavsky G, et al. Results of the ADAPT phase 3 study of rocapuldencel-T in combination with sunitinib as first-line therapy in patients with metastatic renal cell carcinoma. Clin Cancer Res. 2020;26:2327–2336. doi:10.1158/1078-0432.CCR-19-2427.
- Rini BI, Stenzl A, Zdrojowy R, Kogan M, Shkolnik M, Oudard S, Weikert S, Bracarda S, Crabb SJ, Bedke J, et al. IMA901, a multipeptide cancer vaccine, plus sunitinib versus sunitinib alone, as first-line therapy for advanced or metastatic renal cell carcinoma (IMPRINT): a multicentre, open-label, randomised, controlled, phase 3 trial. Lancet Oncol. 2016;17:1599–1611. doi:10.1016/S1470-2045(16)30408-9.
- Bose A, Taylor JL, Alber S, Watkins SC, Garcia JA, Rini BI, Ko JS, Cohen PA, Finke JH, Storkus WJ. Sunitinib facilitates the activation and recruitment of therapeutic anti-tumor immunity in concert with specific vaccination. Int J Cancer. 2011;129:2158–2170. doi:10.1002/ijc.25863.
- Farsaci B, Higgins JP, Hodge JW. Consequence of dose scheduling of sunitinib on host immune response elements and vaccine combination therapy. Int J Cancer. 2012;130:1948–1959. doi:10.1002/ijc.26219.
- Jaini R, Rayman P, Cohen PA, Finke JH, Tuohy VK. Combination of sunitinib with anti-tumor vaccination inhibits T cell priming and requires careful scheduling to achieve productive immunotherapy. Int J Cancer. 2014;134:1695–1705. doi:10.1002/ijc.28488.
- Draghiciu O, Nijman HW, Hoogeboom BN, Meijerhof T, Daemen T. Sunitinib depletes myeloid-derived suppressor cells and synergizes with a cancer vaccine to enhance antigen-specific immune responses and tumor eradication. Oncoimmunology. 2015;4:e989764. doi:10.4161/2162402X.2014.989764.
- Huang Y, Yuan J, Righi E, Kamoun WS, Ancukiewicz M, Nezivar J, Santosuosso M, Martin JD, Martin MR, Vianello F, et al. Vascular normalizing doses of antiangiogenic treatment reprogram the immunosuppressive tumor microenvironment and enhance immunotherapy. Proc Natl Acad Sci USA. 2012;109:17561–17566. doi:10.1073/pnas.1215397109.
- Voron T, Colussi O, Marcheteau E, Pernot S, Nizard M, Pointet A-L, Latreche S, Bergaya S, Benhamouda N, Tanchot C, et al. VEGF-A modulates expression of inhibitory checkpoints on CD8+ T cells in tumors. J Exp Med. 2015;212:139–148. doi:10.1084/jem.20140559.
- Finke JH, Rini B, Ireland J, Rayman P, Richmond A, Golshayan A, Wood L, Elson P, Garcia J, Dreicer R, et al. Sunitinib reverses type-1 immune suppression and decreases T-regulatory cells in renal cell carcinoma patients. Clin Cancer Res. 2008;14:6674–6682. doi:10.1158/1078-0432.CCR-07-5212.
- Adotevi O, Pere H, Ravel P, Haicheur N, Badoual C, Merillon N, Medioni J, Peyrard S, Roncelin S, Verkarre V, et al. A decrease of regulatory T cells correlates with overall survival after sunitinib-based antiangiogenic therapy in metastatic renal cancer patients. J Immunother. 2010;33:991–998. doi:10.1097/CJI.0b013e3181f4c208.
- Fujimura T, Ring S, Umansky V, Mahnke K, Enk AH. Regulatory T cells stimulate B7-H1 expression in myeloid-derived suppressor cells in ret melanomas. J Invest Dermatol. 2012;132:1239–1246. doi:10.1038/jid.2011.416.
- Serafini P, Mgebroff S, Noonan K, Borrello I. Myeloid-derived suppressor cells promote cross-tolerance in B-cell lymphoma by expanding regulatory T cells. Cancer Res. 2008;68:5439–5449. doi:10.1158/0008-5472.CAN-07-6621.
- Schlecker E, Stojanovic A, Eisen C, Quack C, Falk CS, Umansky V, Cerwenka A. Tumor-infiltrating monocytic myeloid-derived suppressor cells mediate CCR5-dependent recruitment of regulatory T cells favoring tumor growth. J Immunol. 2012;189:5602–5611. doi:10.4049/jimmunol.1201018.
- Farsaci B, Donahue RN, Coplin MA, Grenga I, Lepone LM, Molinolo AA, Hodge JW. Immune consequences of decreasing tumor vasculature with antiangiogenic tyrosine kinase inhibitors in combination with therapeutic vaccines. Cancer Immunol Res. 2014;2:1090–1102. doi:10.1158/2326-6066.CIR-14-0076.
- Abou Khouzam R, Brodaczewska K, Filipiak A, Zeinelabdin NA, Buart S, Szczylik C, Kieda C, Chouaib S. Tumor hypoxia regulates immune escape/invasion: influence on angiogenesis and potential impact of hypoxic biomarkers on cancer therapies. Front Immunol. 2021;11:613114. doi:10.3389/fimmu.2020.613114.
- McDonald PC, Chafe SC, Dedhar S. Overcoming hypoxia-mediated tumor progression: combinatorial approaches targeting pH regulation, angiogenesis and immune dysfunction. Front Cell Dev Biol. 2016;4:27. doi:10.3389/fcell.2016.00027.
- Jung K, Heishi T, Khan OF, Kowalski PS, Incio J, Rahbari NN, Chung E, Clark JW, Willett CG, Luster AD, et al. Ly6Clo monocytes drive immunosuppression and confer resistance to anti-VEGFR2 cancer therapy. J Clin Invest. 2017;127:3039–3051. doi:10.1172/JCI93182.
- Jung K, Heishi T, Incio J, Huang Y, Beech EY, Pinter M, Ho WW, Kawaguchi K, Rahbari NN, Chung E, et al. Targeting CXCR4-dependent immunosuppressive Ly6Clow monocytes improves antiangiogenic therapy in colorectal cancer. Proc Natl Acad Sci U S A. 2017;114:10455–10460. doi:10.1073/pnas.1710754114.
- Dolcetti L, Peranzoni E, Ugel S, Marigo I, Fernandez Gomez A, Mesa C, Geilich M, Winkels G, Traggiai E, Casati A, et al. Hierarchy of immunosuppressive strength among myeloid-derived suppressor cell subsets is determined by GM-CSF. Eur J Immunol. 2010;40:22–35. doi:10.1002/eji.200939903.
- Krusch M, Salih J, Schlicke M, Baessler T, Kampa KM, Mayer F, Salih HR. The kinase inhibitors sunitinib and sorafenib differentially affect NK cell antitumor reactivity in vitro. J Immunol. 2009;183:8286–8294. doi:10.4049/jimmunol.0902404.