
ABSTRACT
Immune checkpoint blockade (ICB) therapy, while groundbreaking, must be improved to promote enhanced durable responses and to prevent the development of treatment-refractory disease. Cancer therapies that engage, enable, and expand the antitumor immune response will likely require rationally designed combination strategies. Targeting multiple immunosuppressive pathways simultaneously may provide additional therapeutic benefit over singular targeting. We therefore hypothesized that the use of two molecules which inhibit three independent, but overlapping, pathways (TIGIT:CD155, PD-1/PD-L1, and TGFβ) would provide significant antitumor efficacy in the syngeneic ICB resistant colorectal tumor model MC38 expressing human carcinoembryonic antigen (CEA) in CEA transgenic mice. This novel combination treatment strategy has significant antitumor activity and survival benefit in two models of murine carcinomas, MC38-CEA (CRC) and TC1 (HPV+ lung carcinoma). MC38-CEA mice that responded to αTIGIT and bintrafusp alfa combination therapy generated memory responses and were protected from rechallenge. These effects were dependent on CD4+ and CD8+ T cells, as well as increased immune infiltration into the TME. This combination induced production of tumor-specific CD8+ T cells, and an increase in activation and cytotoxicity resulting in an overall activated immune landscape in the tumor. Data presented herein demonstrate the αTIGIT and bintrafusp alfa combination has efficacy across multiple tumor models, including the checkpoint-resistant model of murine colon carcinoma, MC38-CEA and the HPV+ model TC-1.
Introduction
Over the last several decades, multiple barriers to successful antitumor immunity have been identified, including signals that drive an activating versus suppressive immune response.Citation1,Citation2 Upon engagement of immune cells, parallel costimulatory and coinhibitory programs are activated to finely tune the response. Following identification of the first checkpoint molecule, CTLA-4,Citation3 multiple additional crucial regulators of the T cell immune response have been identified, including but not limited to programmed cell death-1/programmed cell death ligand 1 (PD-1/PD-L1), TIGIT, TIM3, LAG3, and VISTA. There are multiple clinical trials investigating immune checkpoint blockade (ICB) agents across a myriad of indicationsCitation4 (clinicaltrials.gov). Despite success, albeit in limited capacity, there lies a significant unmet clinical need to treat patients suffering from ICB-refractory malignancies. Here, we strategically designed a combination treatment regimen targeting multiple immunosuppressive pathways using two novel molecules, the fusion protein bintrafusp alfa and a monoclonal antibody targeting TIGIT (αTIGIT).
Bintrafusp alfa is a bifunctional fusion protein composed of the extracellular domain of the human transforming growth factor β receptor II (TGFβRII or TGFβ ”trap”) fused via a flexible linker to the C-terminus of each heavy chain of an IgG1 antibody blocking anti-PD-L1.Citation5,Citation6 This molecule has been shown to sequester all three isoforms of TGFβ, and this trap function is physically linked to PD-L1 blockade in the tumor microenvironment (TME).Citation7 In the EMT-6 breast and MC38 colorectal murine cancer models, bintrafusp alfa treatment resulted in superior tumor growth suppression and prolonged survival than treatment with anti-PD-L1 or TGF-β trap alone.Citation7 Furthermore, there have been several positive responses using bintrafusp alfa in patients with heavily pretreated advanced solid tumors.Citation6,Citation8,Citation9
TIGIT is an inhibitory receptor with expression restricted to T cells and natural killer (NK) cells, with highest expression found on regulatory T cells (Tregs).Citation10 CD155 is the dominant cognate receptor that interacts with the immunosuppressive receptor TIGIT, and the immunoactivating receptor CD226.Citation11 CD226 is to CD28 as TIGIT is to CTLA-4, with TIGIT binding to CD155 in an inhibitory fashion, at much greater affinity (1–3 nM), in comparison to the positive signaling moiety CD226 (115 nM).Citation12,Citation13 TIGIT, while constitutively expressed on Tregs, is found in low abundance on naïve cells and is significantly upregulated following antigenic stimulation of T cells. TIGIT can deliver inhibitory signals in a paracrine and autocrine fashion, through binding with CD155 and direct disruption of homodimerization of CD226, respectively.Citation14
TIGIT can interfere with the cancer immunity cycle in a variety of ways, including suppression of NKCitation12 and CD8+ T cell-mediated killing,Citation11 induction of immunosuppressive dendritic cells (DCs),Citation10 and skewing CD4+ and CD8+ T cell priming and differentiation to immunosuppressive phenotypes.Citation15,Citation16 Data pooled from the TCGA database reveals several human cancers that have increased expression of TIGIT including colon, cervical, ovarian, head and neck squamous cell carcinoma (HNSCC), acute myeloid leukemia, multiple myeloma, and non-small cell lung cancer (NSCLC). Taken together, TIGIT has emerged as a strategic target for next generation ICB therapy. As of this writing, there are 38 clinical trials investigating the efficacy of TIGIT across a myriad of indications, as monotherapy and in combination (clinicaltrials.gov).
MC38-CEA is a murine model of colon carcinoma transduced to express carcinoembryonic antigen (CEA), a well-established self and tumor-associated antigen.Citation17 Previous work completed by our group has demonstrated that the MC38-CEA colon carcinoma model is minimally responsive to monotherapy anti-PD-L1, with objective response rates of 12.5%.Citation18 We therefore sought to identify rationally designed combination treatments in this model.
We show for the first time that MC38-CEA tumors are highly responsive to treatment with αTIGIT and bintrafusp alfa in combination, and this treatment strategy provides immunologic memory and protection from tumor rechallenge. This combination therapy is dependent on CD4+ and CD8+ T cells for efficacy, as well as increasing immune cell infiltration into the TME. We observe increases in numerous immune cell subsets in the TME, with increased immune activation, migration, cytotoxicity, and tumor-specific T cells. Our results in the MC38-CEA model were further confirmed through tumor control in the HPV+ TC1 tumor model, demonstrating our combination therapy works across multiple indications. Thus, data presented herein provide rationale for the combination of two immuno-oncology agents consisting of αTIGIT and bintrafusp alfa to enhance antitumor immunity against murine models of colorectal and HPV+ malignancies.
Materials and methods
Experimental reagents
αTIGIT (anti-muTIGIT, 18G10) is a murinized IgG2a monoclonal antibody targeting TIGIT. Delivery of αTIGIT, unless otherwise noted, is 125 µg administered intraperitoneally (i.p.) on days 7, 14, and 21. Bintrafusp alfa is a bifunctional fusion protein composed of the extracellular domain of the human transforming growth factor β receptor II (TGFβRII or TGFβ ”trap”) fused via a flexible linker to the C-terminus of each heavy chain of an IgG1 antibody blocking anti-PD-L1.Citation6,Citation19,Citation20 Delivery of bintrafusp alfa, unless otherwise noted, is 492 µg delivered i.p. on days 7, 9, and 11. The dose used in murine studies of αTIGIT and bintrafusp alfa are the human equivalent of 5 mg/kg and 20 mg/kg, respectively. αTIGIT and bintrafusp alfa were obtained from EMD Serono (Rockland, Massachusetts, USA) through a Cooperative Research and Development Agreement (CRADA) with the National Cancer Institute (NCI), and National Institutes of Health (NIH) (Bethesda, Maryland, USA).
Cell lines
MC38-CEA is a murine model of colon carcinoma transduced to express carcinoembryonic antigen (CEA), a well-established self and tumor-associated antigenCitation17 and were generated and maintained in our laboratory as previously described.Citation21 The TC1 cell line was a gracious gift from Dr. T.C. Wu (Johns Hopkins University; Baltimore, Maryland, USA).Citation22 All cell lines were passaged less than 6 months, confirmed Mycoplasma free, and cultured at 37°C with 5% CO2.
Animals and tumor models
Mice were housed in microisolator cages under specific pathogen-free conditions. A breeding pair of C57BL/6 CEA-transgenic (Tg) mice were graciously provided by Dr. John Shively (Beckman Research Institute; City of Hope National Medical Center, Duarte, California, USA) and were bred and maintained at the National Institutes of Health. These animals are homozygous for CEA and are used as a self-antigen model.Citation23,Citation24 All animal studies were approved and conducted in accordance with an Institutional Animal Care and Use Committee (IACUC)‒approved animal protocol (#LTIB-38 and #LTIB-57), and utilizing ARRIVE reporting guidelines.Citation25
For the MC38-CEA model, 8–16-week-old female C57BL/6 CEA-Tg (referred to as CEA.Tg henceforth) mice were inoculated with 3 × 10⁵ MC38-CEA tumor cells subcutaneously (s.c.) in the right flank. For the TC1 model, 8–16-week-old female C57BL/6 mice were inoculated with 5 × 10⁴ TC1 tumor cells subcutaneously in the right flank. Treatment initiation occurred on day 7, or when mean tumor volume was between 50 and 100mm3. Where indicated, MC38-CEA and TC1 tumor-bearing mice were treated three times with 125 µg αTIGIT, delivered i.p. one week apart, and three doses of 492 µg bintrafusp alfa i.p., every other day (graphical representation of experimental design, see and ). For depletion studies, anti-CD4 (GK1.5, 100 µg; BioXcell; Lebanon, New Hampshire, USA) and anti-CD8 (2.43, 100 µg; BioXcell) antibodies were administered i.p. on days 3, 4, 5, 12, 19, and 26 post-tumor inoculation. The anti-NK1.1 (PK136, 100 µg; BioXcell) antibody was administered i.p. on days 3, 4, 5, 8, 11, 14, 17, 20, 23, and 26 post-tumor inoculation (graphical representation of experimental design, see ). For tumor rechallenge studies, naïve control mice and previously challenged tumor-free mice were inoculated with 1 × 10⁶ MC38-CEA cells s.c. in the opposite flank 60 days after initial tumor inoculation, roughly 40 days after cessation of treatment (graphical representation of experimental design, see ).
For all animal tumor studies, tumor growth was monitored biweekly and animal weight at least once per week. Termination of studies is indicated in figures, or when animals reached ethical limit (2000 mm3, or 20 mm in length or width).
Serum cytokine analyses
Serum collection was performed on day 0, prior to tumor inoculation, and at indicated time points (i.e., day 14 and end of study). Serum IL-1β, IL-2, IL-5 and TNFα were quantified using the murine V-Plex Proinflammatory Panel 1 kit and MESO QuickPlex SQ 120 (Meso Scale Diagnostics; Rockville, Maryland, USA), according to the manufacturer’s instructions. TGFβ levels were quantified using mouse TGFβ1 Quantikine ELISA kit according to the manufacturer’s instructions (R&D Systems; Minneapolis, Minnesota, USA). Data presented herein represent the change in cytokine, with each animal’s baseline levels subtracted from subsequent timepoints.
RNA analyses
Total RNA was isolated from indicated tumors at day 24 post-tumor inoculation using the RNeasy Mini kit (Qiagen; Germantown, Maryland, USA). NanoString nCounter® PanCancer Profiling Panel (NanoString Technologies; Seattle, Washington, USA) analysis was performed by the Genomics Laboratory, Frederick National Laboratory for Cancer Research (Frederick, Maryland, USA). Raw data (RCC) files were uploaded into nSolver analysis software. Treated samples were compared with control samples, and ratio fold-change data were exported to GraphPad Prism (San Diego, California, USA).
Common genes associated with immune cell adhesion/migration, immune activation, immune regulation, matrix remodeling/metastasis, myeloid compartment, cytokine and chemokine, tumor progression and tumor suppression as identified by NanoString and current literature are denoted. Common genes associated with cellular signaling pathways as identified by NanoString and current literature are denoted. Select curated genes were chosen based on NanoString data and included in a STRING analysis of protein–protein interactions (string-db.org;).Citation26
ELIspot
Spleens were harvested and processed individually into single-cell suspensions. 1 × 10⁶ splenocytes were plated onto 96-well plates previously coated with an IFNγ capture antibody (BD Cat# 551083). C57BL/6-CEA Tg splenocytes were stimulated with one of the following H2-Db- or H2-Kb-restricted peptides (10 µg/mL) for 18 hours: CEA526-533 (EAQNTTYL), CEA572-579 (GIQNSVSA), p15E (KSPWFTTL), and HIV-gag (SQVTNPANI). The CEA526-533, CEA572-579, p15E, and HIV-gag peptides were synthesized by CPC Scientific (Sunnyvale, California, USA). IFNγ spots were detected using the BD mouse IFNγ ELISPOT kit and developed using the BD ELISPOT AEC substrate set according to the manufacturer’s instructions (BD Biosciences; San Jose, California, USA). IFNγ spots were visualized and quantified using the CTL ImmunoSpot Analyzer (Cleveland, Ohio, USA).
Flow cytometry
Tumors were excised and mechanically dissociated to generate single-cell suspensions. Total cell number and viability (trypan blue) were calculated using the Cellometer 2000 (Nexcelom; Lawrence, Massachusetts, USA). The following murine antibodies from BioLegend (San Diego, California, USA) were used for flow cytometric staining: CD155-APC (Clone # TX56), PD-L1-BV785 (Clone # 10 F.9G2), Ly6G-BV421 (Clone # 1A8), CD11b-BV510 (Clone # M1/70), CD11c-APC-Cy7 (Clone # N418), F4/80-BV605 (Clone # BM8), CD3-PE-Cy5 (Clone # 145–2C11), CD226-FITC (Clone # 10E5), CD62L-BV785 (Clone # MEL-14), PD1-PE-Cy7 (Clone # RMP1-30), CD44-AF700 (Clone # IM7), CD4-PE-Cy5 (Clone # RM4-5), and CD155-APC (Clone # TX56). The following antibodies from BD Biosciences (Franklin Lakes, New Jersey, USA) were used for flow cytometric staining: CD226-BV650 (Clone # 10E5), Ly6C-FITC (Clone # AL-21), CD49b-BUV395 (Clone # HMα2), TIGIT-BV711 (Clone # 1 G9), B220-BV711 (Clone # RA3-6B2), LAG3-BV605 (Clone # C9B7W), CD45-PE (Clone # 30-F11). The following antibodies from Invitrogen (Waltham, Massachusetts, USA) were used for flow cytometric staining: CD8-SB645 (Clone # 53–6.7) and FoxP3-PE-Cy5.5 (Clone # FJK-16s). Live/Dead fixable aqua stain set was purchased from Thermo Fisher (Waltham, Massachusetts, USA). Intracellular staining was performed using the FoxP3/transcription factor kit (eBioscience; San Diego, California, USA). Cytometric data were acquired on a BD LSRFortessa (BD Biosciences) and analyzed using FlowJo 10.7.1 (TreeStar; Ashland, Oregon, USA).
Cell populations were gated on FSC × SSC discrimination, live:dead, CD45+ and then as followed: Regulatory T cells (CD3+, CD4+, FoxP3+); CD4+ T cells (CD3+, CD4+, FoxP3-); CD8+ T cells (CD3+, CD4-, CD8+); NK cells (CD3-, CD49b+); monocytic myeloid-derived suppressor cells (M-MDSCs) (CD3-, CD49b-, CD11b+, Ly6g-, Ly6C+); polymorphonuclear MDSCs (PMN-MDSCs) (CD3-, CD49b-, CD11b+, Ly6G+, Ly6C-); macrophages (CD3-, F4/80+, CD11b+) and DCs (CD3-, CD49b-, F4/80, CD11c+).
Statistical analyses
Student t test was used to compare two groups. One-way or two-way ANOVA was performed to compare more than two groups with Tukey’s post hoc analysis for correction. Log-rank (Mantel-Cox) test was used to determine survival proportions. Two-way ANOVA was performed to compare significant gene changes. P values less than 0.05 were considered significant with * = p < .05, ** = p < .01, *** = p < .005, *** = p < .0001. Error bars in figures represent mean ± SEM. GraphPad Prism 9.0 was utilized for analyses.
Results
TIGIT, PD-1, and TGFβ are candidate targets for combination therapy in the MC38-CEA murine colorectal tumor model
Traditional ICB therapy exploits inhibitory receptors that are upregulated on tumor infiltrating lymphocytes (TIL). However, not all TILs express these canonical exhaustion markers that are subsequently targeted using monoclonal antibodies (mAbs). To determine feasible targets in our murine models, we employed the MC38-CEA tumor cell line. MC38-CEA, a murine colon carcinoma cell line transduced to express CEA, has little responsiveness to checkpoint blockade therapy.Citation1 Female CEA.Tg mice were inoculated with MC38-CEA cells and resulting tumors and spleens were harvested 24 days after instillation (). Expression of TIGIT and PD-1 on TILs, as well as peripheral lymphocytes in the spleen, were assessed (). Compared to peripheral lymphocytes, a significant subset of tumor infiltrating Tregs (p < .0001), CD4+ (p < .05), and CD8+ (p < .01) T cells co-express PD-1 and TIGIT (, quantified in ). PD-1+ CD4+ (p < .0001) and CD8+ (p < .0001) T cells that do not co-express TIGIT were more abundant in the tumor than in the spleen while no significant changes in the frequency of PD-1+ TIGIT− subset were observed in the Treg compartment (, quantified in ). The frequencies of PD-1− TIGIT+ CD4+ and CD8+ remained unchanged between the tumor and the periphery whereas the frequency of Tregs that were single positive for TIGIT was significantly higher in the tumor than the spleen (p < .0001; , quantified in ).
Figure 1. TIGIT and PD-1 are significantly upregulated on tumor infiltrating CD4+, regulatory, and CD8+ T cells while TGFβ level is increased in plasma of tumor-bearing mice. (a) Graphical representation of experimental design. Representative flow cytometric plots of frequency of TIGIT and PD-1 positivity on tumor infiltrating (n = 14) and splenic (n = 14) (b) regulatory T cells, (c) CD4+ T cells, and (d) CD8+ T cells. Quantification of the frequency of (e) PD-1+ TIGIT+, (f) PD-1+ TIGIT-, (g) PD-1- TIGIT+ regulatory, CD4+, and CD8+ T cells infiltrating into the tumor (red symbols) and those found in the periphery (black symbols). Frequency is calculated on percent of parent populations. Quantification of expression levels of (h) PD-L1 and (i) CD155 on tumor and tumor-infiltrating immune cells. (j) ELISA quantification of plasma TGFβ levels in MC38 tumor-bearing mice 24 days post-tumor inoculation. * = p < .05, ** = p < .01, *** = p < .005, **** = p < .0001.
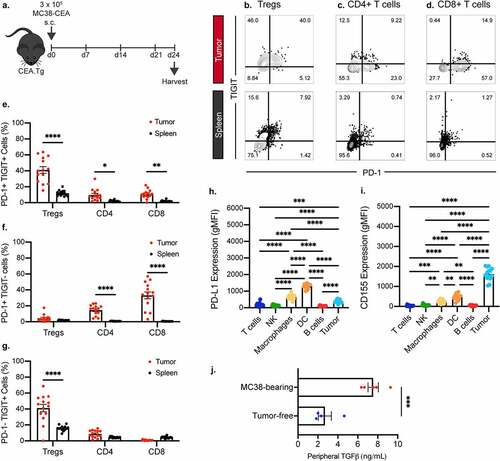
Co-inhibitory receptors require cognate ligand binding to exert suppressive functions. We next investigated the expression of TIGIT and PD-1 ligands, CD155Citation11 and PD-L1,Citation27 respectively. Flow cytometric analysis demonstrated that in the TME, the DCs had the highest PD-L1 positivity, followed by macrophages and tumor cells (). Meanwhile, CD155 expression was highest in the MC38 tumor cells, with significant expression in the macrophages and DCs as well ().
In addition to co-inhibitory ligands, soluble immunosuppressive factors, such as TGFβ, are produced in the TME to dampen the immune response.Citation28 We examined the TGFβ levels in the peripheral blood of tumor-bearing and tumor-free animals. Tumor-bearing mice had significant 3.5-fold increase in peripheral TGFβ (p < .005) compared to their tumor-free counterparts ().
Our data indicate that intratumoral effector T cells in the MC38-CEA model are likely inhibited through the TIGIT/CD155, PD-1/PD-L1, and TGFβ pathways. Therefore, we sought to rationally design a combination treatment strategy to disrupt these axes of immune suppression through use of a mAb targeting TIGIT (αTIGIT) and a bifunctional molecule that traps TGFβ and blocks PD-L1, bintrafusp alfa.Citation6,Citation19,Citation20
αTIGIT and bintrafusp alfa combination therapy resulted in significant antitumor activity, improved survival, and increased immunologic memory in the MC38-CEA tumor model
We first sought to determine the in vivo efficacy of αTIGIT + bintrafusp alfa in combination utilizing the MC38-CEA tumor model (). αTIGIT had no antitumor activity when utilized as monotherapy (), while treatment with bintrafusp alfa alone resulted in 20% of the animals being tumor free. Treatment with the combination of αTIGIT and bintrafusp alfa, however, did significantly control tumors (p = .0073; ). Fifty percent of animals treated with αTIGIT + bintrafusp alfa were tumor-free 60 days post-tumor inoculation (). This combination treatment resulted in increased overall survival of MC38-CEA tumor-bearing mice (), extending survival from 28 days in untreated controls to 49.5 days in animals treated with αTIGIT + bintrafusp alfa (p = .0227; ). Treatment with either αTIGIT or bintrafusp alfa alone did not result in a significant increase in overall survival.
Figure 2. αTIGIT and bintrafusp alfa combination therapy provides significant antitumor activity, increases survival, and provides immunologic memory. (a) Graphical representation of experimental design for MC38-CEA tumor studies. (b) MC38-CEA tumor growth curves and (c) survival proportions of CEA.Tg mice treated with αTIGIT (red line; n = 10), bintrafusp alfa (blue line; n = 10), αTIGIT + bintrafusp alfa (purple line; n = 10) or untreated controls (black line; n = 10). Numbers in parentheses indicate median overall survival in days. Tumor-free mice (red line; n = 7) from (c) were rechallenged with MC38-CEA cells and monitored for (d) tumor progression and (e) overall survival in comparison to naïve mice (black line; n = 10).
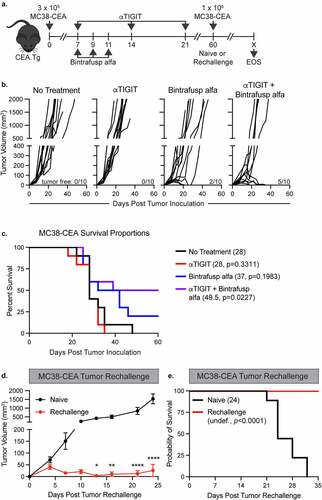
Because we observed 50% of animals treated with αTIGIT + bintrafusp alfa can eliminate MC38-CEA tumors, we next determined if this combination therapy provided protection from tumor rechallenge. Tumor-free animals were inoculated with an MC38-CEA tumor cell burden 3.5 times higher than the initial challenge in the opposite flank and tumor growth was monitored biweekly (). Animals that had previously received αTIGIT + bintrafusp alfa were protected from tumor rechallenge, with significantly reduced tumor volume (p < .0001; ). All animals facing rechallenge were protected from lethal tumor burden, as indicated by an increased overall survival in comparison to naïve control mice (). These data indicate that αTIGIT + bintrafusp alfa provide immunologic memory, allowing animals that initially responded to treatment to remain tumor free following high-dose rechallenge.
To determine if both components of the bifunctional bintrafusp alfa were required for the antitumor activity observed, we compared a mutated version of the molecule, where sequestration of TGFβ is maintained but binding of PD-L1 is abrogated (online supplemental figure 1A; designated bintrafusp alfa-Mut). Consistent with previous results, monotherapy treatment with αTIGIT or bintrafusp alfa had no antitumor activity, while αTIGIT + bintrafusp alfa combination therapy resulted in significant antitumor activity compared to the control cohort (p = .0259) with 50% of mice rendered tumor free at the end of the study (online supplemental figure 1B). Importantly, mice treated with the combination of αTIGIT + bintrafusp alfa-Mut did not control tumor burdens, indicating that both sequestration of TGFβ and binding of PD-L1 at the tumor site are critical. These results are consistent with current literature.Citation29
Antitumor activity and increase in overall survival from treatment with αTIGIT and bintrafusp alfa are dependent on CD4+ and CD8+ T cells
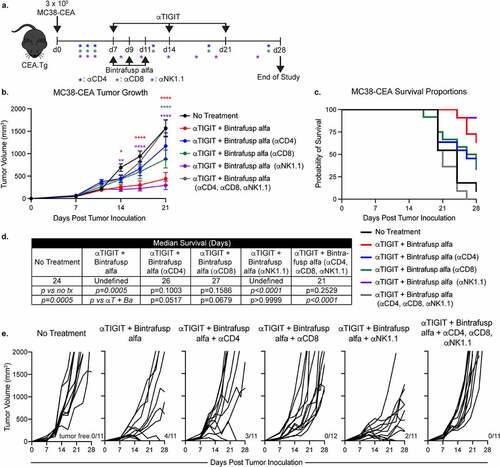
ICB therapy can exert its effects on immune cells, tumor cells directly, or a combination of the two.Citation4 To identify the cell types required for the antitumor activity observed with αTIGIT and bintrafusp alfa combination therapy we utilized immune cell depletion studies. MC38-CEA tumor-bearing mice were depleted separately of CD4+ T cells, CD8+ T cells, NK cells, or all in combination, while simultaneously receiving αTIGIT and bintrafusp alfa (). Consistent with our previous studies, animals in the αTIGIT + bintrafusp alfa cohort had significantly reduced tumor volume in comparison to untreated control mice (p < .0001; , red line; ), as well as an increased frequency of tumor-free mice at end of study (4/11; ). When the CD4+ T cell compartment was depleted, the antitumor activity provided by our doublet therapy was lost, as indicated by similar tumor volume to untreated mice (, blue line; ). Depletion of the CD8+ T cell compartment resulted in a failure to control tumor volumes early in tumor progression, although not to the extent as the untreated group by day 21 (p < .0001; , green line; ). TIGIT expression is highest on T cells and NK cells, and it was therefore unexpected that the antitumor activity observed with combination treatment of αTIGIT and bintrafusp alfa was upheld after depletion of NK cells (p < .0001; , purple line; ). To determine if there were additional cell types that contribute to the effect of αTIGIT and bintrafusp alfa combination treatment, MC38-CEA tumor bearing animals were depleted of CD4+, CD8+ and NK cells (gray line), which resulted in rapid tumor progression ( b and e). The survival advantage previously observed with our combination treatment was abrogated following depletion of CD4+ T cells (blue line), CD8+ T cells (green line) and combination of CD4+, CD8+ and NK cells (gray line) ( c and d). Increase in overall survival was upheld in animals treated with αTIGIT and bintrafusp alfa combination therapy (red line), and when NK cells were depleted (purple line) ( c and d). The median survival of CD4+ T cell and CD8+ T cell-depleted groups was less in comparison to the αTIGIT and bintrafusp alfa group (p = .0517 and p = .0679, respectively; ). These data suggest the mechanism of action exerted by this combination therapy lies within the T cell compartment, with little contribution from NK cells.
Figure 3. Antitumor activity and increase in overall survival from treatment with αTIGIT and bintrafusp alfa is dependent on CD4+ and CD8+ T cells. (a) Graphical representation of experimental design. (b) MC38-CEA tumor growth curves and (c) survival proportions of CEA.Tg animals treated with αTIGIT + bintrafusp alfa (red line; n = 11), αTIGIT + bintrafusp alfa depleted of CD4+ T cells (blue line; n = 11), αTIGIT + bintrafusp alfa depleted of CD8+ T cells (green line; n = 12), αTIGIT + bintrafusp alfa depleted of NK cells (purple line; n = 11), αTIGIT + bintrafusp alfa depleted of CD4+, CD8+ and NK cells (gray line; n = 11), and untreated animals (black line; n = 11). (d) Median survival of each treatment group. (e) Individual animal tumor growth rates of each treatment group. Numbers at the bottom right of tumor growth rate plots indicate tumor-free mice. * = p < .05, ** = p < .01, *** = p < .005, *** = p < .0001.
αTIGIT and bintrafusp alfa combination treatment increases immune cell infiltration to the tumor microenvironment
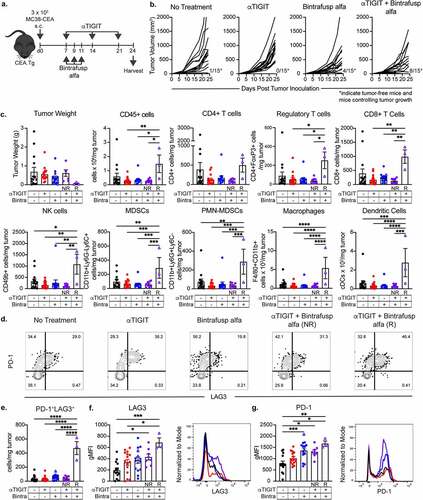
One of the failures of checkpoint blockade therapy can be attributed to an inability of immune cells to access the TME and, consequently, an inability to exert effector function.Citation30 We therefore sought to determine the effect(s) of combination treatment with αTIGIT and bintrafusp alfa on the TME. Because we observed 50% of animals treated with αTIGIT and bintrafusp alfa in combination were tumor free at the end of study, we next interrogated factors associated with response or resistance to therapy. MC38-CEA tumor-bearing mice were treated with αTIGIT and bintrafusp alfa, alone and in combination (). At end of study, animals treated with αTIGIT and bintrafusp alfa had significantly smaller tumor volumes in comparison to untreated animals (p < .0001), and those that received either agent as monotherapy (). Tumor volume was monitored biweekly until day 24, at which point tumors were excised and the TME was interrogated via flow cytometry. On day 24, 5/15 (33.3%) of the animals in the combination treatment group were tumor-free, 3/15 (20%) of animals were controlling tumor growth, as indicated by tumors smaller than 300 mm3, and 7/15 (46.7%) animals were incapable of controlling tumor growth. Heterogeneity in responses to ICB by genetically identical tumor-bearing mice has been reported and utilized to identify possible biomarkers that can be used to predict response to ICB.Citation31,Citation32 Hence, the αTIGIT and bintrafusp alfa combination treatment group was then further categorized into animals that responded to therapy (~54%) [termed ‘Responders’ – open purple triangles (R)] and those that were resistant to therapy (~46%) [termed ‘Non-Responders’ – closed purple circles (NR)]. We observed the smallest tumors by volume and weight from the αTIGIT + bintrafusp alfa Responders cohort, which also had the greatest infiltration of immune cells into the tumor (). This group had significant increases in CD45+ cells, regulatory and CD8+ T cells, NK cells, M-MDSCs, PMN-MDSCs, macrophages, and DCs (). Due to the global increase in all immune cell subsets queried, there was not a significant increase in the CD8:Treg ratio between treatment groups (online supplemental figure 2D).
Figure 4. αTIGIT and bintrafusp alfa combination treatment increases immune cell infiltration to the tumor microenvironment. (a) Graphical representation of experimental design. (b) MC38-CEA tumor growth curves of CEA.Tg animals treated with αTIGIT (n = 15), bintrafusp alfa (n = 15), αTIGIT + bintrafusp alfa (n = 15) or untreated animals (n = 15). Numbers at bottom right of graphs indicate tumor-free mice and mice responding to therapy that possess tumors less than 300mm3 at end of study (termed ‘Responders’). (c) At day 24 post tumor inoculation, tumors from mice treated with αTIGIT (n = 15), bintrafusp alfa (n = 14), αTIGIT + bintrafusp alfa Non-Responders (n = 8), αTIGIT + bintrafusp alfa Responders (n = 3) and untreated animals (n = 14) were excised and tumor weight, CD45+ cells/mg of tumor, and indicated immune cell subsets were quantified via flow cytometry and normalized to recorded tumor weight. (d) Gated on CD8+ T cells, evaluation of PD-1 and LAG3 dual positive cells from indicated treatment groups. (e) Quantification of PD-1+LAG3+ CD8+ T cells per mg of tumor. Quantification of expression levels of (f) LAG3 and (g) PD-1 on CD8+ T cells and representative histograms from MC38-CEA tumor-bearing mice treated with αTIGIT (red line), bintrafusp alfa (blue line), αTIGIT + bintrafusp alfa Responders (purple line) and untreated (black line). NR = Non-Responders (mice with tumor volumes greater than 300mm3 at day 24, closed symbols). R = Responders (mice with tumor volumes less than 300mm3 at day 24, open triangles). Bintra = bintrafusp alfa. gMFI = geometric mean fluorescence intensity. * = p < .05, ** = p < .01, *** = p < .005, *** = p < .0001.
We observed a significant reduction in TIGIT expression on CD4+, regulatory, and CD8+ T cells, as well as NK cells when αTIGIT was administered, suggesting sufficient blocking of this receptor is achieved in vivo (online supplemental figure 2A). Recent evidence in melanoma patients suggests a high TIGIT:CD226 ratio on Tregs is an indicator of poor response to ICB.Citation33 Indeed, we observed a significant reduction in the bioavailable TIGIT-to-CD226 ratio on tumor infiltrating Tregs in all groups receiving αTIGIT, as monotherapy or in combination (p < .0001; online supplemental figure 2C).
It has been reported previously that the therapeutic benefit of TIGIT blockade is dependent upon the sustained positive interaction of CD226 with its cognate receptor shared with TIGIT, CD155.Citation14 In our model, we did not observe any substantial alterations in CD226 expression on CD4+, regulatory and CD8+ T cells, or NK cells (online supplemental figure 2B). CD155 expression was not significantly altered on M-MDSCs, PMN-MDSCs, macrophages, NK cells or DCs (online supplemental figure 2E).
Upon closer inspection of CD8+ T cells, we looked at expression patterns of two prototypical exhaustion markers, PD-1 and LAG3 (). Representative flow cytometric plots examining co-expression of PD-1 and LAG3 revealed a substantial population of PD-1+LAG3+ CD8+ T cells infiltrating the tumor in all groups (). However, αTIGIT + bintrafusp alfa Responders had the highest frequency of dual-positive CD8+ T cells co-expressing PD-1 and LAG3 per mg of tumor in comparison to all other treatment groups (p < .0001; ). Not only were PD-1+LAG3+ CD8+ T cells more abundant in αTIGIT + bintrafusp alfa Responders, the expression levels of LAG3 and PD-1 were also significantly higher as determined by geometric mean fluorescence intensity (gMFI) (p = .0009), ; and (p = .0016), .
αTIGIT + bintrafusp alfa Responders have an altered peripheral cytokine and T cell landscape
To investigate the role of αTIGIT + bintrafusp alfa combination treatment on host cytokine production, serum was collected from MC38-CEA tumor-bearing mice prior to tumor instillation, and at indicated times throughout the course of treatment with αTIGIT and bintrafusp alfa (). αTIGIT + bintrafusp alfa Responders had significantly higher peripheral levels of IL-1β (p = .0093), and significantly lower levels of IL-2 in comparison to other treatment groups (Responders vs. Non-Responders p = .0014; Responders vs. No Treatment p = .0184; , 5b). Interestingly, αTIGIT + bintrafusp alfa Non-Responders had elevated peripheral levels of IL-5 (p = .0109) and TNFα (p = .0494) in comparison to Responders, indicating a potential mechanism of action for why this group failed to respond to therapy ( c and d). We also observed a significant decrease in TGFβ in the cohort of animals treated with αTIGIT + bintrafusp alfa that responded to treatment at day 14 post-tumor inoculation (p = .0329), .
Figure 5. αTIGIT + bintrafusp alfa Responders have an altered peripheral cytokine and T cell landscape. Serum was collected from MC38-CEA tumor-bearing mice treated with αTIGIT (red symbols; n = 10), bintrafusp alfa (blue symbols; n = 19), αTIGIT + bintrafusp alfa Non-Responders (closed purple symbols; n = 6), αTIGIT + bintrafusp alfa Responders (open purple triangles; n = 4) and untreated animals (black symbols; n = 10) and assessed for change in peripheral (a) IL-1β, (b) IL-2, (c) IL-5, (d) TNFα and (e) TGFβ. Change is calculated by subtracting baseline serum levels from day 14 for IL-1β, IL-2, IL-5, and TNFα, and at day 14 and when animals reach ethical limits (tumors > 2000 m3) for TGFβ. Splenocytes were isolated from MC38-CEA tumor-bearing mice on (f) day 17 and (g) day 24 and p15E specific CD8+ T cells were identified via ELIspot (left) and relationship to tumor volume was determined (right). Bintra = bintrafusp alfa. EOS = end of study (tumors > 2000mm3). NR = Non-Responders. R = Responders. No TX = No Treatment. * = p < .05, ** = p < .01, *** = p < .005, *** = p < .0001.
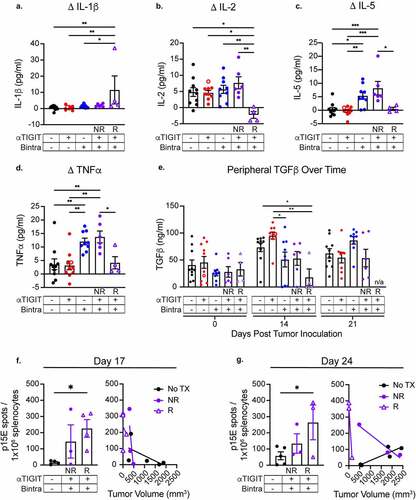
To determine if there are increased frequencies of tumor antigen-specific CD8+ T cells, splenocytes were isolated from MC38-CEA tumor-bearing mice on day 17 () and day 24 () post-tumor inoculation and co-incubated with p15E, a common MHC class I restricted retroviral protein expressed in the MC38 tumor cell line. Animals that responded to treatment with αTIGIT + bintrafusp alfa had significant increases in the number of p15E-reactive CD8+ T cells in comparison to untreated animals on both day 17 and day 24 (p = .0443, left panel; p = .0267, right panel). Additionally, the increased frequency of tumor-specific CD8+ T cells was inversely correlated with tumor volume, with the smallest tumors in the responding group possessing the most p15E-reactive T cells on day 17 and day 24 (Responders R2 = 0.9920), , right panel.
αTIGIT and bintrafusp alfa combination therapy result in significant antitumor activity in the TC1 murine tumor model
As previously mentioned, TIGIT is upregulated on numerous human cancers, including human papillomavirus (HPV)‒associated malignancies. We therefore sought to determine if our combination therapy exhibits antitumor efficacy in the TC1 tumor model, a murine lung carcinoma transformed to express E6 and E7, the dominant oncolytic proteins of HPV16 (). At the end of study, mice that received αTIGIT and bintrafusp alfa in combination had significantly lower tumor burden in comparison to untreated mice, or mice that received αTIGIT or bintrafusp alfa as monotherapies (p < .0001; ). Together with the MC38-CEA data, this indicates that αTIGIT and bintrafusp alfa used in combination have significant antitumor activity in two distinct tumor models.
Figure 6. αTIGIT and bintrafusp alfa combination treatment results in antitumor activity in the TC-1 tumor model. (a) Graphical representation of experimental design for TC1 tumor studies. (b) TC1 tumor growth curves of C57BL/6 mice treated with αTIGIT (red line; n = 9), bintrafusp alfa (blue line; n = 8), αTIGIT + bintrafusp alfa (purple line; n = 9) or untreated controls (black line; n = 9). (c) A different set of mice were treated with the αTIGIT and bintrafusp alfa combination and on day 26 post tumor inoculation, tumors from mice treated with αTIGIT + bintrafusp alfa (n = 3) and untreated animals (n = 4) were excised and tumor weight and indicated immune cell subsets were quantified via flow cytometry and normalized to recorded tumor weight. (d) Quantification of CD8+ effector to Treg ratio. (e) Quantification of PD-1+LAG3+ CD8+ T cells per mg of tumor. Quantification of expression levels of (f) PD-1 and (g) LAG3 on CD8+ T cells. (h) Plasma was collected from untreated and αTIGIT + bintrafusp alfa-treated TC1 tumor-bearing mice on days 9, 16, and 23 post-tumor implantation and assessed for TGFβ. Bintra = bintrafusp alfa. EOS = end of study (tumors > 2000mm3). gMFI = geometric mean fluorescence intensity. * = p < .05, ** = p < .01, *** = p < .005, *** = p < .0001.
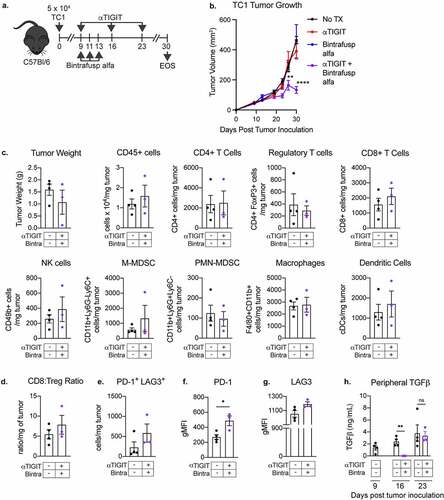
In another set of TC1-bearing mice treated with the αTIGIT and bintrafusp alfa combination (), tumors growth was monitored and on day 26 tumors were excised. The average tumor volume in the cohort that received the αTIGIT and bintrafusp alfa combination was significantly smaller than that in the untreated group (online supplemental figure 3A). The sample size did not allow for the differentiation of Responders from Non-Responders, which may explain why the flow cytometric analysis of TC1 tumors treated with αTIGIT + bintrafusp alfa did not show dramatic changes in immune infiltrates as that observed in the Responders in the MC38-CEA model. Nevertheless, we observed a trending increase of more than 30% in CD45+ cells, CD8+ T cells, NK cells, M-MDSCs, and DCs (). Because there were only slight changes in the immune cell subsets queried, a significant increase in the CD8:Treg ratio between groups was not observed ().
In the TC1 tumors treated with αTIGIT and bintrafusp alfa, we observed a significant reduction in TIGIT expression on CD4+ T cells (p = .0123) and a trending decrease in TIGIT expression in Treg cells, which were associated with the significant reduction in the bioavailable TIGIT-to-CD226 ratio on these tumor infiltrating cells (p = .0029 and p = .0459, respectively; online supplemental figure 3B-3C). However, we did not observe any changes in the TIGIT expression on tumor infiltrating CD8+ T cells (online supplemental figure 3B-3C). Similar to the MC38-CEA model, we did not observe any substantial alterations in CD226 expression on CD4+, regulatory and CD8+ T cells (online supplemental figure 3B-D) and in CD155 expression on MDSCs, macrophages, or DCs (online supplemental figure 3E) in the TC1 model.
The PD-1 and LAG3 expression on CD8 + T cells were examined (). Although not statistically significant, the αTIGIT + bintrafusp alfa combination treatment doubled the population of PD-1+LAG3+ CD8+ T cells infiltrating the tumor (). In addition, the combination treatment resulted in significantly higher expression level of PD-1 as determined by geometric mean fluorescence intensity (p = .0235), .
Analysis of the plasma collected at different time points showed that there was an incremental increase in peripheral TGFβ in the untreated animals (). On day 16, which was 3 days after the last bintrafusp alfa treatment, TGFβ levels decreased significantly in the animals treated with the αTIGIT + bintrafusp alfa combination when compared to the control (p = .0033; ). Because only one round of bintrafusp alfa was administered, peripheral TGFβ levels were back to the same level as the untreated cohort on day 23 ().
Differentially expressed genes following αTIGIT + bintrafusp alfa treatment
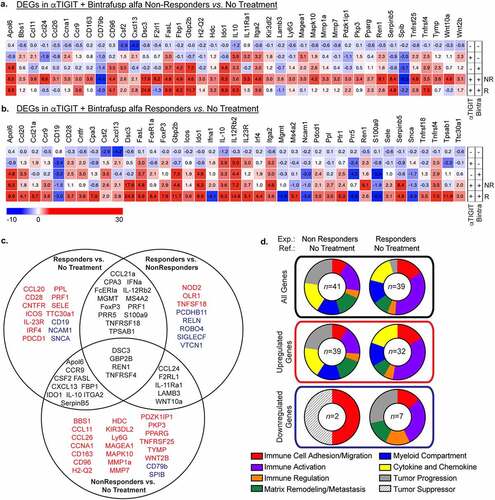
To identify potential mechanism(s) of action that predict response or resistance to αTIGIT + bintrafusp alfa combination therapy, we interrogated the transcriptomic landscape within the tumor of MC38-CEA tumor-bearing mice at day 24 post-tumor inoculation. Data presented herein represent differentially expressed genes (DEGs) in αTIGIT + bintrafusp alfa Non-Responders in comparison to untreated controls (), and DEGs in αTIGIT + bintrafusp alfa Responders in comparison to untreated controls (). The full list of DEGs that are altered at least 2-fold in either direction in comparison to the untreated control cohort is depicted in . We generated eight categories the DEGs fell under as they pertain to the immune profile, including genes associated with immune cell adhesion/migration (red), immune activation (purple), immune regulation (orange), matrix remodeling/metastasis (green), the myeloid compartment (blue), cytokine and chemokine (including receptors/ligands/soluble factors; yellow), tumor progression (gray), and tumor suppressors (white striped) (). When comparing DEGs between Non-Responders and No Treatment cohorts, the DEGs fell into the following categories in order of greatest to least prevalence: tumor progression (23%), cytokine and chemokine (18%), immune activation (18%), matrix remodeling/metastasis (14%), the myeloid compartment (14%), immune cell adhesion/migration (9%), and genes involved in immune regulation (4%) (, left side, top panel). Of these total genes, all DEGs were upregulated except for two, CD79b and Spib (). Of the DEGs in Responders versus No Treatment, the DEGs fell into the following categories in order of greatest to least abundance: immune activation (35%), immune cell adhesion/migration (16%), cytokine and chemokine (16%), the myeloid compartment (14%), matrix remodeling/metastasis (9%), tumor progression (7%), and immune regulation (5%) (, right side, top panel). Of total DEGs, upregulated genes in Responders versus No Treatment were found in immune activation (36%), cytokine and chemokine (19%), immune cell adhesion/migration (17%), the myeloid compartment (14%), with immune regulation and matrix remodeling/metastasis each making up percentages of less than 10% (; right side, middle panel). Importantly, the genes that support tumor progression were all downregulated in this cohort (; right side, bottom panel).
Figure 7. Differentially expressed genes following αTIGIT + bintrafusp alfa treatment. (a) Heatmap of significant differentially expressed genes between tumors from mice treated with αTIGIT + bintrafusp alfa Non-Responders in comparison to untreated animals as identified by the NanoString nCounter® PanCancer Pathways Panel. Mean fold change values are within each cell. (b) Heatmap of significant differentially expressed genes between tumors from mice treated with αTIGIT + bintrafusp alfa Responders in comparison to untreated mice as identified by the NanoString nCounter® PanCancer Pathways Panel. Mean fold change values are within each cell. Monotherapy treatment groups are included for reference (No Treatment n = 5; αTIGIT n = 5; bintrafusp alfa n = 6; αTIGIT + bintrafusp alfa Non-Responders n = 5; αTIGIT + bintrafusp alfa Responders n = 3). (c) Venn diagram of differentially expressed genes that are significant between αTIGIT + bintrafusp alfa Responders and untreated (left), αTIGIT + bintrafusp alfa Non-Responders and untreated (bottom), and αTIGIT + bintrafusp alfa Responders and αTIGIT + bintrafusp alfa Non-Responders (right). Genes in red are upregulated, genes in blue are downregulated. (d) Graphical representation of function of differentially expressed genes (top row – all genes, middle row – upregulated genes, lower row – downregulated genes) between experimental groups and reference groups. DEGs = differentially expressed genes. NR = Non-Responders. R = Responders. Exp. = experimental group. Ref. = reference group. Numbers in the middle of the pie charts indicate the number of differentially expressed genes.
While valuable information is gained by looking at DEGs between Non-Responders and Responders versus untreated controls, it is also important to identify differences that exist between Responders and Non-Responders treated with αTIGIT and bintrafusp alfa. DEGs presented in this heat map are significantly different between Responders versus Non-Responders, and significant to untreated controls (at least p < .05; ). As performed in , we grouped DEGs associated with alterations in the immune profile into eight different categories (, left side; online supplemental table 1) and DEGs associated with five prominent signaling pathways (, right side; online supplemental table 2). Of all DEGs in Responders versus Non-Responders, 23% are involved in immune activation, 23% are found in the myeloid compartment, 20% in cytokine and chemokine, 17% in tumor progression, 8% in immune cell adhesion/migration, 8% immune regulation, and 6% in matrix remodeling/metastasis (, left side, top panel). Of the genes that are upregulated, 30% relate to immune activation, 30% in the myeloid compartment, 17% in cytokine and chemokine, 12% in immune cell adhesion/migration, with immune regulation and matrix remodeling/metastasis accounting for 6% each (, left side, middle panel). The most significant proportion of downregulated genes in Responders versus Non-Responders reside in the tumor progression category, making up 34% of all downregulated DEGs in this group, with the next largest groups being immune activation (17%) and the myeloid compartment (17%) (, left side, bottom panel).
Figure 8. Differentially expressed genes between Responders and Non-Responders. (a) Heatmap of differentially expressed genes in tumors taken from animals treated with αTIGIT + bintrafusp alfa Non-Responders (n = 5), αTIGIT + bintrafusp alfa Responders (n = 3) in comparison to untreated animals (n = 5) as identified by the NanoString nCounter® PanCancer Pathways Panel. Mean fold change values are within each cell. This list represents DEGs from Responders that are statistically significant from untreated animals and Responders versus Non-Responders. (b) Graphical summary of function of DEGs (Left column – immune profile, right column – signaling profile) between Responders and Non-Responders. All genes are in the top row, upregulated genes in the middle row and downregulated genes are in the bottom row. Numbers in the middle of the pie charts indicate the number of differentially expressed genes. (c) STRING network of protein–protein interactions of DEGs between Responders and Non-Responders identified by NanoString.
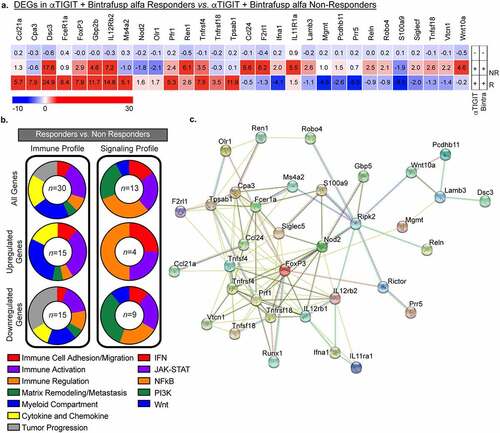
When we queried differences in signaling pathways between Responders and Non-Responders, we observed significant alterations in the IFN (15%; red), JAK-STAT (23%; purple), NFκB (31%; orange), PI3K (23%; green), and Wnt pathways (8%; blue) ( a and b, right side, top panel). Twenty-five percent of the upregulated signaling DEGs belong to the IFN and JAK-STAT pathways, and 50% to the NFκB pathway (; right side, middle panel). Of the downregulated DEGs, they comprise a relatively equivalent representation of the IFN (11%), JAK-STAT (22%), NFκB (22%), PI3K (33%), and Wnt (11%) pathways (, right side, bottom panel).
A STRING network of protein–protein interactions of a curated set of modulated genes identified through NanoString shows interconnectedness, albeit with multiple different nodes (). Of note, multiple genes display heavy interactions, while others are more distantly related. Future studies will aim to determine which of these players are crucial in driving response to αTIGIT + bintrafusp alfa combination therapy, and which are more indicative of failure to respond. Ideally, some of these soluble factors could be used in the clinic as biomarker(s) of success, or failure, in patients. These data indicate that not only do we observe an influx of lymphocytes into the TME, but also these cells are more activated via RNA transcriptomic profiles.
Discussion
Treatment with ICB as monotherapy yields low durable responses; therefore, the rationale for combining ICB with next generation checkpoint molecules, cytokines, and/or cancer vaccines will likely become standard of care in several indications.Citation34,Citation35 The PD-1/PD-L1 axis is the most targeted pathway in cancer immunotherapy, with 4,400 trials opened since 2017. In 2020, 90% of new trials utilizing PD-1/PD-L1 inhibitors have been in combination studies.Citation13 In our model of murine colon carcinoma, we demonstrate that the inhibitory receptors PD-1 and TIGIT are upregulated in the tumor infiltrating Tregs, CD4+ and CD8+ T cells and their respective cognate ligands, PD-L1 and CD155, are expressed in the TME (). Our observations were similar to those reported in humans, wherein TIGIT and PD-1 are coordinately expressed on CD8+ T cells of cancer patients, including those with melanoma,Citation36 hepatocarcinoma,Citation37 head and neck squamous cell carcinoma,Citation38 non-small cell lung cancer,Citation39 and B-cell non-Hodgkin lymphoma.Citation40 Ex vivo dual blockade of these two inhibitory receptors was demonstrated to restore the function of the CD8+ T cells,Citation36,Citation37,Citation41 including the in vitro proliferation and cytokine production of tumor antigen-specific T cells.Citation36 In addition to inhibitory receptors, we also observed that TGFβ levels are elevated in tumor-bearing mice (). TGFβ is historically known to be pro-tumorigenic in nature and has resulted in the development of several small molecule inhibitors targeting this pathway for use in the clinic.Citation28 TGFβ can suppress the host immune response to cancer in a myriad of ways, including, but not limited to, promotion of angiogenesis and epithelial to mesenchymal transition, impairment of CD8+ T cells and NK cells, reducing T cell infiltration to the tumor, and recruitment of M2 macrophages and MDSCs. Overall, our findings provide justification for combining two novel molecules targeting these three distinct immune regulatory pathways; αTIGIT, to block TIGIT:CD155, and bintrafusp alfa, a bifunctional fusion protein targeting both TGFβ signaling and PD-1/PD-L1 negative regulation.
In the MC38-CEA colon carcinoma model, we observed a significant reduction in tumor volumes in the cohort treated with αTIGIT + bintrafusp alfa in comparison to untreated animals, or cohorts that receive either molecule as monotherapy (), as well as an increase in median survival (). Antitumor responses elicited by the combination therapy were dependent on CD4+ and CD8+ T cells () and were also associated with the generation of tumor antigen-specific T cells (). Furthermore, αTIGIT + bintrafusp alfa treatment resulted in a 50% tumor-free survival, with the cured animals acquiring protection from tumor re-challenge ( d and e). Overall, the data provide evidence that the combination treatment strategy can stimulate antitumor T cells and generate long-lived memory responses in the MC38-CEA tumor model.
TIGIT expression is upregulated on a multitude of human cancers, including HPV+ malignancies. Intriguingly, HPV+ and HPV− HNSCC possess molecularly distinct landscapes and subsequently variability in clinical outcome.Citation42 It has been reported that HPV+ tissues, in comparison to HPV− or adjacent cancer-free tissues, have significantly higher expression of LAG3, PD-1, TIGIT, and TIM3.Citation42 Utilizing the HPV16 E6 and E7 expressing cell line, TC1, we observed significant antitumor activity with αTIGIT + bintrafusp alfa combination therapy (), associated with the appreciable increase in CD45+ cells, CD8+ T cells, NK cells, M-MDSCs, and DCs ().
Several studies demonstrate that CD226 is required for the stimulatory effect of both TIGIT and PD-1/PD-L1 blockade.Citation14,Citation37,Citation43 Furthermore, TIGIT and PD-1 receptors, through separate and distinct mechanisms, partly exert their inhibitory functions through the impairment of CD226 signaling, emphasizing the necessity for dual blockade.Citation44 While we observed a two-fold decrease in bioavailable TIGIT in tumor infiltrating CD8+ T cells in the MC38-CEA model, we did not detect the same reduction in the TC1 model. We also did not observe any changes in CD226 expression on CD8+ T cells upon αTIGIT + bintrafusp alfa treatment in both models. Further investigation on the phosphorylation and activation status of CD226 will be required to elucidate the role of this molecule in the therapeutic effect of our combination therapy regimen.
The bifunctional fusion protein bintrafusp alfa has recently undergone three late-stage clinical failures. The clinical trial NCT03631706 studied a head-to-head comparison of bintrafusp alfa versus pembrolizumab monotherapy in patients with NSCLC, where the novel molecule failed to outperform the standard of care. Trial NCT03833661 investigated the benefit of bintrafusp alfa as monotherapy in locally advanced or metastatic biliary tract cancer (BTC) but was halted due to an objective response rate of just 10%. The third trial, NCT04066491, aimed to determine efficacy of bintrafusp alfa in combination with gemcitabine and cisplatin in locally advanced or metastatic BTC and was discontinued upon determination that the study was unlikely to improve overall survival. However, preliminary clinical trial data from our group demonstrate that bintrafusp alfa has significant activity as a monotherapy in patients with HPV-associated malignances, resulting in a median overall survival (OS) of 21.3 months in comparison to OS ≤ 12 months following anti-PD-1/PD-L1 therapyCitation9 (NCT02517398 and NCT03427411). Herein, we report similar results of efficacy with our αTIGIT + bintrafusp alfa combination therapy and purport this as a rationale progression in treatment of patients with HPV-associated malignancies.
Tumors exist on a rheostat of immune infiltrated (“hot” tumors) to immune excluded (“cold” tumors).Citation45 Important caveats when interrogating ICB are the requirement of preexisting cells in the TME or the ability of effector cells to access the TME following ICB. Herein, we reported that Responders to combination treatment with αTIGIT + bintrafusp alfa have significant immune cell infiltrate of CD45+ cells, Tregs, CD8+ T cells, NK cells, M-MDSCs, PMN-MDSCs, macrophages, and DCs into the MC38-CEA TME (). This is further supported by transcriptomic data showing an increase in expression of genes involved in immune cell adhesion/migration (CD28, Dsc3, Icos, Itga2, Pdcd1, Sele) and genes involved in chemokine and cytokine signaling (CCL20, CCL21α, CCR9, Csf2, CXCL3, IL-10, IL-23 R, IL-12Rβ2) when comparing Responders to untreated cohorts ( b and d). Furthermore, we reported significant upregulation in genes involved in immune cell adhesion/migration (Dsc3, Olr1) and genes involved in chemokine and cytokine signaling (CCL21α, IL-12Rβ2, Nod2) between Responders and Non-Responders ( a and b; online supplemental Table 1). These data act in concert to support increased infiltration in cohorts that responded to combination therapy of αTIGIT + bintrafusp alfa (summarized in c and d).
Directing immune cells into the TME is an obstacle that must be overcome to develop meaningful responses to ICB, but it is not the only one. Effectiveness of immunomodulatory agents also depends on effector cell ability to avoid exhaustion and perform their intended effector function. Dual expression of PD-1 and LAG3 on T cells has traditionally been considered a marker of a hyper-exhausted phenotype; however, emerging evidence indicates these cells are, in fact, tumor-specific, have increased cytotoxicity and proliferative capacity, and are more activated.Citation46 We observed both increased expression levels of LAG3 (), PD-1 () and an increased frequency of PD-1+LAG3+CD8+ T cells () in Responders in comparison to other treatment groups. A two-fold increase in PD-1+LAG3+CD8+ T cells was also observed in the TC1 model with the combination treatment (). Additionally, we reported an increase in tumor antigen-specific CD8+ T cells from the αTIGIT + bintrafusp alfa Responders cohort in comparison to untreated control animals on day 17 and day 24 post-tumor inoculation ( f and g, left panels). The frequency of tumor-specific CD8+ T cells was inversely correlated with tumor volume, with the smallest tumors generating the most robust tumor-reactivity ( f and g, right panels). Additionally, a retrospective analysis in a lung cancer cohort revealed greater overall survival in patients who had CD8+ TILs that expressed high levels of PD-1, LAG3, and TIM-3.Citation46 These results verify the increase of CD8+ T cells that are co-expressing traditional exhaustion markers are not terminally exhausted, but rather still capable of secreting IFNγ in response to tumor antigen, as well as having increased cytotoxicity as evidenced by elevated Prf1 ().
To further support our functional findings, interrogation of the TME revealed significant increases in genes responsible for immune activation of Responders in comparison to untreated controls (Apol6, CD28, FasL, Fcer1a, Icos, IL-12Rβ2, Irf4, Pdcd1, Prf1, TNFRSF4, TNFSF18) (), as well as increases in immune activation in Responders in comparison to Non-Responders (Fcer1a, IL-12Rβ2, Prf1, TNFRSF4, and TNFRSF18) ( c and d, 7a and b). Additionally, several genes encoding coinhibitory receptors, such as B7-H4 and GITRL, are significantly downregulated in Responders in comparison to Non-Responders (). These data indicate that although we have a global increase of several classically defined positive and negative immune cell subsets, the TME of Responders versus Non-Responders and untreated cohorts remains immunostimulatory, with greater antigen-specificity of cytotoxic T cells ( c-g, 5f and g, 6a-d, 7a and b).
PD-1/PD-L1, TIGIT, and TGFβ all contribute to the suppressive function of Tregs and disruption of these pathways has been employed to modulate Treg activity.Citation47 While the αTIGIT + bintrafusp alfa treatment neither decreased Treg populations nor improved CD8:Treg ratio in the MC38-CEA and TC1 tumor models, it decreased the TIGIT:CD226 ratio on tumor infiltrating Tregs in both models. Ligation of TIGIT with CD155 promotes the suppressive functions of Tregs, while CD155:CD226 interactions impede Treg activity and stability.Citation33 Moreover, upon interrogation of DEGs in Responders compared to Non-Responders, several DEGs are involved in mast cell degranulation (Cpa3, Tpsab1, etc.) (). Previous reports indicate mast cell degranulation in colorectal carcinomas are a result of the inability of Tregs to suppress a pro-inflammatory environment.Citation48 Furthermore, in human colorectal cancer, tumor infiltrating Tregs lose their suppressive capacity and adopt Th17-like features.Citation49 We, therefore, posit that Tregs found within the TME of our model are incapable of suppressing antitumor effector immune responses.
Cytokines have emerged as playing an important, albeit poorly understood, role in tumor progression.Citation50 When we evaluated peripheral cytokine levels in MC38-CEA tumor-bearing mice 14 days after tumor instillation, we noted increased levels of IL-1β in animals receiving αTIGIT + bintrafusp alfa that responded to therapy (). IL-1β is pleiotropic in nature, possessing both pro- and antitumor activity. IL-1β favors commitment of T helper cells toward a proinflammatory Th17 phenotype.Citation51 IL-1β is primarily produced by cells of the monocytic lineage, such as macrophages, which remains consistent with observed intratumoral increase in the myeloid compartment (). In addition, transcriptomic evidence reveals Nod2, which leads to increased secretion of IL-1β from macrophages resulting in a cascade of proinflammatory cytokines, is significantly elevated in αTIGIT + bintrafusp alfa Responders in comparison to Non-Responders (). We observed a significant decrease in peripheral IL-2 in αTIGIT + bintrafusp alfa Responders in comparison to all other cohorts (). While several reports highlight the ability of IL-2 to activate effector cells, other IL-2 therapy studies reveal that this cytokine can promote Tregs in cancer patients.Citation52,Citation53 Interestingly, a study in patients with ovarian carcinoma showed that after IL-2 therapy cessation, Tregs populations in Responders significantly dropped when compared to Non-Responders.Citation53 We posit that in the untreated mouse cohort, the high-affinity receptor expression bias allows Tregs to outcompete CD8+ T cells in the TME for access to IL-2, essentially shutting down CD8+ T cell effector function which was reversed by the combination therapy-induced decrease in IL-2.
In our studies, we observed a significant reduction in TGFβ in the αTIGIT + bintrafusp alfa Responders cohort in comparison with untreated animals, while Non-Responders failed to modulate TGFβ concentrations (). In addition, Reln, a protein involved in TGFβ-induced migration and metastasis of cancer cells, is found at significantly reduced levels in Responders in comparison to Non-Responders ().
We report for the first-time αTIGIT in combination with bintrafusp alfa results in prominent antitumor activity and increase in overall survival in both the MC38-CEA colon carcinoma and the TC1, HPV+ lung carcinoma models, which are dependent on CD4+ and CD8+ T cells. This combination treatment results in immune cell infiltration into the tumors, increased activation, and cytotoxicity of TIL. αTIGIT + bintrafusp alfa Responders display a more immune-activated landscape, in cytokine measurements, TIL, and transcriptomic profiles. These data represent potential indicators of response or resistance to therapy that could be monitored in patients enrolled in clinical trials.
Author contributions
SEF and JWH conceptualized and designed research studies. SEF, KPF, BW, and GSS conducted the experiments and acquired data. SEF and KPF analyzed the data. SEF, KPF, and JWH wrote the manuscript. SEF, KPF, BW, and JWH reviewed the manuscript.
Ethics approval and consent to participate
All experimental animal studies were performed under the approval of the NIH Intramural Animal Care and Use Committee. All mice were housed and maintained in accordance with the Association for Assessment and Accreditation of Laboratory Animal Care (AAALAC) guidelines.
Supplemental Material
Download PDF (662.6 KB)Acknowledgments
The authors thank the Genomics Laboratory, Frederick National Laboratory for Cancer Research, for their assistance. The authors thank Debra Weingarten for her editorial assistance in the preparation of this manuscript. Merck reviewed the manuscript for medical accuracy only before journal submission. The authors are fully responsible for the content of this manuscript, and the views and opinions described in the publication reflect solely those of the authors.
Data availability statement
Data will be made available upon reasonable request.
Disclosure statement
The authors declare no potential conflicts of interest.
Funding
This work was funded by the Intramural Research Program of the Center for Cancer Research, National Cancer Institute (NCI), National Institutes of Health, and via a Cooperative Research and Development Agreement (CRADA) between the NCI and EMD Serono Research & Development Institute, Inc., Billerica, MA, USA, an affiliate of Merck KGaA.
Supplementary material
Supplemental data for this article can be accessed online at https://doi.org/10.1080/2162402X.2022.2124666
References
- Fabian KP, Malamas AS, Padget MR, Solocinski K, Wolfson B, Fujii R, et al. Therapy of established tumors with rationally designed multiple agents targeting diverse immune-tumor interactions: engage, expand, enable. Cancer Immunol Res. 2021;9(2):239–18. doi:10.1158/2326-6066.CIR-20-0638.
- Wolfson B, Hodge JW. Next generation therapeutic strateg-es: evolving cancer immunotherapy through agents that engage, expand and enable the anti-tumor immune response. ImmunoMedicine. 2021;1(1):e1020. doi:10.1002/imed.1020.
- Krummel MF, Allison JP. CD28 and CTLA-4 have opposing effects on the response of T cells to stimulation. J Exp Med. 1995;182(2):459–465. doi:10.1084/jem.182.2.459.
- Wei SC, Duffy CR, Allison JP. Fundamental mechanisms of immune checkpoint blockade therapy. Cancer Discov. 2018;8(9):1069–1086. doi:10.1158/2159-8290.CD-18-0367.
- Jochems C, Tritsch SR, Pellom ST, Su Z, Soon-Shiong P, Wong HC, et al. Analyses of functions of an anti-PD-L1/TGFbetaR2 bispecific fusion protein (M7824). Oncotarget. 2017;8(43):75217–75231. doi:10.18632/oncotarget.20680.
- Strauss J, Heery CR, Schlom J, Madan RA, Cao L, Kang Z, et al. Phase I trial of M7824 (MSB0011359C), a bifunctional fusion protein targeting PD-L1 and TGFbeta, in advanced solid tumors. Clin Cancer Res. 2018;24(6):1287–1295. doi:10.1158/1078-0432.CCR-17-2653.
- Lan Y, Zhang D, Xu C, Hance KW, Marelli B, Qi J, et al. Enhanced preclinical antitumor activity of M7824, a bifunctional fusion protein simultaneously targeting PD-L1 and TGF-beta. Sci Transl Med. 2018;10(424). doi:10.1126/scitranslmed.aan5488
- Paz-Ares L, Kim TM, Vicente D, Felip E, Lee DH, Lee KH, et al. Bintrafusp Alfa, a bifunctional fusion protein targeting TGF-beta and PD-L1, in second-line treatment of patients with NSCLC: results from an expansion cohort of a phase 1 trial. J Thorac Oncol. 2020;15(7):1210–1222. doi:10.1016/j.jtho.2020.03.003.
- Strauss J. Long-term follow-up of patients with human papillomavirus (HPV)-associated malignancies treated with bintrafusp alfa, a bifunctional fusion protein targeting TGF-b and PD-L1. ESMO2021.
- Yu X, Harden K, Gonzalez LC, Francesco M, Chiang E, Irving B, et al. The surface protein TIGIT suppresses T cell activation by promoting the generation of mature immunoregulatory dendritic cells. Nat Immunol. 2009;10(1):48–57. doi:10.1038/ni.1674.
- Zhang B, Zhao W, Li H, Chen Y, Tian H, Li L, et al. Immunoreceptor TIGIT inhibits the cytotoxicity of human cytokine-induced killer cells by interacting with CD155. Cancer Immunol Immunother. 2016;65(3):305–314. doi:10.1007/s00262-016-1799-4.
- Stanietsky N, Simic H, Arapovic J, Toporik A, Levy O, Novik A, et al. The interaction of TIGIT with PVR and PVRL2 inhibits human NK cell cytotoxicity. Proc Natl Acad Sci U S A. 2009;106(42):17858–17863. doi:10.1073/pnas.0903474106.
- Yu JX, Upadhaya S, Tatake R, Barkalow F, Hubbard-Lucey VM. Cancer cell therapies: the clinical trial landscape. Nat Rev Drug Discov. 2020;19(9):583–584. doi:10.1038/d41573-020-00099-9.
- Johnston RJ, Comps-Agrar L, Hackney J, Yu X, Huseni M, Yang Y, et al. The immunoreceptor TIGIT regulates antitumor and antiviral CD8(+) T cell effector function. Cancer Cell. 2014;26(6):923–937. doi:10.1016/j.ccell.2014.10.018.
- Joller N, Lozano E, Burkett PR, Patel B, Xiao S, Zhu C, et al. Treg cells expressing the coinhibitory molecule TIGIT selectively inhibit proinflammatory Th1 and Th17 cell responses. Immunity. 2014;40(4):569–581. doi:10.1016/j.immuni.2014.02.012.
- Manieri NA, Chiang EY, Grogan JL. TIGIT: a key inhibitor of the cancer immunity cycle. Trends Immunol. 2017;38(1):20–28. doi:10.1016/j.it.2016.10.002.
- Goldenberg DM, Kim EE, DeLand FH, Bennett S, Primus FJ. Radioimmunodetection of cancer with radioactive antibodies to carcinoembryonic antigen. Cancer Res. 1980;40:2984–2992.
- Knudson KM, Hicks KC, Alter S, Schlom J, Gameiro SR. Mechanisms involved in IL-15 superagonist enhancement of anti-PD-L1 therapy. J Immunother Cancer. 2019;7(1):82. doi:10.1186/s40425-019-0551-y.
- David JM, Dominguez C, McCampbell KK, Gulley JL, Schlom J, Palena C. A novel bifunctional anti-PD-L1/TGF-beta Trap fusion protein (M7824) efficiently reverts mesenchymalization of human lung cancer cells. Oncoimmunology. 2017;6(10):e1349589. doi:10.1080/2162402X.2017.1349589.
- Jochems C, Hodge JW, Fantini M, Tsang KY, Vandeveer AJ, Gulley JL, et al. ADCC employing an NK cell line (haNK) expressing the high affinity CD16 allele with avelumab, an anti-PD-L1 antibody. Int J Cancer. 2017;141(3):583–593. doi:10.1002/ijc.30767.
- Robbins PF, Kantor JA, Salgaller M, Hand PH, Fernsten PD, Schlom J. Transduction and expression of the human carcinoembryonic antigen gene in a murine colon carcinoma cell line. Cancer Res. 1991;51:3657–3662.
- Vasievich EA, Chen W, Huang L. Enantiospecific adjuvant activity of cationic lipid DOTAP in cancer vaccine. Cancer Immunol Immunother. 2011;60(5):629–638. doi:10.1007/s00262-011-0970-1.
- Chakraborty M, Abrams SI, Camphausen K, Liu K, Scott T, Coleman CN, et al. Irradiation of tumor cells up-regulates Fas and enhances CTL lytic activity and CTL adoptive immunotherapy. J Immunol. 2003;170(12):6338–6347. doi:10.4049/jimmunol.170.12.6338.
- Schmitz J, Reali E, Hodge JW, Patel A, Davis G, Schlom J, et al. Identification of an interferon-gamma-inducible carcinoembryonic antigen (CEA) CD8(+) T-cell epitope, which mediates tumor killing in CEA transgenic mice. Cancer Res. 2002;62(17):5058–5064.
- Kilkenny C, Browne W, Cuthill IC, Emerson M, Altman DG, Ncrrgw G. Animal research: reporting in vivo experiments: the ARRIVE guidelines. Br J Pharmacol. 2010;160(7):1577–1579. doi:10.1111/j.1476-5381.2010.00872.x.
- Szklarczyk D, Morris JH, Cook H, Kuhn M, Wyder S, Simonovic M, et al. The STRING database in 2017: quality-controlled protein-protein association networks, made broadly accessible. Nucleic Acids Res. 2017;45(D1):D362–D8. doi:10.1093/nar/gkw937.
- Keir ME, Butte MJ, Freeman GJ, Sharpe AH. PD-1 and its ligands in tolerance and immunity. Annu Rev Immunol. 2008;26:677–704. doi:10.1146/annurev.immunol.26.021607.090331.
- Colak S, Ten Dijke P. Targeting TGF-beta signaling in cancer. Trends Cancer. 2017;3(1):56–71. doi:10.1016/j.trecan.2016.11.008.
- Lind H, Gameiro SR, Jochems C, Donahue RN, Strauss J, Gulley JM, et al. Dual targeting of TGF-beta and PD-L1 via a bifunctional anti-PD-L1/TGF-betaRII agent: status of preclinical and clinical advances. J Immunother Cancer. 2020;8(1). doi:10.1136/jitc-2019-000433
- Pitt JM, Vetizou M, Daillere R, Roberti MP, Yamazaki T, Routy B, et al. Resistance mechanisms to immune-checkpoint blockade in cancer: tumor-intrinsic and -extrinsic factors. Immunity. 2016;44(6):1255–1269. doi:10.1016/j.immuni.2016.06.001.
- Pelly VS, Moeini A, Roelofsen LM, Bonavita E, Bell CR, Hutton C, et al. Anti-inflammatory drugs remodel the tumor immune environment to enhance immune checkpoint blockade efficacy. Cancer Discov. 2021;11(10):2602–2619. doi:10.1158/2159-8290.Cd-20-1815.
- Principe N, Kidman J, Goh S, Tilsed CM, Fisher SA, Fear VS, et al. Tumor infiltrating effector memory antigen-specific CD8+ t cells predict response to immune checkpoint therapy. Front Immunol. 2020;11. doi:10.3389/fimmu.2020.584423.
- Fourcade J, Sun Z, Chauvin JM, Ka M, Davar D, Pagliano O, et al. CD226 opposes TIGIT to disrupt tregs in melanoma. JCI Insight. 2018;3(14). doi:10.1172/jci.insight.121157
- Wolfson B, Franks SE, Hodge JW. Stay on target: reengaging cancer vaccines in combination immunotherapy. Vaccines. 2021;9:doi 10.3390/vaccines9050509.
- Strauss J, Madan RA, Gulley JL. Considerations for the combination of anticancer vaccines and immune checkpoint inhibitors. Expert Opin Biol Ther. 2016;16(7):895–901. doi:10.1517/14712598.2016.1170805.
- Chauvin JM, Pagliano O, Fourcade J, Sun Z, Wang H, Sander C, et al. TIGIT and PD-1 impair tumor antigen-specific CD8⁺ T cells in melanoma patients. J Clin Invest. 2015;125(5):2046–2058. doi:10.1172/jci80445.
- Ge Z, Zhou G, Campos Carrascosa L, Gausvik E, Boor PPC, Noordam L, et al. TIGIT and PD1 co-blockade restores ex vivo functions of human tumor-infiltrating CD8+ T cells in hepatocellular carcinoma. Cell Mol Gastroenterol Hepatol. 2021;12(2):443–464. doi:10.1016/j.jcmgh.2021.03.003.
- Wu L, Mao L, Liu J-F, Chen L, G-T Y, Yang -L-L, et al. Blockade of TIGIT/CD155 signaling reverses T-cell exhaustion and enhances antitumor capability in head and neck squamous cell carcinoma. Cancer Immunol Res. 2019;7(10):1700–1713. doi:10.1158/2326-6066.Cir-18-0725.
- Hu F, Wang W, Fang C, Bai C. TIGIT presents earlier expression dynamic than PD-1 in activated CD8(+) T cells and is upregulated in non-small cell lung cancer patients. Exp Cell Res. 2020;396(1):112260. doi:10.1016/j.yexcr.2020.112260.
- Josefsson SE, Beiske K, Blaker YN, Førsund MS, Holte H, Østenstad B, et al. TIGIT and PD-1 mark intratumoral T cells with reduced effector function in B-cell non-hodgkin lymphoma. Cancer Immunol Res. 2019;7(3):355–362. doi:10.1158/2326-6066.Cir-18-0351.
- Thibaudin M, Limagne E, Hampe L, Ballot E, Truntzer C, Ghiringhelli F. Targeting PD-L1 and TIGIT could restore intratumoral CD8 T cell function in human colorectal cancer. Cancer Immunol Immunother. 2022. doi:10.1007/s00262-022-03182-9.
- Gameiro SF, Ghasemi F, Barrett JW, Koropatnick J, Nichols AC, Mymryk JS, et al. Treatment-naive HPV+ head and neck cancers display a T-cell-inflamed phenotype distinct from their HPV- counterparts that has implications for immunotherapy. Oncoimmunology. 2018;7(10):e1498439. doi:10.1080/2162402X.2018.1498439.
- H-s J, Ko M, D-s C, Kim JH, D-h L, Kang S-H, et al. CD226hiCD8+ T cells are a prerequisite for anti-TIGIT immunotherapy. Cancer Immunol Res. 2020;8(7):912–925. doi:10.1158/2326-6066.CIR-19-0877.
- Banta KL, Xu X, Chitre AS, Au-Yeung A, Takahashi C, O’Gorman WE, et al. Mechanistic convergence of the TIGIT and PD-1 inhibitory pathways necessitates co-blockade to optimize anti-tumor CD8+ T cell responses. Immunity. 2022;55(3):512–26.e9. doi:10.1016/j.immuni.2022.02.005.
- Galon J, Bruni D. Approaches to treat immune hot, altered and cold tumours with combination immunotherapies. Nat Rev Drug Discov. 2019;18(3):197–218. doi:10.1038/s41573-018-0007-y.
- Datar I, Sanmamed MF, Wang J, Henick BS, Choi J, Badri T, et al. Expression analysis and significance of PD-1, LAG-3, and TIM-3 in human non-small cell lung cancer using spatially resolved and multiparametric single-cell analysis. Clin Cancer Res. 2019;25(15):4663–4673. doi:10.1158/1078-0432.CCR-18-4142.
- Chen B-J, Zhao J-W, Zhang D-H, Zheng A-H, G-Q W. Immunotherapy of cancer by targeting regulatory T cells. Int Immunopharmacol. 2022;104:108469. doi:10.1016/j.intimp.2021.108469.
- Gounaris E, Blatner NR, Dennis K, Magnusson F, Gurish MF, Strom TB, et al. T-regulatory cells shift from a protective anti-inflammatory to a cancer-promoting proinflammatory phenotype in polyposis. Cancer Res. 2009;69(13):5490–5497. doi:10.1158/0008-5472.CAN-09-0304.
- Blatner NR, Bonertz A, Beckhove P, Cheon EC, Krantz SB, Strouch M, et al. In colorectal cancer mast cells contribute to systemic regulatory T-cell dysfunction. Proc Natl Acad Sci U S A. 2010;107(14):6430–6435. doi:10.1073/pnas.0913683107.
- Dranoff G. Cytokines in cancer pathogenesis and cancer therapy. Nat Rev Cancer. 2004;4(1):11–22. doi:10.1038/nrc1252.
- Lopez-Castejon G, Brough D. Understanding the mechanism of IL-1beta secretion. Cytokine Growth Factor Rev. 2011;22(4):189–195. doi:10.1016/j.cytogfr.2011.10.001.
- Ahmadzadeh M, Rosenberg SA. IL-2 administration increases CD4+ CD25(hi) Foxp3+ regulatory T cells in cancer patients. Blood. 2006;107(6):2409–2414. doi:10.1182/blood-2005-06-2399.
- Wei S, Kryczek I, Edwards RP, Zou L, Szeliga W, Banerjee M, et al. Interleukin-2 administration alters the CD4+FOXP3+ T-cell pool and tumor trafficking in patients with ovarian carcinoma. Cancer Res. 2007;67(15):7487–7494. doi:10.1158/0008-5472.Can-07-0565.