
ABSTRACT
MYC plays critical roles in tumorigenesis and is considered an attractive cancer therapeutic target. Small molecules that directly target MYC and are well tolerated in vivo represent invaluable anti-cancer therapeutic agents. Here, we aimed to investigate the therapeutic effect of MYC inhibitors in head and neck squamous cell carcinoma (HNSCC). The results showed that pharmacological and genetic inhibition of MYC inhibited HNSCC proliferation and migration. MYC inhibitor 975 (MYCi975), inhibited HNSCC growth in both cell line-derived xenograft and syngeneic murine models. MYC inhibition also induced tumor cell-intrinsic immune responses, and promoted CD8+ T cell infiltration. Mechanistically, MYC inhibition increased CD8+ T cell-recruiting chemokines by inducing the DNA damage related cGAS-STING pathway. High expression of MYC combined with a low level of infiltrated CD8+ T cell in HNSCC correlated with poor prognosis. These results suggested the potential of small-molecule MYC inhibitors as anti-cancer therapeutic agents in HNSCC.
Introduction
Head and neck squamous cell carcinoma (HNSCC), arising from the oral cavity, oropharynx, larynx, and hypopharynx, is a highly aggressive malignant tumor with poor prognosis.Citation1 Multidisciplinary management, including surgery, radiation therapy, chemotherapy or combinations of these therapeutic modalities, represent the classical options for managing HNSCC.Citation2,Citation3 Despite advances in multidisciplinary management, toxicities such as xerostomia, oral mucositis, trismus, radiation caries, and osteoradionecrosis are reported,Citation2,Citation4 and the 5-year survival rate for patients with HNSCC has not increased over past decades.Citation5–7 Thus, it is essential to explore more effective therapeutic strategies to improve HNSCC prognosis.
The MYC gene, located on human chromosome 8, is one of the most commonly activated genes during tumor development.Citation8–10 MYC overexpression induces tumorigenesis and its proteins are functionally involved in up to 70% of all human cancers.Citation11–13 Several oncogenic signaling pathways, such as WNT, RAS, and PI3K/AKT, might mediate their pro-tumorigenic functions through MYC.Citation14,Citation15 Given the essential roles of MYC underlying transcriptional activation and tumorigenesis, selective inhibition of MYC has become an attractive anticancer therapy strategy.Citation16–20
Recently, programmed cell death 1 (PD1) blockade-based immune checkpoint inhibition (ICI) therapy combined with chemotherapy has been approved as a first-line of treatment for recurrent or metastatic HNSCC. Unfortunately, the objective response rates are not very high, and the median response duration is relatively short, suggesting that HNSCC is resistant to ICI therapy.Citation21 For recurrent and/or metastatic HNSCC, tumor programmed cell death-ligand 1 (PD-L1) expression should be evaluated as an approved ICI therapy within the framework of quality assurance.Citation22 Very recently, a study showed that MYC amplification regulates PD-L1 expression and is involved in a decreased response to ICI therapy in HNSCC,Citation23 indicating that MYC might help to predict the efficacy of ICI therapy and to select suitable therapeutic targets.
Various types of inhibitors, including those that target MYC-Max dimerization, MYC transcription/translation suppression, and the destabilization of MYC, have been developed.Citation24 However, it would be quite challenging to target MYC directly because of its undruggable protein structure.Citation24 MYCi975, a small molecule inhibitor of MYC, was confirmed to promote MYC phosphorylation and degradation.Citation25,Citation26 MYCi975 showed favorable pharmacokinetics, in vivo tolerability and efficacy in mouse tumor models. Moreover, treatment with MYCi975 modulated the tumor immune microenvironment by inducing immune cell infiltration.Citation25 However, the therapeutic effect of MYCi975 on HNSCC remains unknown, and the underlying mechanism still needs to be investigated. In this study, we tested whether silencing MYC expression in HNSCC leads to tumor regression associated with remodeling of the tumor microenvironment.
Methods
Human HNSCC samples
Patients diagnosed with HNSCC in Peking University School and Hospital of Stomatology between June 2013 and December 2016 were enrolled in this study. This study was approved by the Ethics Committee of Peking University School and Hospital of Stomatology (Approval number PKUSSIRB-2012010).
Cell culture
Human HNSCC cell lines, HN6 and CAL27, were obtained from the American Type Culture Collection (ATCC, Manassas, VA, USA). These cells were grown in Dulbecco’s modified Eagle’s medium (DMEM) containing 10% fetal bovine serum (FBS) and antibiotics (streptomycin and penicillin) at 37°C in a 5% CO2 atmosphere.
A murine head and neck squamous cell line (MSCC1), isolated from 4-nitroquinoline N-oxide (4NQO)-induced murine head and neck squamous cell carcinoma, was generated in our laboratory as previously described.Citation27 Primary 4NQO-induced mouse HNSCCs were generated as described previously.Citation28 4NQO (Santa Cruz Biotechnology, Santa Cruz, CA, USA, Cat# 256815) was diluted in the mice’s drinking water to a final concentration of 50 μg/mL and was changed weekly. After 16 weeks, all animal cages were reverted to regular water until week 22. Animals were euthanized on week 22 for tissue retrieval. Single-cell suspensions of individual primary oral cavity tumors were made using Collagenase IA (Sigma-Aldrich, St. Louis, MO, USA; Cat#C0130) and cultured in Defined Keratinocyte-SFM medium supplemented with recombinant mouse EGF protein (5 ng/ml) and 1% antibiotic/antimycotic solution. Sequential differential trypsinization was then used to clear fibroblast contamination.
Animals
BALB/c-nude female mice and C57BL/6 J male mice (6–8 weeks old) were housed in a specific pathogen free environment. All animal studies were performed in compliance with the regulations and the Peking University institutional animal care guidelines.
HN6 cells (5 × 10⁶) and Matrigel were injected into the dorsal subcutaneous region of BALB/c-nude mice. Three weeks after injection, the mice were divided into two groups, and given vehicle or MYCi975 (MedMol, Shanghai, China; Cat#S89011; 100 mg/kg) every 2 days for 4 weeks. MSCC1 cells (5 × 10⁶) were injected into the dorsal subcutaneous region of C57BL/6 J mice. Four weeks after injection, the mice were divided into four groups and treated using control vehicle, MYCi975, anti-C-X-C motif chemokine receptor 3 (CXCR3), and MYCi975 plus anti-CXCR3 for 4 weeks. Mice were sacrificed and the tumor samples were dissected and isolated immediately. The tumor volume was determined using the volume formula for an ellipsoid: 1/2 × D × d,Citation2 where D is the longer diameter and d is the shorter diameter.
Immunohistochemistry
Immunohistochemical staining was performed on 4 μm-thick sections from 4% paraformaldehyde fixed, paraffin-embedded samples. Sections were incubated with the following primary antibodies at 4°C overnight: anti-MYC (Cell Signaling Technology, Danvers, MA, USA; Cat#18583; 1:100), anti-human CD8α (Cell Signaling Technology; Cat#85336; 1:100), and anti-mouse CD8α (Cell Signaling Technology; Cat#98941; 1:200). Then, the samples were stained with horseradish peroxidase-labeled secondary antibody (ZSGB-BIO, Beijing, China; Cat#PV-6001) and hematoxylin. At least three sections from each HNSCC lesion were immuno-stained and analyzed. All images were acquired under an optical microscope (Olympus, Tokyo, Japan).
siRNA transfection and MYCi975 treatment
Cells were grown to 50–60% confluence, and then transfected with small interfering RNA (siRNA) duplexes, siNC (negative control) or siMYC (Aibosi Inc., Shanghai, China) using the JetPrime reagent (Polyplus Transfection, Illkirch, France; Cat#101000046). The siRNA (20 μM) and JetPrime regent (1:1) were dissolved in transfection buffer at a ratio of 1:50. After 10 minutes of incubation at room temperature, the complex was added to DMEM at a ratio of 1:10. The final concentration of the siRNA was 50 nM. For subsequent assays, siRNA transfection was performed 24–48 h before each assay, accompanied by western blot to evaluate the transfection effect.
For drug administration, MYCi975 was added to the culture medium when the cells reached 70–80% confluence.
Cell proliferation assay
Cell proliferation was measured in vitro using the Cell Counting Kit-8 (CCK-8) assay (Beyotime, Jiangsu, China; Cat#C0037). Briefly, 3 × 10³ cells per well were plated into 96-well plates with DMEM containing 10% FBS. Every 24 h, 100 μL of CCK-8 solution (1:10 dilution) was added to each well, and the cultures were incubated for 1 h at 37°C. Color development was quantified photometrically at 450 nm using an ELx808 absorbance microplate reader (Bio TeK Instruments, Winooski, VT, USA).
Transwell assay
After treatment with the siRNA or MYCi975, the cells were resuspended in serum-free DMEM at a concentration of 105 cells per well. They were then transferred into the upper compartment of a Transwell chamber (8-μm pore size, Corning Inc., Corning, NY, USA; Cat#3422) in a 24-well plate containing DMEM with 20% FBS. HN6 cells were harvested after 12 h of incubation, while CAL27 cells were harvested after 24 h. The chambers were then stained with 0.1% crystal violet (Solarbio, Beijing, China; Cat#G1064) for 30 min. Images were obtained under an optical microscope and analyzed using ImageJ (NIH, Bethesda, MD, USA).
Wound healing assay
After treatment with the siRNA or MYCi975, the confluent layer of cells was scratched using a 1 mL pipette tip, and incubation in DMEM was continued. Images were taken at 18 h for HN6 cells and 36 h for CAL27 cells under an optimal microscope. Wound healing was quantified by measuring the width of the wound healing. Each experiment was independently performed at least three times.
Immunofluorescence
After treatment with the siRNA or MYCi975, cells were fixed in 4% paraformaldehyde for 15 min at room temperature, followed by incubation in 0.1% Triton-100-phosphate-buffered saline (PBS). Subsequently, the cells were blocked using 10% goat serum (ZSGB-BIO, SP-9001) and then incubated with anti-phospho-Histone H2A.X (Cell Signaling Technology; Cat#9718; 1:400) and anti-phospho-interferon regulatory factor 3 (p-IRF3) (Cell Signaling Technology; Cat#37829; 1:400) overnight at 4°C. The cells were then stained with secondary antibodies conjugated with Cy5 or fluorescein isothiocyanate (FITC) (Jackson ImmunoResearch Laboratories, West Grove, PA, USA). Nuclear staining was performed by incubation with 4ʹ,6-diamidino-2-phenylindole (DAPI, ZSGB-BIO; Cat#ZLI-9557). The images were then captured using a fluorescence microscope.
Quantitative real-time reverse transcription PCR (qRT-PCR)
Total RNA was prepared using the TRIzol reagent (Thermo Fisher Scientific, Waltham, MA, USA; Cat#15596026), and 500 ng of RNA was reverse transcribed to cDNA using a reverse transcription kit (Takara, Dalian, China; Cat#RR036A). The cDNA was then quantified using a SYBRGreen kit (Roche, Basel, Switzerland; Cat#04913914001). GAPDH was used as an internal control. The qRT-PCR primers used in this study are listed in Table S1.
Western blot
Cells were lysed using radioimmunoprecipitation assay (RIPA) buffer (Solarbio; Cat#R0010) and added with a cocktail of protease inhibitors and phosphatase inhibitors (Huaxingbio, Hancheng, China; Cat#HX1864). Total proteins (30 μg) were separated using SDS polyacrylamide gel electrophoresis (SDS-PAGE) and then transferred onto polyvinylidene fluoride membranes. The membranes were blocked with 5% skim milk for 1 h and then incubated with primary antibodies at 4°C overnight. Primary antibodies used in this study were: anti-phospho-stimulator of interferon response cGAMP interactor (p-STING) (Cell Signaling Technology; Cat#19781; 1:1000), anti-STING (Cell Signaling Technology; Cat#13647; 1:1000), anti-phospho-TANK binding kinase 1 (p-TBK1) (Cell Signaling Technology; Cat#5483; 1:1000), anti-TBK1 (Cell Signaling Technology; Cat#3504; 1:1000), anti-phospho-IRF3 (Cell Signaling Technology; Cat#37829; 1:1000), anti-IRF3 (Cell Signaling Technology; Cat#4302; 1:1000), anti-MYC (Cell Signaling Technology; Cat#18583; 1:1000), anti-phospho-Histone H2A.X (Cell Signaling Technology; Cat#9718; 1:1000), anti-GAPDH (ZSGB-BIO; Cat#TA-08; 1:1000), and anti-Histone H3 (ABclonal, Wuhan, China; Cat#A2348; 1:1000). The membranes were then stained with the appropriate secondary antibodies. The signals were detected using a Clarity Western ECL kit (Thermo Fisher Scientific; Cat#34577).
Cytosolic dsDNA Staining
Following treatment, HN6 and CAL27 cells were incubated with culture media containing PicoGreen (a dsDNA stain, 200-fold dilution, Thermo Fisher Scientific; Cat#P11496) and MitoTracker (mitochondrial dsDNA stain, 500 nM, Thermo Fisher Scientific; Cat#M7512). At 1 h after incubation, the cells were fixed using 4% paraformaldehyde for 10 min. Cells were then washed three times with PBS and stained with DAPI (ZSGB-BIO; Cat#ZLI-9557). Staining was imaged and assessed using a Leica SP5X laser scanning confocal microscope (Leica, Wetzlar, Germany).
Comet assays
Single cell gel electrophoresis comet assays were performed using an SCGE assay Kit (Enzo Life Sciences, Farmingdale, NY, USA; Cat# ADI-900-166). Following treatment, the cells were mixed with low melting point agarose at a volume ratio of 1:50, and 75 μL aliquots were loaded onto pre-warmed slides. The slides were incubated in pre-chilled lysis solution for 1 h and then in pre-chilled alkaline solution for 30 min. Electrophoresis was run at 25 V in TBE buffer for 20 min. Comets were stained with CYGREEN dye for 30 min and imaged. At least 100 individual cells per sample were evaluated in duplicate using the CASP Version 1.2.2 analysis tool (СASPlab, Wroclaw, Poland).
Statistical analysis
SPSS 21.0 (IBM Corp., Armonk, NY, USA) was used for the statistical analysis. All in vitro experiments were repeated at least three times, and the in vivo experiments were repeated at least once. Student’s t test was used to analyze the data between two groups. The differences among multiple groups were evaluated using one-way analysis of variance (ANOVA). A χ2 test was used to analyze the relationship between MYC expression, CD8+ T cell infiltration density, and clinicopathological factors. Survival curves were constructed using the Kaplan–Meier method and the curves were compared using a log-rank test. The multivariate Cox regression model was applied to simultaneously adjust all potential prognostic variables (P < .1 by a log-rank test in univariate analysis). Correlations were analyzed using the Pearson test. P < .05 was considered statistically significant.
Results
MYC is overexpressed in HNSCC and correlates with poor prognosis
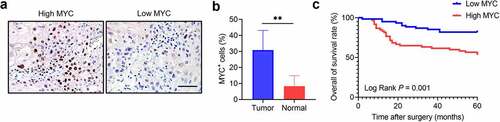
MYC expression was tested in 20 pairs of HNSCC and adjacent non-tumor tissues. The different expression patterns of MYC were confirmed using immunostaining (). The results showed that MYC was increased in HNSCC samples compared with their nonmalignant counterparts (). We then tested MYC in 121 HNSCC samples using immunochemical assays. The results showed that the MYC level correlated with the tumor size, lymph node metastasis, and clinical stage (Table S2). Then, according to the average level of MYC, patients were divided into two groups: high MYC expression and low MYC expression. We confirmed that patients with high MYC levels had shorter survival than those with low MYC levels ().
Figure 1. MYC expression correlates with HNSCC prognosis. (a) Immunochemistry showing MYC expression in HNSCC samples. Scale bar, 50 μm. (b) The MYC expression in HNSCC and adjacent normal tissues. n = 20, **P < .01 by a paired Student’s t test. (c) Kaplan–Meier curves with log-rank tests showing that patients with high MYC expression had shorter survival than those with low MYC expression (P = .001).
MYC inhibition decreases HNSCC proliferation, invasion, and migration
MYC inhibition was mediated by siRNA or MYCi975 in HN6 and CAL27 cells. MYC expression was reduced by treatment with the siRNA (). MYC knockdown inhibited HNSCC proliferation (), invasion (), and migration ( d and e). Similarly, MYC expression was reduced with the treatment of MYCi975 (). MYCi975 inhibited HNSCC proliferation (), invasion (), and migration ( d and e).
Figure 2. MYC knockdown inhibits HNSCC cell proliferation, invasion, and migration. (a) Western blot analysis of MYC protein levels in HN6 and CAL27 cells with or without MYC knockdown. GAPDH was used as internal control. (b) CCK8 assays showing that the proliferation of HN6 and CAL27 cells was inhibited after MYC knockdown. Means ± SD are shown. **P < .01 by one-way ANOVA. (c) Transwell assays showing that the invasion of HN6 and CAL27 cells was inhibited after MYC knockdown. Means ± SD are shown. **P < .01 by one-way ANOVA. (d-e) Wound healing assays showing that the migration of HN6 and CAL27 cells was inhibited after MYC knockdown. Means ± SD are shown. **P < .01 by one-way ANOVA.
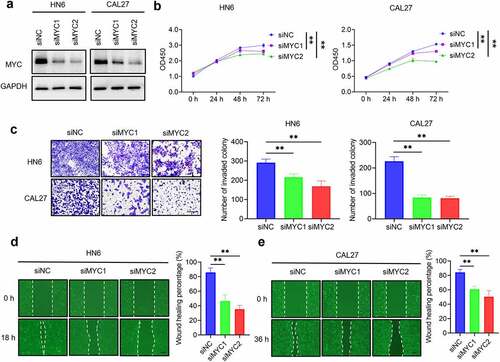
Figure 3. MYCi975 inhibits HNSCC proliferation, invasion, and migration. (a) Western blot analysis showing the inhibition of MYC by MYCi975 treatment. GAPDH was used as the internal control. (b) CCK8 assays showing that the proliferation of HN6 and CAL27 cells was inhibited by MYCi975 treatment. Means ± SD are shown. **P < .01 by one-way ANOVA. (c) Transwell assays showing that the invasion of HN6 and CAL27 cells was reduced by MYCi975 treatment. Means ± SD are shown. **P < .01 by one-way ANOVA. (d-e) Wound healing assays showing that the migration of HN6 and CAL27 cells was reduced by MYCi975 treatment. Means ± SD are shown. **P < .01 by one-way ANOVA. (f) Representative image of tumor samples harvested from subcutaneous tumor models in nude mice. (g) Tumor weights of subcutaneous tumor models in nude mice after 4 weeks of treatment with MYCi975. **P < .01 by an unpaired Student’s t test. (h) Tumor volume growth curve of subcutaneous tumor models in nude mice. **P < .01 by an unpaired Student’s t test. (i) Mice weight after 4 weeks of treatment with MYCi975. ns, not significant by an unpaired Student’s t test.
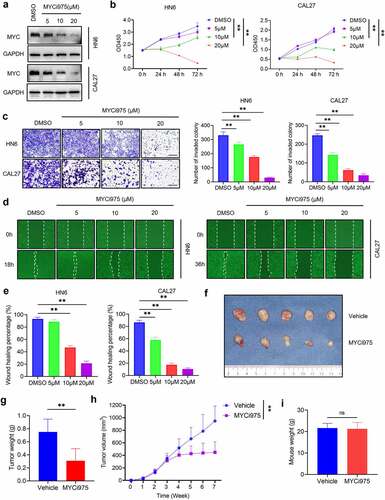
To explore the therapeutic effect of MYCi975 on HNSCC in vivo, we constructed a subcutaneous dorsal cell line-derived xenograft model in nude mice. The tumor volume and weight of the xenografts treated with MYCi975 were reduced comparted with those treated using control vehicle (). Compared with that in the control group, the weight of the mice treated with MYCi975 did not change significantly, suggesting that the mice tolerated MYCi975 treatment ().
MYC inhibition increases the tumor cell-intrinsic immune response through the cGAS-STING signaling pathway
Previous studies showed that MYC is associated with the DNA damage response.Citation29–31 Consistently, we confirmed that the level of p-H2A.X, a specific marker for DNA damage, was significantly increased in cells treated with MYCi975 ( a and b). Then, we used a comet assay, a gel electrophoresis–based method that can be used to measure DNA damage in individual eukaryotic cells. Under an electrophoretic field, damaged cellular DNA (containing fragments and strand breaks) is separated from intact DNA, yielding a classic “comet tail” shape under the microscope. The extent of DNA damage is usually estimated visually by comet tail measurement. Comet assays showed that MYCi975 treatment significantly increased the comet tail moment in HN6 and CAL27 cells ( c and d), indicating increased DNA damage. To examine whether DNA damage in the nucleus induced by MYC inhibition could result in the accumulation of cytosolic dsDNA, we stained live HNSCC cells with PicoGreen, a dsDNA-specific vital dye. It was reported that PicoGreen also stains mitochondrial DNA;Citation32 therefore, mitochondrial DNA was visualized using MitoTracker staining to exclude its interference during the quantification of cytosolic dsDNA. Multiple PicoGreen staining areas were observed in the cytoplasm of HN6 and CAL27 cells, which did not overlap with the MitoTracker staining, upon MYCi975 treatment, indicating that MYCi975 induced the accumulation of cytosolic dsDNA ().
Figure 4. MYC inhibition induces DNA damage and activates the cGAS-STING signaling pathway. (a) Western blot analysis of p-H2A.X in HN6 and CAL27 with or without MYCi975 treatment. H3 was used as the internal control. (b) Immunofluorescent staining and quantification of p-H2A.X (red) in HN6 and CAL27 cells with or without MYCi975 treatment. Nuclei were stained using DAPI (blue). Means ± SD are shown from three independent experiments. Scale bar, 50 μm. **P < .01 by an unpaired Student’s t test. (c-d) Representative images and quantification of DNA Comet assays in HN6 and CAL27 cells treated with MYCi975. More than 100 cells were analyzed per group. Means ± SD are shown. Scale bar, 100 μm. **P < .01 by an unpaired Student’s t test. (e) Confocal microscopy images showing cytosolic DNA accumulation and quantification in HN6 and CAL27 cells with MYCi975 treatment. Double-stranded DNA (dsDNA) was stained using PicoGreen (green). Mitochondria and nuclei were stained using MitoTracker (Red) and DAPI (blue), respectively. The white arrows indicate cytosolic dsDNA. Scale bar, 10 μm. More than 100 cells were analyzed per group. Means ± SD are shown. **P < .01 by an unpaired Student’s t test. (f) Western blot analysis of phosphorylation of STING, TBK1, and IRF3 in HN6 and CAL27 cells treated with MYCi975. GAPDH was used as the internal control. (g) Immunofluorescent staining of p-IRF3 (green) in HN6 and CAL27 cells after MYCi975 treatment and their quantification. Nuclei are stained using DAPI (blue). Means ± SD are shown from three independent experiments. Scale bar, 50 μm. **P < .01 by an unpaired Student’s t test.
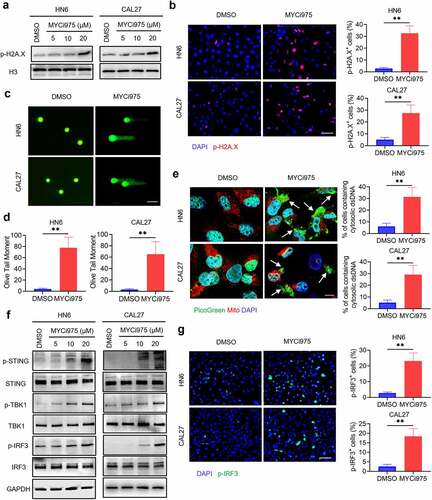
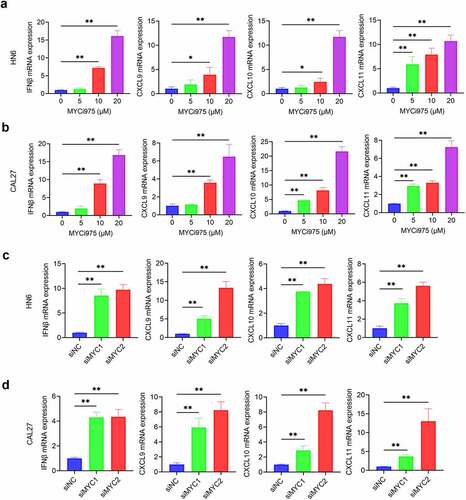
DNA damage can activate a tumor immune response.Citation28,Citation33–35 The accumulation of cytosolic DNA can activate the cyclic guanosine monophosphate (GMP)-AMP synthase-stimulator of interferon (IFN) gene (cGAS-STING) signaling axis by the sequential phosphorylation of STING, TBK1, and IRF3. Then, phosphorylated IRF3 dimerizes and translocates to the nucleus to trigger the expression of IFN and IFN-regulated chemokines,Citation36 including C-X-C motif chemokine ligand (CXCL)9, CXCL10, and CXCL11.Citation37 Western blot analysis showed that MYC inhibition enhanced the levels of phosphorylated STING, TBK1, and IRF3 in HN6 and CAL27 cells (). Consequently, MYC inhibition increased the mRNA expression of IFNβ, CXCL9, CXCL10, and CXCL11 in HN6 and CAL27 cells (). Immunofluorescent staining also demonstrated that phospho-IRF3 (p-IRF3) was increased in HN6 and CAL27 cells treated with MYCi975 (), which further confirmed that MYC exerts its inhibitory effects by activating the cGAS-STING signaling pathway.
Figure 5. MYC inhibition induces expression of CD8+ T cell-attracting chemokines in HNSCC cells. (a-b) The mRNA expression of IFNβ, CXCL9, CXCL10, and CXCL11 in HN6 and CAL27 cells were induced by MYCi975. Means ± SD are shown. *P < .05 and **P < .01 by one-way ANOVA. (c-d) The mRNA expression of IFNβ, CXCL9, CXCL10, and CXCL11 in HN6 and CAL27 cells were induced by MYC knockdown. Means ± SD are shown. *P < .05 and **P < .01 by one-way ANOVA.
MYC inhibitor promotes CD8+ T cell infiltration in vivo
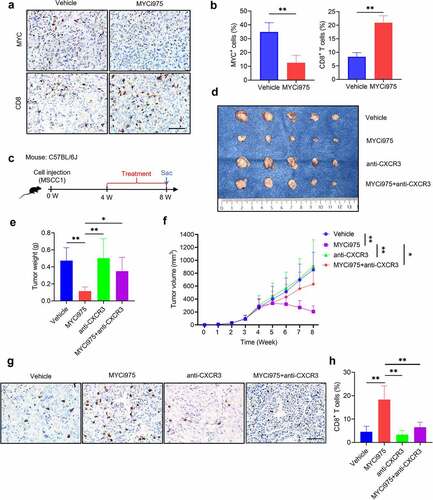
CXCR3 is activated by CXCL9, CXCL10, and CXCL11, and then mediates the recruitment of CD8+ T cells into tumors.Citation38 MYC knockdown induced the expression of CXCL9, CXCL10, and CXCL11; therefore, we proposed that MYCi975 could promote CD8+ T cell infiltration in HNSCC. MSCC1 cells were injected into the subcutaneous dorsal region of immune-competent mice to construct a syngeneic murine model. After MYCi975 treatment, MYC protein expression was reduced, while CD8+ T cell infiltration increased ( a and b). To further confirm that the MYC inhibitor promoted CD8+ T cell infiltration through CXCR3 mediation, mice were divided into four groups and treated with vehicle, MYCi975, anti-CXCR3, and MYCi975 plus anti-CXCR3 (). The volume and weight of the tumor xenografts showed that anti-CXCR3 partially reversed the MYCi975-mediated inhibition of HNSCC development () and the increase in CD8+ T cells ( g and h).
Figure 6. MYC inhibition promotes CD8+T cell infiltration in vivo. (a) Immunostaining showing that MYCi975 inhibits MYC expression and promotes CD8+ T cell infiltration in the same view of the slice. Scale bar, 50 μm. (b) Quantification of the percentage of MYC+ or CD8+ T cells in vivo after MYCi975 treatment. Means ± SD are shown. n = 3, **P < .01 by an unpaired Student’s t test. (c) Experimental design for MYCi975 and anti-CXCR3 treatment in vivo. MSCC1 cells were injected into the dorsal subcutaneous region of C57BL/6 J mice. Four weeks after injection, tumor-bearing mice were randomly divided into four experimental groups (n = 5 per group): control vehicle, MYCi975, anti-CXCR3, and MYCi975 plus anti-CXCR3. Mice were sacrificed after treatment for 4 weeks. (d) Representative image of tumor samples harvested from subcutaneous tumor models in C57BL/6 J mice. (e) Tumor weights of subcutaneous tumor models in C57BL/6 J mice after 4 weeks of treatment. *P < .05 and **P < .01 by one-way ANOVA. (f) Tumor volume growth curve of subcutaneous tumor models. *P < .05 and **P < .01 by one-way ANOVA. (g) Representative images of CD8+ T cell infiltration in vivo after treatment. MYCi975 promoted CD8+ T cell infiltration and anti-CXCR3 reversed the immune activation by MYCi975. Scale bar, 50 μm. (h) Quantification of the percentage of CD8+ T cells in vivo after treatment. Values are the mean ± SD. **P < .01 by one-way ANOVA.
High MYC combined with low CD8+ T cell infiltration in HNSCC correlates with poor prognosis
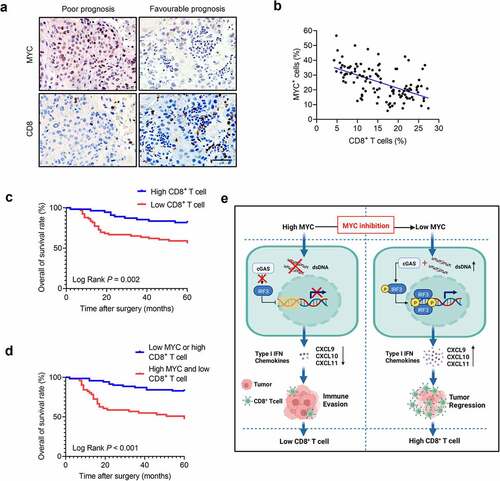
The numbers of infiltrated CD8+ T cells were increased in HNSCC treated with MYCi975; therefore, we investigated the relationship between MYC expression and CD8+ T cells in HNSCC samples. The results showed that MYC expression correlated negatively with CD8+ T cell numbers in HNSCC ( a and b). Moreover, the number of infiltrated CD8+ T cells in HNSCC correlated with the pathological stage, lymph node metastasis, clinical stage (Table S3), and 5-year overall survival (). Given that MYC expression and CD8+ T cell infiltration correlated negatively in clinical HNSCC samples, we further analyzed patient subgroups based on the combination of MYC expression and CD8+ T cell infiltration. With the average MYC expression and CD8+ T cell infiltration chosen as the cutoff points, two subgroups were assigned: the “high MYC and low CD8+ T cell” group and the “low MYC or high CD8+ T cell” group. Kaplan–Meier curves showed that patients with high MYC expression and low CD8+ T cell infiltration correlated closely with poor overall survival (). To explore the independent factors influencing the prognosis of HNSCC, we conducted a univariate analysis of the impact of clinical characteristics of HNSCC on 5-year overall survival (Figure S1). Factors with P-values < 0.1 were then included in a Multivariate Cox regression model to identify independent factors associated with overall survival. The multivariate Cox regression model showed that high MYC expression and low CD8+ T cell infiltration in HNSCC, and clinical stage (III/Ⅳ) were associated with poor prognosis in terms of 5-year overall survival, independent of other factors ().
Table 1. Multivariate Cox regression analysis of the overall survival of patients with HNSCC.
Figure 7. CD8+ T cell infiltration density is negatively associated with the MYC protein levels in patients with HNSCC. (a) Immunostaining of human HNSCC samples showing that high MYC levels correlated with low CD8+T cell infiltration density and low MYC levels correlated with high CD8+T cell infiltration density in the same view of the slice. Scale bar, 50 μm. (b) CD8+ T cell infiltration density correlates negatively with MYC protein level in human HNSCC samples (n = 121). The Pearson correlation coefficient of linear regression was used to determine the correlation between different proteins. (c) Kaplan–Meier curves with log-rank tests showing that patients with high CD8+ T cell infiltration density had longer survival (P = .002). (d) Kaplan–Meier curves with log-rank tests showing that patients with “high expression of MYC and low CD8+ T cell infiltration” had significantly shorter survival than those with “low expression of MYC or high CD8+ T cell infiltration” (P < .001). (e) A diagram of the mechanism by which MYC inhibition eliminates tumors and activates antitumor immunity.
Discussion
Growing evidence indicates that MYC regulates tumorigenesis through a variety of mechanisms, and is functionally involved in up to 70% of all human cancers.Citation9 Multiple studies demonstrated that MYC plays an important role in tumorigenesis, and is regarded as an attractive target for cancer therapy.Citation16–20,Citation39 In this study, we confirmed in a relatively large patient population that MYC was increased in HNSCC, and correlated with lymph node metastasis and poor prognosis. Moreover, we focused on testing whether MYCi975, a novel MYC small molecule inhibitor, could inhibit HNSCC growth in preclinical animal models. Mechanistically, while MYCi975 induced HNSCC cell apoptosis, it also activated antitumor immunity by recruiting CD8+ T cells (). Our preclinical studies suggest that targeting MYC using MYCi975 might be a new strategy to effectively inhibit HNSCC growth.
Previous studies investigated the role of targeting MYC for tumor therapy by inhibiting MYC indirectly, such as using bromodomain containing 4 (BRD4) inhibitors.Citation17,Citation40,Citation41 JQ1 is a well-known BRD4 inhibitor that can inhibit MYC in various solid tumors.Citation42–44 However, its inhibition of MYC in HNSCC is controversial. Previous studies have shown that JQ1 can significantly reduce the expression of MYC and inhibit HNSCC growth.Citation40,Citation45,Citation46 By contrast, a recent study showed JQ1 only mildly inhibited MYC in HNSCC, and uniquely controlled a set of cancer stemness-associated genes instead of MYC.Citation41 Thus, the inhibition of MYC by JQ1 in HNSCC requires further study.
MYCi975 increases the number of infiltrated T cells, and sensitizes prostate and lung cancers to anti-PD1 immunotherapy.Citation25 Similarity, our results confirmed that MYCi975 activated the anti-tumor immune response and increased the number of tumor-infiltrating CD8+ T cells in HNSCC. Cytotoxic CD8+ T lymphocytes have an important antitumoral activity by recognizing and destroying tumor cells. The presence of CD8+ T lymphocyte infiltration is therefore related to a favorable prognosis.Citation47 Growing evidence suggests that tumor resistance to ICI therapy is probably caused by lack of CD8+ T cell infiltration into the tumor microenvironment after treatment.Citation48 HNSCC induces an immunosuppressive tumor microenvironment with low numbers of tumor-infiltrating lymphocytes,Citation27,Citation49,Citation50 suggesting that HNSCC might have an intrinsic anti-immunotherapy mechanism. MYC exerts multiple biological effects on cellular programs that influence both cell-intrinsic biology as well as the tumor immune microenvironment.Citation10 MYC contributes to cancer cell immune evasion, and prevents tumor cells from being attacked by immune cells.Citation10 We analyzed 121 human HNSCC samples to explore the correlation between MYC expression and CD8+ T cell infiltration in HNSCC. The results showed that MYC expression correlated negatively with CD8+ T cells in HNSCC. These findings demonstrated that low levels of tumor-infiltrating lymphocytes might be caused by high expression of MYC in HNSCC.
Previous studies showed that MYC inactivation leads to cellular senescence and DNA damage.Citation51,Citation52 We demonstrated that MYCi975 activates the tumor cell-intrinsic immune response through the cGAS-STING signaling pathway. Initially, we observed that the level of p-H2A.X, a well-known marker of DNA damage, was increased in HNSCC after MYCi975 treatment. Then, consistent with DNA damage, we confirmed the accumulation of cytosolic dsDNA, which subsequently activated the STING-TBK1-IRF3 pathway to induce the expression of the type I IFN chemokines (CXCL9, CXCL10, and CXCL11). CXCR3 is a cytotoxic T cell-associated chemokine receptor that is activated by its chemokine ligands CXCL9, CXCL10, and CXCL11.38,Citation53 The results of in vivo rescue assays showed that anti-CXCR3 partially reversed MYCi975-mediated antitumor effects and increased the number of CD8+ T cells, indicating that MYCi975 regulated the tumor immune microenvironment through chemokines.
ICI therapy has emerged as a new type of clinical treatment for cancer. However, the response rate of HNSCC to ICI therapy is only around 20–30%,Citation21 and the majority of HNSCC tumors are non-responsive. Thus, combined therapy comprising ICI and other agents is required. Combining anti-PD-1/PD-L1 therapy with other treatment methods such as surgery, chemotherapy, radiotherapy, molecular targeted therapy, or other immunotherapies has been approved to treat recurrent or metastatic HNSCC.Citation3 Our previous study showed that targeting BMI1 in HNSCC could enable ICI therapy to inhibit metastatic tumor growth and prevent tumor relapse.Citation28 Growing evidence shows that response to checkpoint inhibition is limited to immunogenic tumors that express checkpoint proteins, such as PD-L1 and/or contain tumor infiltrating CD8+T cells within the local tumor microenvironment.Citation54 Previous studies showed that MYC is a regulator of PD-L1,23,Citation43,Citation55 and the combination of JQ1 and ICI therapy resulted in synergistic inhibition of pancreatic cancer growth.Citation43 Very recently, MYC expression has been found to correlate with non-responsiveness to ICI therapy in HNSCC.Citation56 Our findings have important implications in developing new treatments for HNSCC using MYCi975 to activate tumor cell-intrinsic immune responses. A large number of PD1 blockade-based combination therapies are in clinical trials, suggesting that MYCi975 could be used to enhance the sensitivity of HNSCC to ICI therapy in the future.
Given that MYC inhibition increased the number of tumor-infiltrated CD8+ T cells, we combined MYC expression and CD8+ T cell infiltration to predict the prognosis of patients with HNSCC. The results showed that patients with “high MYC expression and low CD8+ T cell infiltration” had the worst 5-year overall survival. These results demonstrated that MYC expression combined with CD8+ T cell infiltration correlates closely with HNSCC prognosis. Recently, depth of invasion (DOI) and extranodal extension (ENE) in oral cavity cancer have been considered as important factors in determining prognosis.Citation57,Citation58 In the newly published 8th edition of the TNM,Citation59 DOI and ENE were included. Thus, we will further explore the relationship among DOI, ENE and HNSCC prognosis in future research.
There are still some limitations to this study. The “cell line-derived xenograft model” does not fully reflect the diversity and heterogeneity of tumors. Patient-derived tumor xenograft (PDX) models are based on the implantation of fresh cancer tissue fragments from patients directly into immunodeficient mice, which represents a reliable preclinical model because of the retention of cellular heterogeneity and the molecular characteristics of the original tumor.Citation60 Thus, our results require further validation using a PDX model.
HNSCC frequently metastasizes to cervical lymph nodes, and the poor prognosis of patients with HNSCC is closely associated with lymph node metastasis.Citation61,Citation62 Although a subcutaneous tumor model is the most popular assessment system for the in vivo efficacy evaluation of novel anti-cancer medicine candidates, it is not a suitable animal model to assess tumor metastasis. The effect of MYCi975 on the inhibition of HNSCC lymph node metastasis still needs to be confirmed via an orthotopic HNSCC model, in which we orthotopically transplant HNSCC cells into the mouse tongue.Citation63
In summary, our results demonstrated that MYC serves as a tumorigenic factor, driving HNSCC progression. MYCi975 could inhibit tumor growth and regulate tumor CD8+ T cell infiltration through chemokines by activating the cGAS-STING pathway in HNSCC. This indicated that targeting MYC in HNSCC could be an effective therapeutic strategy. We proposed MYCi975 as a potential therapeutic targeted drug for clinical trials to treat HNSCC.
Supplemental Material
Download Zip (390.6 KB)Data availability statement
The data that support the findings of this study are available from the corresponding authors XP and LFJ, upon reasonable request.
Disclosure statement
The authors have no conflicts of interest relevant to this article to disclose.
Supplementary material
Supplemental data for this article can be accessed online at https://doi.org/10.1080/2162402X.2022.2130583
Additional information
Funding
References
- Siegel RL, Miller KD, Fuchs HE, Jemal A. Cancer statistics, 2022. CA Cancer J Clin. 2022;72(1):7–13. doi:10.3322/caac.21708.
- De Felice F, Musio D, Terenzi V, Valentini V, Cassoni A, Tombolini M, De Vincentiis M, Tombolini V. Treatment improvement and better patient care: which is the most important one in oral cavity cancer? Radiat Oncol. 2014;9(1). doi:10.1016/j.ejphar.2021.174345
- Machiels JP, Rene Leemans C, Golusinski W, Grau C, Licitra L, Gregoire V. Squamous cell carcinoma of the oral cavity, larynx, oropharynx and hypopharynx: EHNS-ESMO-ESTRO clinical practice guidelines for diagnosis, treatment and follow-up. Ann Oncol. 2020;31(11):1462–1475. doi:10.1016/j.annonc.2020.07.011
- De Sanctis V, Belgioia L, Cante D, La Porta MR, Caspiani O, Guarnaccia R, Argenone A, Muto P, Musio D, De Felice F, et al. Lactobacillus brevis CD2 for prevention of oral mucositis in patients with head and neck tumors: a multicentric randomized study. Anticancer Res. 2019;39(4):1935–1942. doi:10.21873/anticanres.13303
- AC C, TA D, Bw N. Oral cavity and oropharyngeal squamous cell carcinoma–an update. CA Cancer J Clin. 2015;65(5):401–421. doi:10.3322/caac.21293.
- Hedberg ML, Goh G, Chiosea SI, Bauman JE, Freilino ML, Zeng Y, Wang L, Diergaarde BB, Gooding WE, Lui VW, et al. Genetic landscape of metastatic and recurrent head and neck squamous cell carcinoma. J Clin Invest. 2016;126(4):1606. doi:10.1172/JCI86862
- Lee YS, Johnson DE, Grandis JR. An update: emerging drugs to treat squamous cell carcinomas of the head and neck. Expert Opin Emerg Drugs. 2018;23(4):283–299. doi:10.1080/14728214.2018.1543400.
- Meyer N, Penn LZ. Reflecting on 25 years with MYC. Nat Rev Cancer. 2008;8(12):976–990. doi:10.1038/nrc2231.
- Dang CV. MYC on the path to cancer. Cell. 2012;149(1):22–35. doi:10.1016/j.cell.2012.03.003.
- Dhanasekaran R, Deutzmann A, Mahauad-Fernandez WD, Hansen AS, Gouw AM, Felsher DW. The MYC oncogene - the grand orchestrator of cancer growth and immune evasion. Nat Rev Clin Oncol. 2022;19(1):23–36. doi:10.1038/s41571-021-00549-2.
- Dalla-Favera R, Martinotti S, Gallo RC, Erikson J, Croce CM. Translocation and rearrangements of the c-myc oncogene locus in human undifferentiated B-cell lymphomas. Science. 1983;219(4587):963–967. doi:10.1126/science.6401867.
- Gurel B, Iwata T, Koh CM, Jenkins RB, Lan F, Van Dang C, Hicks JL, Morgan J, Cornish TC, Sutcliffe S, et al. Nuclear MYC protein overexpression is an early alteration in human prostate carcinogenesis. Mod Pathol. 2008;21(9):1156–1167. doi:10.1038/modpathol.2008.111
- Jain S, Wang X, Chang CC, Ibarra-Drendall C, Wang H, Zhang Q, Brady SW, Li P, Zhao H, Dobbs J, et al. Src inhibition blocks c-Myc translation and glucose metabolism to prevent the development of breast cancer. Cancer Res. 2015;75(22):4863–4875. doi:10.1158/0008-5472.CAN-14-2345
- Karim RZ, Tse GMK, Putti TC, Scolyer RA, Lee CS. The significance of the Wnt pathway in the pathology of human cancers. Pathology. 2004;36(2):120–128. doi:10.1080/00313020410001671957.
- Kress TR, Sabo A, Amati B. MYC: connecting selective transcriptional control to global RNA production. Nat Rev Cancer. 2015;15(10):593–607. doi:10.1038/nrc3984.
- Foley SA, Casten A, Kavanagh E, Synnott NC, Crown J, Larsson LG, Duffy MJ. MYC as a therapeutic target for the treatment of triple-negative breast cancer. J Clin Oncol. 2019;37(15):e12550–e12550. doi:10.1200/JCO.2019.37.15_suppl.e12550
- Ghaffarnia R, Nasrollahzadeh A, Bashash D, Nasrollahzadeh N, Mousavi SA, Ghaffari SH. Inhibition of c-Myc using 10058-F4 induces anti-tumor effects in ovarian cancer cells via regulation of FOXO target genes. Eur J Pharmacol. 2021;908:174345. doi:10.1016/j.ejphar.2021.174345
- Zhou Y, Gao X, Yuan M, Yang B, He Q, Cao J. Targeting myc interacting proteins as a winding path in cancer therapy. Front Pharmacol. 2021;12:748852. doi:10.3389/fphar.2021.748852
- Zhu L, Chen Z, Zang H, Fan S, Gu J, Zhang G, Sun KD, Wang Q, He Y, Owonikoko TK, et al. Targeting c-Myc to overcome acquired resistance of EGFR Mutant NSCLC cells to the third-generation EGFR tyrosine kinase inhibitor, osimertinib. Cancer Res. 2021;81(18):4822–4834. doi:10.1158/0008-5472.CAN-21-0556
- Ala M. Target c-Myc to treat pancreatic cancer. Cancer Biol Ther. 2022;23(1):34–50. doi:10.1080/15384047.2021.2017223.
- Ferris RL, Blumenschein G Jr., Fayette J, Guigay J, Colevas AD, Licitra L, Harrington K, Kasper S, Vokes EE, Even C, et al. Nivolumab for recurrent squamous-cell carcinoma of the head and neck. N Engl J Med. 2016;375(19):1856–1867. doi:10.1056/NEJMoa1602252
- Cohen EEW, Bell RB, Bifulco CB, Burtness B, Gillison ML, Harrington KJ, Le Q-T, Lee NY, Leidner R, Lewis RL, et al. The society for immunotherapy of cancer consensus statement on immunotherapy for the treatment of squamous cell carcinoma of the head and neck (HNSCC). J Immunother Cancer. 2019;7(1):184. doi:10.1186/s40425-019-0662-5
- Liang MQ, Yu FQ, Chen C. C-Myc regulates PD-L1 expression in esophageal squamous cell carcinoma. Am J Transl Res. 2020;12:379–388.
- Truica MI, Burns MC, Han HY, Abdulkadir SA. Turning up the heat on MYC: progress in small-molecule inhibitors. Cancer Res. 2021;81(2):248–253. doi:10.1158/0008-5472.Can-20-2959.
- Han H, Jain AD, Truica MI, Izquierdo-Ferrer J, Anker JF, Lysy B, Sagar V, Luan Y, Chalmers ZR, Unno K, et al. Small-molecule MYC inhibitors suppress tumor growth and enhance immunotherapy. Cancer Cell. 2019;36(5):483–497 e415. doi:10.1016/j.ccell.2019.10.001
- Holmes AG, Parker JB, Sagar V, Truica MI, Soni PN, Han H, Schiltz GE, Abdulkadir SA, Chakravarti D. A MYC inhibitor selectively alters the MYC and MAX cistromes and modulates the epigenomic landscape to regulate target gene expression. Sci Adv. 2022;8(17):eabh3635. doi:10.1126/sciadv.abh3635
- Wang ZY, Wu VH, Allevato MM, Gilardi M, He YD, Callejas-Valera JL, Vitale-Cross L, Martin D, Amornphimoltham P, Mcdermott J, et al. Syngeneic animal models of tobacco-associated oral cancer reveal the activity of in situ anti-CTLA-4. Nat Commun. 2019;10. doi:10.1038/s41467-019-13471-0
- Jia L, Zhang W, Wang CY. BMI1 inhibition eliminates residual cancer stem cells after PD1 blockade and activates antitumor immunity to prevent metastasis and relapse. Cell Stem Cell. 2020;27(2):238–253e236. doi:10.1016/j.stem.2020.06.022.
- Yu H, Wu S, Liu S, Li X, Gai Y, Lin H, Wang Y, Edwards H, Ge Y, Wang G. Venetoclax enhances DNA damage induced by XPO1 inhibitors: a novel mechanism underlying the synergistic antileukaemic effect in acute myeloid leukaemia. J Cell Mol Med. 2022;26(9):2646–2657. doi:10.1111/jcmm.17274
- Lu HR, Meng LH, Huang M, Zhu H, Miao ZH, Ding J. DNA damage, c-myc suppression and apoptosis induced by the novel topoisomerase II inhibitor, salvicine, in human breast cancer MCF-7 cells. Cancer Chemother Pharmacol. 2005;55(3):286–294. doi:10.1007/s00280-004-0877-z.
- Veo B, Danis E, Pierce A, Wang D, Fosmire S, Sullivan KD, Joshi M, Khanal S, Dahl N, Karam S, et al. Transcriptional control of DNA repair networks by CDK7 regulates sensitivity to radiation in MYC-driven medulloblastoma. Cell Rep. 2021;35(4):109013. doi:10.1016/j.celrep.2021.109013
- Ashley N, Harris D, Poulton J. Detection of mitochondrial DNA depletion in living human cells using PicoGreen staining. Exp Cell Res. 2005;303(2):432–446. doi:10.1016/j.yexcr.2004.10.013.
- Zhang WC, Liu W, Jia LF, Chen DM, Chang I, Lake M, Bentolila LA, Wang CY. Targeting KDM4A epigenetically activates tumor-cell-intrinsic immunity by inducing DNA replication stress. Mol Cell. 2021;81(10):2148–+. doi:10.1016/j.molcel.2021.02.038
- Ghosh M, Saha S, Bettke J, Nagar R, Parrales A, Iwakuma T, van der Velden AWM, Martinez LA. Mutant p53 suppresses innate immune signaling to promote tumorigenesis. Cancer Cell. 2021;39(4):494–508e495. doi:10.1016/j.ccell.2021.01.003
- Sen T, Rodriguez BL, Chen LM, Della Corte CM, Morikawa N, Fujimoto J, Cristea S, Nguyen T, Diao LX, Li LR, et al. Targeting DNA damage response promotes antitumor immunity through STING-mediated T-cell activation in small cell lung cancer. Cancer Discov. 2019;9(5):646–661. doi:10.1158/2159-8290.Cd-18-1020
- Wu JX, Sun LJ, Chen X, Du FH, Shi HP, Chen C, Chen ZJJ. Cyclic GMP-AMP is an endogenous second messenger in innate immune signaling by cytosolic DNA. Science. 2013;339(6121):826–830. doi:10.1126/science.1229963
- Li T, Chen ZJ. The cGAS-cGAMP-STING pathway connects DNA damage to inflammation, senescence, and cancer. J Exp Med. 2018;215(5):1287–1299. doi:10.1084/jem.20180139.
- Mikucki ME, Fisher DT, Matsuzaki J, Skitzki JJ, Gaulin NB, Muhitch JB, Ku AW, Frelinger JG, Odunsi K, Gajewski TF, et al. Non-redundant requirement for CXCR3 signalling during tumoricidal T-cell trafficking across tumour vascular checkpoints. Nat Commun. 2015;6:7458. doi:10.1038/ncomms8458
- Wang HC, Zhang SS, Zhang Y, Jia JY, Wang JX, Liu XQ, Zhang J, Song XH, Ribback S, Cigliano A, et al. TAZ is indispensable for c-MYC-induced hepatocarcinogenesis. J Hepatol. 2022;76(1):123–134. doi:10.1016/j.jhep.2021.08.021
- Wu YP, Wang YL, Diao PF, Zhang W, Li J, Ge H, Song Y, Li ZW, Wang DM, Liu LK, et al. Therapeutic targeting of BRD4 in head neck squamous cell carcinoma. Theranostics. 2019;9(6):1777–1793. doi:10.7150/thno.31581
- Dong JQ, Li J, Li Y, Ma ZK, Yu YX, Wang CY. Transcriptional super-enhancers control cancer stemness and metastasis genes in squamous cell carcinoma. Nat Commun. 2021;12:1. doi:10.1038/s41467-021-24137-1
- Delmore JE, Issa GC, Lemieux ME, Rahl PB, Shi JW, Jacobs HM, Kastritis E, Gilpatrick T, Paranal RW, Qi J, et al. BET Bromodomain inhibition as a therapeutic strategy to target c-Myc. Cell. 2011;146(6):903–916. doi:10.1016/j.cell.2011.08.017
- Pan Y, Fei QL, Xiong P, Yang JY, Zhang ZY, Lin XC, Pan MG, Lu FC, Huang HG . Synergistic inhibition of pancreatic cancer with anti-PD-L1 and c-Myc inhibitor JQ1. Oncoimmunology. 2019;8:5. doi:10.1080/2162402X.2019.1581529
- Tian Y, Wang XF, Zhao S, Liao X, Younis MR, Wang SJ, Zhang CN, Lu GM. JQ1-loaded polydopamine nanoplatform inhibits c-MYC/programmed cell death ligand 1 to enhance photothermal therapy for triple-negative breast cancer. Acs Appl Mater Inter. 2019;11(50):46626–46636. doi:10.1021/acsami.9b18730
- Wang LM, Wu XY, Huang P, Lv ZJ, Qi YP, Wei XJ, Yang PS, Zhang FH. JQ1, a small molecule inhibitor of BRD4, suppresses cell growth and invasion in oral squamous cell carcinoma. Oncol Rep. 2016;36(4):1989–1996. doi:10.3892/or.2016.5037
- Zhang W, Ge H, Jiang Y, Huang R, Wu YP, Wang DM, Guo SS, Li S, Wang YL, Jiang HB, et al. Combinational therapeutic targeting of BRD4 and CDK7 synergistically induces anticancer effects in head and neck squamous cell carcinoma. Cancer Lett. 2020;469:510–523. doi:10.1016/j.canlet.2019.11.027
- Fridman WH, Pages F, Sautes-Fridman C, Galon J. The immune contexture in human tumours: impact on clinical outcome. Nat Rev Cancer. 2012;12(4):298–306. doi:10.1038/nrc3245.
- Tumeh PC, Harview CL, Yearley JH, Shintaku IP, Taylor EJ, Robert L, Chmielowski B, Spasic M, Henry G, Ciobanu V, et al. PD-1 blockade induces responses by inhibiting adaptive immune resistance. Nature. 2014;515(7528):568–571. doi:10.1038/nature13954
- Polverini PJ, D’Silva NJ, Lei YL. Precision therapy of head and neck squamous cell carcinoma. J Dent Res. 2018;97(6):614–621. doi:10.1177/0022034518769645.
- Tan YS, Sansanaphongpricha K, Prince MEP, Sun D, Wolf GT, Lei YL. Engineering vaccines to reprogram immunity against head and neck cancer. J Dent Res. 2018;97(6):627–634. doi:10.1177/0022034518764416.
- Wu CH, van Riggelen J, Yetil A, Fan AC, Bachireddy P, Felsher DW. Cellular senescence is an important mechanism of tumor regression upon c-Myc inactivation. P Natl Acad Sci USA. 2007;104(32):13028–13033. doi:10.1073/pnas.0701953104.
- Bian X, Wang X, Zhang Q, Ma L, Cao G, Xu A, Han J, Huang J, Lin W. The MYC paralog-PARP1 axis as a potential therapeutic target in MYC paralog-activated small cell lung cancer. Front Oncol. 2020;10:565820. doi:10.3389/fonc.2020.565820
- Watchmaker PB, Berk E, Muthuswamy R, Mailliard RB, Urban JA, Kirkwood JM, Kalinski P. Independent regulation of chemokine responsiveness and cytolytic function versus CD8(+) T cell expansion by dendritic cells. J Immunol. 2010;184(2):591–597. doi:10.4049/jimmunol.0902062
- Pfirschke C, Engblom C, Rickelt S, Cortez-Retamozo V, Garris C, Pucci F, Yamazaki T, Poirier-Colame V, Newton A, Redouane Y, et al. Immunogenic chemotherapy sensitizes tumors to checkpoint blockade therapy. Immunity. 2016;44(2):343–354. doi:10.1016/j.immuni.2015.11.024
- Yi M, Niu MK, Xu LP, Luo SX, Wu KM. Regulation of PD-L1 expression in the tumor microenvironment. J Hematol Oncol. 2021;14:1. doi:10.1186/s13045-020-01027-5
- Noji R, Kano Y, Hirai H, Onishi I, Nishii N, Yoshimura R, Miyake S, Ikeda S, Harada H. MYC-PDL1 axis reduces sensitivity to nivolumab in recurrent head and neck squamous cell carcinoma. Oral Oncol. 2022;124:105666. doi:10.1016/j.oraloncology.2021.105666
- Tam S, Amit M, Zafereo M, Bell D, Weber RS. Depth of invasion as a predictor of nodal disease and survival in patients with oral tongue squamous cell carcinoma. Head Neck-J Sci Spec. 2019;41(1):177–184. doi:10.1002/hed.25506.
- Pilborough AE, Lambert DW, Khurram SA. Extranodal extension in oral cancer: a role for the nodal microenvironment? J Oral Pathol Med. 2019;48(10):863–870. doi:10.1111/jop.12870.
- Brierley JGM, Wittekind C. UICC TNM classification of malignant tumours. 8th. Chichester, UK: Wiley; 2017.
- Lai Y, Wei X, Lin S, Qin L, Cheng L, Li P. Current status and perspectives of patient-derived xenograft models in cancer research. J Hematol Oncol. 2017;10(1):106. doi:10.1186/s13045-017-0470-7.
- Eskander A, Givi B, Gullane PJ, Irish J, Brown D, Gilbert RW, et al. Outcome predictors in squamous cell carcinoma of the maxillary alveolus and hard palate. Laryngoscope. 2013;123(10):2453–2458. doi:10.1002/lary.24079
- Koerdt S, Rockl J, Rommel N, Mucke T, Wolff KD, Kesting MR. Lymph node management in the treatment of oral cancer: analysis of a standardized approach. J Craniomaxillofac Surg. 2016;44(10):1737–1742. doi:10.1016/j.jcms.2016.08.002.
- Jia L, Wang Y, Wang CY. circFAT1 promotes cancer stemness and immune evasion by promoting STAT3 activation. Adv Sci. 2021;8(13):2003376. doi:10.1002/advs.202003376.