
ABSTRACT
Immunogenic cell death (ICD) has been proposed to be a crucial process for antitumor immunosurveillance. ICD is characterized by the exposure and emission of Damage Associated Molecular Patterns (DAMP), including calreticulin (CRT). A positive correlation between CRT exposure or total expression and improved anticancer immunosurveillance has been found in certain cancers, usually accompanied by favorable patient prognosis. In the present study, we sought to evaluate CRT levels in the plasma membrane of CD38+ bone marrow mononuclear cells (BMMCs) isolated from 71 patients with varying degrees of multiple myeloma (MM) disease and examine the possible relationship between basal CRT exposure and the bone marrow immune microenvironment, as well as its connection with different clinical markers. Data show that increased levels of cell surface-CRT were associated with more aggressive clinical features and with worse clinical prognosis in MM. High CRT expression in MM cells was associated with increased infiltration of NK cells, CD8+ T lymphocytes and dendritic cells (DC), indicative of an active anti-tumoral immune response, but also with a significantly higher presence of immunosuppressive Treg cells and increased expression of PD-L1 in myeloma cells.
Introduction
Some studies point to the role of Immunogenic Cell Death (ICD) in the clinical response to chemotherapy or chemoimmunotherapy combinations.Citation1,Citation2 ICD is characterized by the emission of immunogenic molecules known as Damage-Associated Molecular Patterns (DAMP) that include calreticulin (CRT) surface expression and HMGB1 and ATP release, among others. These molecules are released by dying cells and bind to specific receptors in immune cells, like FPR1, TLR3, TLR4 and P2RX7, leading to antitumor immune response. Accumulating clinical evidence supports the notion that DAMPs, especially CRT, could be useful as prognostic biomarkers in cancer.Citation3 Also, dysregulation of CRT has been proposed to play a role in tumorigenesis and cancer progression.Citation4–6 However, clinical studies supporting cell death-associated immunogenicity are still limited and usually do not offer a clear-cut association.Citation7,Citation8 Many studies investigating the role of CRT in ICD assume that CRT exposure is a consequence of the therapy itself and have not considered basal surface expression of CRT on cancer cells and its potential association with malignant transformation or tumor progression. Current data indicate that CRT expression is augmented in tumors compared to healthy tissue and that CRT levels may be associated with cancer aggressiveness and disease progression.Citation3 Different studies have shown that CRT expression could behave as a positiveCitation9–13 or negativeCitation14–16 prognostic factor for cancer patients, depending on the cancer cell type.
Multiple myeloma (MM) is a hematological malignancy caused by the uncontrolled proliferation of abnormal plasma cells (PCs) in the bone marrow (BM). It accounts for 10–20% of all hematological neoplasms and 0.9% of all newly diagnosed cancer cases worldwide.Citation17 Despite radical improvements in treatment regimens in the last decades, MM remains incurable. Although MM patients usually hold a compromised immune system, immunotherapeutic interventions could have the potential to succeed, as suggested by the graft-vs-myeloma effect observed in Autologous Stem Cell Transplantation (ASCT), in donor lymphocyte infusions or by recent reports showing high efficacy of daratumumab.Citation18,Citation19 Thus, ICD could contribute to the success of MM treatments, especially those based on the use of proteasome inhibitors. These agents have been described to induce the emission of DAMPs, especially if autophagy is inhibited.Citation20–23 However, data about the potential of ICD to boost the response of MM cells are very scarce. Recently, De Beck et al. showed that prophylactic vaccination with cells treated with epigenetic compounds delayed disease progression in the 5T33MM murine model.Citation24 In contrast, the only clinical study available indicates that the mutation of the P2X7 receptor is not a prognostic marker in MM.Citation25 However, as previously indicated, ectopic CRT (ecto-CRT) can be increased independently of treatment and have an impact on the prognosis of the disease. These elements have not been studied in depth in the context of MM disease. In the present study, we have determined the ecto-CRT expression in bone marrow mononuclear cells (BMMCs) from MM patients and interrogated its relationship with the clinical outcome and the BM immune landscape. Our data indicate that increased ecto-CRT exposure in MM plasma cells is associated with a poor prognosis of MM disease, since individuals with augmented expression of ecto-CRT exhibit lower time to progression rates and shorter overall survival and increased chances of developing extramedullary plasmacytomas, are heavily pretreated and harbor a high-risk cytogenetic signature. This negative correlation could be associated with an immunosuppressive environment, as suggested by higher Treg percentages and PD-L1 expression in samples with high ecto-CRT levels.
Materials and Methods
Isolation of mononuclear cells from bone marrow samples
All samples were collected and obtained for research purposes with the informed consent from the subjects and the procedure was previously approved by CEICA (Comité Ético de Investigación Clínica de Aragón, PI16/0129). BMMCs were isolated by centrifugation on Ficoll-PaqueTM Plus (GE Healthcare) and resuspended in 10 ml of RPMI1640. Patient characteristics and cytogenetics are summarized in .
Table 1. Clinical characteristics and frequency of cytogenetic determinants of patients (n = 71). Cytogenetic analysis included karyotype, t(11;14), t(4;14), t(14;16), gain 1q, p53 alterations and IGH-FGFR3/IGH-MAF gene fusions. NA, not analyzed.
Analysis of ecto-calreticulin levels
Ecto-CRT analysis using flow cytometry was performed by direct immunostaining. BMMCs (5x10⁵) were collected and incubated with 2 μl of anti-calreticulin-Dylight 488 (Clone FM75, Enzo) conjugated primary antibody (or the corresponding isotype control), 1 μl of 7-AAD and 8 μl of CD38-APC antibody in 100 μl of PBS + 5% of FBS for 30 minutes at 4°C in the darkness. Cells were then washed and resuspended in PBS for flow cytometry analysis. Quantification of the percentage of ecto-CRT positive cells was conducted by gating on the CD38+/7-AAD negative population (Supplementary Figure S1). For some analyses, samples were segregated into two groups (CRThigh and CRTlow) based on the expression of CRT on the surface of CD38+ cells. The stratification cutoff or threshold was the corresponding ecto-CRT median value from the total sample population, which corresponds to a 24% of positivity. The ROC analysis confirmed the suitability of this cutoff (AUC, 1; p-value<0.0001).
Cell surface protein expression by flow cytometry
Protein expression analysis by flow cytometry was performed by direct immunostaining. An appropriate number of cells, freshly isolated after sample collection, were incubated with primary fluorochrome-conjugated antibodies in PBS+5% FBS for 30 minutes at 4°C. Afterward, the cells were centrifuged 300xg for 5 minutes, washed with PBS+5%FBS, resuspended in PBS and analyzed in a BD FACScalibur cytometer.
The following antibodies were used for immunophenotyping of MM cells: CD38-FITC (Clone HIT2), CD138-FITC (Clone MI15), CD56-PE (Clone B159) and CD45-PE-Cy5 (Clone HI30), all from BD Pharmingen. Quantification of the T cell repertoire was performed through staining with the following antibodies: CD4-FITC (Clone RPA-T4, BD), CD8-PE (Clon REA734, Miltenyi) and CD3-APC (Clone UCHT-1, Immunotools). In case of NK cell population determination, CD45-PE-Cy5 (Clone HI30, BD Pharmingen) and CD56-APC (Clone REA196, Miltenyi) antibodies were used. Plasmacytoid and myeloid DCs frequencies were determined by analysis of appropriate lineage markers with the following antibodies: CD14-FITC (Clone M5E2, BD Biosciences), CD19-FITC (Clone LT19, Miltenyi), CD20-FITC (Clone 2H7, BD Biosciences), CD3-FITC (Clone REA613, Miltenyi), CD56-FITC (Clone NCAM-1, BD Biosciences), CD16-FITC (Clone 3G8, BD Biosciences), CD123-PE (Clone 9F5, BD Biosciences), HLA-DR-PerCp-Cy5 (Clone G46-6, BD Biosciences) and CD11c-APC (Clone B-ly6, BD Biosciences). For the analysis of Treg frequencies, CD4-FITC (Clone RPA-T4), CD25-PE (Clone M-A251) and CD127-AlexaFluor647 (Clone HIL-7 R-M21), from BD Pharmingen, markers were analyzed. For PD-L1 expression on CD38+ BMMCs, cells were labeled with anti-PD-L1-PE (Clone 29E.2A3, Biolegend) and anti-CD38-APC (Clone HIT2, BD Pharmingen) antibodies, or the corresponding isotype control. PD-1 expression on specific immune cells was also determined by incubating cells with anti-PD-1-AlexaFluor488 antibody (Clone EH12.2H7, Biolegend) or the corresponding isotype control and gating on the appropriate cell population of interest (NK cells, CD4 or CD8 T cells). Representative images of flow cytometry analyses are shown in Supplementary Figures S2-S6.
Statistical analysis
The statistical analysis was performed using GraphPad Prism 9.0 (GraphPad Software Inc.). As indicated in each case, data were statistically analyzed using the following statistical tests: Mann-Whitney or unpaired t-test for the analysis of two groups of independent samples, Kruskal–Wallis test for multiple comparisons and Chi-square test for trend for comparing the proportions of two nominal variables with small sample sizes. Kaplan-Meier and Cox regression survival analyses were performed with overall survival from the time of sample collection and ecto-CRT analysis as the end point.
Results and discussion
High CRT expression has been reported to be associated with favorable clinical outcomes in endometrial cancer, non-small cell lung cancer (NSCLC), neuroblastoma, glioblastoma, colorectal and ovarian cancer and endometrial cancer patients in which cancer cells expressed high levels of CRT.Citation11,Citation26–28 In the opposite direction, overexpression of CRT could be an adverse prognostic factor in gastric,Citation14 oral squamousCitation29 and pancreaticCitation15 tumors. Also, increased CRT mRNA levels predicted worse clinical outcome in bladder cancer, neuroblastoma and mantle cell lymphoma.Citation16 In hematological malignancies, the predictive value of CRT in prognosis has been explored in acute myeloid leukemia (AML),Citation12 finding a positive correlation between ecto-CRT levels and overall survival.
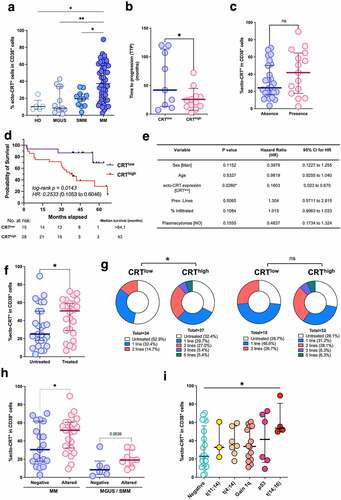
Basal ecto-CRT expression in MM patients was very heterogeneous, with a great interindividual variability. We questioned then whether CRT exposure may vary with the different stages of MM disease. Thereby, we compared ecto-CRT expression in CD38+ plasma cells isolated from control BM (HD), monoclonal gammopathy of undetermined significance (MGUS), smoldering MM (SMM) and MM BM biopsies. Control BM samples corresponded to individuals that may have an underlying pathological state that required a BM aspiration to discard any hematological pathology, but did not harbor any pathological or morphological alteration of the BM. As shown in , CRT exposure clearly increased with disease progression. Mean ecto-CRT expression was significantly higher in MM patients, compared to MGUS, smoldering or control samples. Although slightly increased, differences in CRT exposure between MGUS and SMM were not statistically significant. These results suggest that ecto-CRT may be associated with malignant transformation. Finally, CRThigh individuals, including MGUS and SMM patients that evolved to MM, significantly exhibited a reduced time to progression (TTP) compared to patients displaying low levels of ecto-CRT (median, 22.5 vs 42 months; intervals, 3 to 72 vs 7 to 120), as shown in . Development of soft-tissue plasmacytomas is a sign of the presence of clonal plasma cells growing outside the BM that can appear either in newly diagnosed individuals or during disease progression and patients bearing extramedullary plasmacytomas often exhibit poor clinical outcomes.Citation30,Citation31 Our data show that extramedullary plasmacytomas were more frequent in MM patients with higher levels of ecto-CRT (), although the difference did not reach statistical significance. Kaplan-Meier survival curves of the CRThigh and CRTlow groups indicate that CRThigh group have significant shorter OS (). A significant difference was observed in probability of survival between CRThigh and CRTlow groups in the univariate Mantel-Cox analysis (HR = 0.2533, log-rank p = 0.0143). Multivariate Cox analysis including sex, age, CRT stratification, previous lines of therapy and presence of plasmacytomas also indicated that the CRTlow displayed a lower risk of death (MV HR = 0.1603, p-value = 0.0260, 95% CI 0.023 to 0.670) (). Additionally, we tested whether chemotherapeutic treatment could have any impact over CRT expression on the plasma membrane of myeloma cells. As shown in , samples from patients previously treated with chemotherapy displayed higher levels of ecto-CRT. We also found a significant association between higher expression of surface-CRT and a higher number of lines of therapy when we analyzed all the samples, including MGUS, SMM and MM (, left panel). However, we did not find a significant difference when exclusively considering MM samples (, right panel). Altogether, these results suggest that the levels of ecto-CRT could correlate mainly with disease progression, more than with exposure to chemotherapy. We also interrogated whether a linkage between the expression of ecto-CRT and the presence of cytogenetic abnormalities in MM could also exist. As depicted in , cells from MM patients with an altered cytogenetic signature, significantly revealed augmented ecto-CRT levels compared with patients in which frequent alterations routinely tested were not detected. Higher median ecto-CRT levels were also detected in MGUS and SMM samples with cytogenetic alterations, although in this case the differences were not statistically significant. We dissected the different specific cytogenetic abnormalities harbored by these patients and the exposure of CRT that exhibited in each case (). No significant differences were found in ecto-CRT levels between patients bearing a t(11;14) or t(4;14) translocation and patients with no detected cytogenetic abnormalities. Finally, the high-risk cytogenetic t(14;16), associated with an adverse clinical outcome,Citation32,Citation33 showed significant increased levels of surface-CRT compared to the group without detected cytogenetic abnormalities. Other cytogenetic abnormalities also showed a tendency to higher ecto-CRT levels.
Figure 1. Analysis of CRT exposure in patients with plasma cell dyscrasias. (a) Ecto-CRT levels were determined in CD38+ BMMCs isolated from clinically diagnosed patients with varying degrees of MM disease (MGUS, SMM, MM). Control BM (HD) was obtained from individuals with other pathologies that held an uncompromised BM evidenced by histological or flow cytometry examination. Statistical analysis was performed using one-way ANOVA test with Tukey post test, where *p < .05, **p < .01, ***p < .001, ns, non-significant. (b) Time to progression (TTP) was compared between CRThigh and CRTlow subgroups. Data are shown as median with interquartile range. Statistical analysis was performed using unpaired t test with Welch’s correction (*p < .05). (c) The expression of ecto-CRT in patients showing or not extramedullary plasmacytomas was analyzed. Statistical analysis was performed using Fisher’s exact test, where *p < .05, **p < .01, ***p < .001, ns, non-significant. (d) Kaplan–Meier curve comparing the survival of patients in the CRThigh and CRTlow groups. Overall survival of patients with overt MM was calculated from the time of sample retrieval and CRT analysis. HR was obtained by the univariate log-rank (Mantel-Cox) test. (e) Multivariate Cox regression analysis of the indicated variables. (f) Patients were stratified in two groups (treated and untreated) depending on whether they have previously received any chemotherapeutic regimen or not at the moment when BM sample was collected. Ecto-CRT levels were compared between these two groups. Statistical analysis was performed using two-way t test, where *p < .05, **p < .01, ***p < .001, ns, non-significant. (g) Samples were stratified in two groups based on their median ecto-CRT levels and number of total lines of therapy patients received was compared between CRThigh and CRTlow subgroups. Statistical analysis was performed using Chi-square test for trend (*p < .05, **p < .01, ***p < .001) Left: global analysis; Right: samples from overt MM patients. (h) Individuals with MM or MGUS/SMM diagnosis were stratified depending on their cytogenetic profile and ecto-CRT levels were compared between these two groups. Bars indicated median with interquartile range. Statistical analysis was performed using Mann-Whitney test. (i) Relationship between CRT exposure and the presence of different cytogenetic abnormalities with varying degrees of risk. Statistical analysis was performed by comparing each of the different groups harboring cytogenetic abnormalities with the normal group, using Kruskal-Wallis test where *p < .05.
The present results confirm previous findings showing that total CRT, measured by flow cytometry or RT-PCR methods, is upregulated in MM, compared to MGUS or control samples.Citation34 Our data demonstrate that myeloma cells also display elevated levels of ecto-CRT on their surface that seem to increase with disease progression. This observation, together with the fact that CRT exposure is chemotherapy-independent and patients with an altered cytogenetic signature display increased levels of ecto-CRT, may point toward malignant transformation as the instigator of this molecular event. Other authors have proposed that cancer cells may experience chemotherapy-independent cellular stress that drives DAMP signaling and trafficking. For instance, similar to our data in MM, AMLCitation12,Citation22 and NSCLCCitation10 cancer cells expose increased levels of CRT in their surface, irrespective of the chemotherapeutic regimen administered. Most probably, this could be a consequence of cellular stress caused by the malignant transformation process, which already impinges a prominent burden in many cellular processes, including proteostasis.Citation12 Overexpression of CRT in MM could also be associated with hyperploidy or copy number variants (CNVs) involving chromosome 19 gain, two common events in MM,Citation33 where the CALR gene is located (19p13.3). However, we have observed ecto-CRT high levels in patients with a normal karyotype, indicating that, although trisomy of the chromosome 19 could contribute to increased levels of ecto-CRT, other mechanisms can also be involved.
Our results suggest that higher ecto-CRT expression in MM correlates with presence of more cytogenetic alterations and worse outcome. On the other hand, increased basal ecto-CRT was associated with improved immunosurveillance in AML,Citation35 NSCLCCitation9,Citation10 and ovarian cancer.Citation10 Thus, we wondered whether immune infiltration could be impaired in MM with high ecto-CRT levels. Hence, we evaluated the infiltration of different immune populations in bone marrow samples from MM patients in the CRThigh and CRTlow groups. Regarding the total number of CD3+ T lymphocytes, a strong tendency toward lower total BM CD3+ cells, which did not reach statistical significance (p = 0.07), was encountered in CRThigh samples (, upper left panel). The CRThigh samples exhibited lower total CD4+CD3+ T cells compared to CRTlow samples (, upper middle panel) although they did not arrive to be statistically significant. In contrast, a slight tendency toward higher total CD8+CD3+ T cell frequencies could be noticed in the CRThigh cohort (, upper right panel). Additionally, the proportion of CD4+ cells within the CD3+ subset was reduced in patients with increased ecto-CRT levels, while the percentage of CD8+ T lymphocytes was significantly increased (, lower panels). These differences resulted in a significant reduction of the CD4+/CD8+ ratio in the CRThigh group. The NK frequencies were significantly increased in the CRThigh group (). Total frequencies of different subsets of dendritic cells were also analyzed. Our results indicate that both CD123+HLA-DR+ plasmacytoids (pDCs) and CD11c+HLA-DR+ myeloid DCs (mDCs) subpopulations, were increased in patients with elevated ecto-CRT expression levels (). High CD8+ T cells, NK and DC infiltration could reflect an attempt of the patient's immune system to fight against MM development. Our present results are in accordance with reports showing that a reduced CD4+/CD8+ ratio in MM is associated with shorter survival rates,Citation36 while increased baseline CD4+ T cell levels have been associated with longer survival rates.Citation36,Citation37 Similarly, marrow-infiltrated CD4+ lymphocytes progressively decreased, while CD8+ T cells gradually increased with advancing disease stages.Citation38 We also found that high ecto-CRT correlated with increased percentages of NK cells and DCs. Alone, the high densities of these two immune subsets within the tumor milieu are indicative of good prognosis in a wide variety of human cancers, especially in solid tumors,Citation9,Citation39,Citation40 but it seems not to be the case in MM. We next investigated the presence of Tregs in MM samples, and we found that samples from CRThigh patients displayed higher Tregs infiltration (), suggesting that immunosurveillance could be impaired in MM patients with high ecto-CRT levels. Conflicting data have been reported on the number and functionality of Tregs in the context of MM disease. High percentages of functional CD4+ CD25+ FOXP3+ Tregs have been reported in peripheral blood of MM patients,Citation41–44 but some authors have found no changes,Citation45 reduced peripheral blood frequenciesCitation46 or dysfunctional Tregs in MM.Citation47 Finally, some studies revealed that the median survival rate and TTP of patients with lower Tregs were significantly longer than those with increased Treg numbers,Citation43,Citation44 a fact that would be in agreement with our results.
Figure 2. CRT exposure and the BM immune landscape in MM. Patients were stratified in two different cohorts based on their median ecto-CRT levels. Individuals with an equal or inferior value to the median CRT exposure cutoff of the entire population were deemed CRTlow, while individuals with an ecto-CRT expression level over the median cutoff were classified under CRThigh group. (a) BM frequencies of CD4+CD3+ T cells, CD8+CD3+ T cells, CD3+ T lymphocytes, as well as the percentage of CD4+ and CD8+ T cells within CD3+ population and the corresponding CD4+/CD8+ ratios were analyzed by flow cytometry. (b) The percentage of CD56+CD45+ NK cells in BM was determined by flow cytometry in the CRThigh and CRTlow groups. (c) Plasmacytoid lineage-negative/HLA-DR+/CD123+ DCs (pDCs) and myeloid lineage-negative/HLA-DR+/CD11c+ DCs (mDCs) subpopulations were also analyzed. Lineage-negative cells (Lin-) were determined by staining with FITC-conjugated antibodies against the following markers: CD3, CD14, CD16, CD19, CD20 and CD56. Statistical analysis was performed using two-way t test (*p < .05, **p < .01, ***p < .001). Data plotted in the figure represent the frequency of each cell type in individual samples. The mean and SD values in each patient cohort are also illustrated.
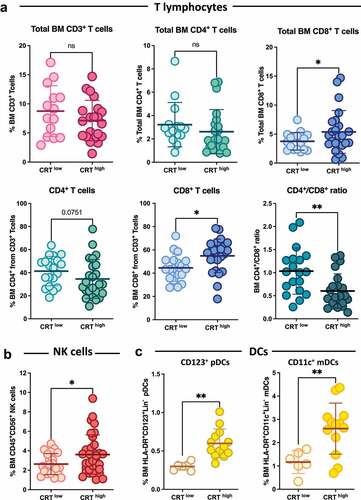
Figure 3. CRT exposure and immunosuppressive markers in MM. Patients were stratified in two different cohorts based on their median ecto-CRT levels. (a) The BM frequencies of Tregs were analyzed in CRThigh and CRTlow samples. (b) PD-L1 expression in CD38+ BM cells was analyzed and compared between CRThigh and CRTlow groups. (c-f) PD-1 expression was analyzed in the indicated immune subpopulations and compared in patient’s subgroups based on their ecto-CRT expression levels. Statistical analysis was performed using two-tail t test (*p < .05, **p < .01, ***p < .001). Data plotted in the figure represent the frequency of each cell type in individual samples. Global mean and SD in each cohort are also illustrated.
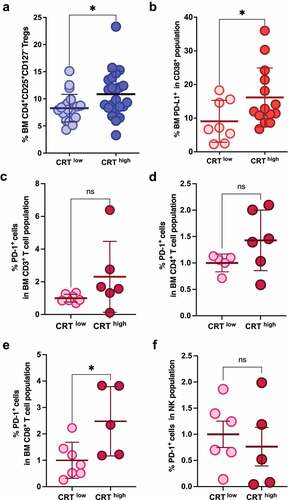
Not only cell numbers but also altered functionality of immune cells could be responsible for the immunosuppressive environment found in MM. For instance, CD8+ T cells from MGUS patients have been shown to be more efficient in targeting autologous transformed plasma cells compared to their MM counterparts.Citation34 Several studies have shown increased expression of inhibitory checkpoint proteins like PD-1, TIM-3, LAG-3 and TIGIT on the surface of T cells (CD4+ or CD8+) in peripheral blood or BM of MM patients.Citation48–51 Additionally, CD8+ T cells in an MM environment can downregulate the costimulatory molecule CD28, upregulate CD57 (indicating low proliferative capacity) and exhibit increased PD-1 expression.Citation52 Moreover, patients bearing T cells with this exhausted or senescent phenotype at baseline or after therapy are the ones with more advance disease stage,Citation51,Citation53 minimal residual disease (MRD) positivityCitation54 or with higher odds of relapse after ASCT.Citation51,Citation52 Also, increased PD-L1 expression in MM cells that has been associated with a more aggressive phenotype and with more advanced disease stages.Citation55–58 On the other hand, downregulation of activating receptors such as NKG2D, NKp30 or DNAM-1 (CD226),Citation59–62 together with the overexpression of inhibitory molecules like PD-1,Citation63 has been found in NK cells from MM patients, potentially contributing to dampening NK effector functions and anti-myeloma activities. Importantly, PD-1 expression on the surface of NK cells seems to correlate with an exhausted phenotype that does not improve with PD-1 blockade by specific checkpoint inhibitors.Citation56,Citation64 Thus, we analyzed the expression of PD-L1 in myeloma cells and PD-1 NK and T cells. CD38+ plasma cells from MM CRThigh samples exhibited significantly increased PD-L1 expression compared to the CRTlow group (). In agreement with these findings, immune effector cells from patients expressing high levels of ecto-CRT revealed an increased expression of the exhaustion marker PD-1, although it was only statistically significant in the CD8+ T cell subset and a small percentage of cells (). Further studies would be needed to clarify the role of the PD-1/PD-L1 axis in the anti-tumor immunosurveillance in MM and its relationship with DAMP exposure.
Conclusions
In summary, our data showed that patients with elevated ecto-CRT levels were associated with increased BM infiltration of immune effectors like CD8+ T cells, NK cells and DCs. Also, the CRThigh cohort harbored more cytogenetic abnormalities, some of which have been correlated with worse prognosis. Our data suggest that CRThigh patients show hints of anticancer immunosurveillance with increased infiltration of NK cells, CD8+ T cells and DCs, reminiscent of a TH1 anticancer immune response. However, CRThigh correlated with expanded immunosuppressive hallmarks like Tregs and PD-L1 expression in myeloma cells. Therefore, attending to the data presented in this study and the panorama discussed above, it can be suggested that CRThigh patients probably carry immune features associated with an undermined and subverted immune microenvironment, which could also be translated into a poor clinical outcome. Other factors might also contribute to explain the negative relationship between CRT exposure and the clinical outcome in MM and should be analyzed in the future to fully depict the immune landscape and the potential of immunotherapies in MM.
Institutional review board statement
The study was conducted according to the guidelines of the Declaration of Helsinki and approved by the Ethics Committee of Instituto Aragonés de Ciencias de la Salud (CEICA, protocol code PI16/0129 and date of approval 05/25/2016). Informed consent was obtained from all subjects involved in the study.
Authorship
Contribution: A.S.V., A.A., J.N. and I.M. designed the study; A.S.V., M.B-V. and N.J-A. performed sample analysis; A.S.V., MB-V and I.M. interpreted and analyzed data; V.P.R, G.A., R.D., B.M-L., I.I. and L.P. collected samples, reviewed patient records and collected data; A.S.V. and I.M. wrote the manuscript. All authors had full access to all data, carefully reviewed the manuscript, and approved the final version.
Supplemental Material
Download MS Word (11.1 MB)Acknowledgments
This research was funded by the grant number SAF2016-76338-R MCIN/AEI/10.13039/501100011033 and by “ERDF A way of making Europe,” grant number PID2019-105128RB-I00 funded by MCIN/AEI/10.13039/501100011033 and grant number B31_20R funded by Gobierno de Aragón.
Disclosure statement
The authors declare no conflict of interest. The funders had no role in the design of the study; in the collection, analyses, or interpretation of data; in the writing of the manuscript, or in the decision to publish the results.
Data availability statement
The data that support the findings of this study are available from the corresponding author, IM, upon reasonable request.
Supplementary material
Supplemental data for this article can be accessed online at https://doi.org/10.1080/2162402X.2022.2141973
Additional information
Funding
References
- Galluzzi L, Buque A, Kepp O, et al. Immunological effects of conventional chemotherapy and targeted anticancer agents. Cancer Cell. 2015;28(6):690–10. doi:10.1016/j.ccell.2015.10.012
- Garg AD, More S, Rufo N, et al. Trial watch: immunogenic cell death induction by anticancer chemotherapeutics. Oncoimmunology. 2017;6(12):e1386829.
- Fucikova J, Kasikova L, Truxova I, et al. Relevance of the chaperone-like protein calreticulin for the biological behavior and clinical outcome of cancer. Immunol Lett. 2018;193:25–34.
- Han A, Li C, Zahed T, et al. Calreticulin is a critical cell survival factor in malignant neoplasms. PLoS Biol. 2019;17(9):e3000402.
- Venkateswaran K, Verma A, Bhatt AN, et al. Emerging roles of calreticulin in cancer: implications for therapy. Curr Protein Pept Sci. 2018;19(4):344–357.
- Zamanian M, Veerakumarasivam A, Abdullah S, et al. Calreticulin and cancer. Pathol Oncol Res. 2013;19(2):149–154.
- Garg AD, De Ruysscher D, Agostinis P. Immunological metagene signatures derived from immunogenic cancer cell death associate with improved survival of patients with lung, breast or ovarian malignancies: a large-scale meta-analysis. Oncoimmunology. 2016;5:e1069938.
- Rapoport BL, Anderson R. Realizing the clinical potential of immunogenic cell death in cancer chemotherapy and radiotherapy. Int J Mol Sci. 2019;20(4).
- Fucikova J, Becht E, Iribarren K, et al. Calreticulin expression in human non-small cell lung cancers correlates with increased accumulation of antitumor immune cells and favorable prognosis. Cancer Res. 2016;76(7):1746–1756.
- Stoll G, Iribarren K, Michels J, et al. Calreticulin expression: interaction with the immune infiltrate and impact on survival in patients with ovarian and non-small cell lung cancer. Oncoimmunology. 2016;5(7):e1177692. doi:10.1080/2162402X.2016.1177692
- Peng RQ, Chen YB, Ding Y, et al. Expression of calreticulin is associated with infiltration of T-cells in stage IIIB colon cancer. World J Gastroenterol. 2010;16(19):2428–2434. doi:10.3748/wjg.v16.i19.2428
- Fucikova J, Truxova I, Hensler M, et al. Calreticulin exposure by malignant blasts correlates with robust anticancer immunity and improved clinical outcome in AML patients. Blood. 2016;128(26):3113–3124. doi:10.1182/blood-2016-08-731737
- Zappasodi R, Pupa SM, Ghedini GC, et al. Improved clinical outcome in indolent B-cell lymphoma patients vaccinated with autologous tumor cells experiencing immunogenic death. Cancer Res. 2010;70(22):9062–9072. doi:10.1158/0008-5472.CAN-10-1825
- Chen CN, Chang CC, Su TE, et al. Identification of calreticulin as a prognosis marker and angiogenic regulator in human gastric cancer. Ann Surg Oncol. 2009;16(2):524–533. doi:10.1245/s10434-008-0243-1
- Sheng W, Chen C, Dong M, et al. Overexpression of calreticulin contributes to the development and progression of pancreatic cancer. J Cell Physiol. 2014;229(7):887–897. doi:10.1002/jcp.24519
- Chao MP, Jaiswal S, Weissman-Tsukamoto R, et al. Calreticulin is the dominant pro-phagocytic signal on multiple human cancers and is counterbalanced by CD47. Sci Transl Med. 2010;2(63):63ra94. doi:10.1126/scitranslmed.3001375
- Bray F, Ferlay J, Soerjomataram I, et al. Global cancer statistics 2018: GLOBOCAN estimates of incidence and mortality worldwide for 36 cancers in 185 countries. CA Cancer J Clin. 2018;68(6):394–424. doi:10.3322/caac.21492
- Ladetto M, Ferrero S, Drandi D, et al. Prospective molecular monitoring of minimal residual disease after non-myeloablative allografting in newly diagnosed multiple myeloma. Leukemia. 2016;30(5):1211–1214. doi:10.1038/leu.2015.269
- Serrano-Del Valle A, Anel A, Naval J, et al. Immunogenic cell death and immunotherapy of multiple myeloma. Front Cell Dev Biol. 2019;7:50.
- Tesniere A, Schlemmer F, Boige V, et al. Immunogenic death of colon cancer cells treated with oxaliplatin. Oncogene. 2010;29(4):482–491.
- Apetoh L, Ghiringhelli F, Tesniere A, et al. The interaction between HMGB1 and TLR4 dictates the outcome of anticancer chemotherapy and radiotherapy. Immunol Rev. 2007;220:47–59.
- Wemeau M, Kepp O, Tesniere A, et al. Calreticulin exposure on malignant blasts predicts a cellular anticancer immune response in patients with acute myeloid leukemia. Cell Death Dis. 2010;1:e104.
- Jarauta V, Jaime P, Gonzalo O, et al. Inhibition of autophagy with chloroquine potentiates carfilzomib-induced apoptosis in myeloma cells in vitro and in vivo. Cancer Lett. 2016;382(1):1–10.
- De Beck L, Melhaoui S, De Veirman K, et al. Epigenetic treatment of multiple myeloma mediates tumor intrinsic and extrinsic immunomodulatory effects. Oncoimmunology. 2018;7(10):e1484981.
- Paneesha S, Starczynski J, Pepper C, et al. The P2X7 receptor gene polymorphism 1513 A–>C has no effect on clinical prognostic markers and survival in multiple myeloma. Leuk Lymphoma. 2006;47(2):281–284.
- Kasikova L, Hensler M, Truxova I, et al. Calreticulin exposure correlates with robust adaptive antitumor immunity and favorable prognosis in ovarian carcinoma patients. J Immunother Cancer. 2019;7(1):312.
- Hsu WM, Hsieh FJ, Jeng M, et al. Calreticulin expression in neuroblastoma–a novel independent prognostic factor. Ann Oncol. 2005;16(2):314–321.
- Xu Q, Chen C, Chen G, et al. Significance of calreticulin as a prognostic factor in endometrial cancer. Oncol Lett. 2018;15(6):8999–9008.
- Harada K, Takenawa T, Ferdous T, et al. Calreticulin is a novel independent prognostic factor for oral squamous cell carcinoma. Oncol Lett. 2017;13(6):4857–4862.
- Usmani SZ, Heuck C, Mitchell A, et al. Extramedullary disease portends poor prognosis in multiple myeloma and is over-represented in high-risk disease even in the era of novel agents. Haematologica. 2012;97(11):1761–1767.
- Chen HF, Wu TQ, Li ZY, et al. Extramedullary plasmacytoma in the presence of multiple myeloma: clinical correlates and prognostic relevance. Onco Targets Ther. 2012;5:329–334.
- Saxe D, Seo EJ, Bergeron MB, et al. Recent advances in cytogenetic characterization of multiple myeloma. Int J Lab Hematol. 2019;41(1):5–14.
- Manier S, Salem KZ, Park J, et al. Genomic complexity of multiple myeloma and its clinical implications. Nat Rev Clin Oncol. 2017;14(2):100–113.
- Racanelli V, Leone P, Frassanito MA, et al. Alterations in the antigen processing-presenting machinery of transformed plasma cells are associated with reduced recognition by CD8+ T cells and characterize the progression of MGUS to multiple myeloma. Blood. 2010;115(6):1185–1193.
- Truxova I, Kasikova L, Salek C, et al. Calreticulin exposure on malignant blasts correlates with improved natural killer cell-mediated cytotoxicity in acute myeloid leukemia patients. Haematologica. 2020;105(7):1868–1878.
- San Miguel JF, Gonzalez M, Gascon A, et al. Lymphoid subsets and prognostic factors in multiple myeloma. cooperative group for the study of monoclonal gammopathies. Br J Haematol. 1992;80(3):305–309.
- Kay NE, Leong T, Bone N, et al. T-helper phenotypes in the blood of myeloma patients on ECOG phase III trials E9486/E3A93. Br J Haematol. 1998;100(3):459–463.
- Corso A, Castelli G, Pagnucco G, et al. Bone marrow T-cell subsets in patients with monoclonal gammopathies: correlation with clinical stage and disease status. Haematologica. 1997;82(1):43–46.
- Fialova A, Partlova S, Sojka L, et al. Dynamics of T-cell infiltration during the course of ovarian cancer: the gradual shift from a Th17 effector cell response to a predominant infiltration by regulatory T-cells. Int J Cancer. 2013;132(5):1070–1079.
- Galon J, Costes A, Sanchez-Cabo F, et al. Type, density, and location of immune cells within human colorectal tumors predict clinical outcome. Science. 2006;313(5795):1960–1964.
- Beyer M, Kochanek M, Giese T, et al. In vivo peripheral expansion of naive CD4+CD25high FoxP3+ regulatory T cells in patients with multiple myeloma. Blood. 2006;107(10):3940–3949.
- Feyler S, von Lilienfeld-Toal M, Jarmin S, et al. CD4(+)CD25(+)FoxP3(+) regulatory T cells are increased whilst CD3(+)CD4(-)CD8(-)alphabetaTCR(+) Double Negative T cells are decreased in the peripheral blood of patients with multiple myeloma which correlates with disease burden. Br J Haematol. 2009;144(5):686–695.
- Giannopoulos K, Kaminska W, Hus I, et al. The frequency of T regulatory cells modulates the survival of multiple myeloma patients: detailed characterisation of immune status in multiple myeloma. Br J Cancer. 2012;106(3):546–552.
- Muthu Raja KR, Rihova L, Zahradova L, et al. Increased T regulatory cells are associated with adverse clinical features and predict progression in multiple myeloma. PLoS One. 2012;7(10):e47077.
- Foglietta M, Castella B, Mariani S, et al. The bone marrow of myeloma patients is steadily inhabited by a normal-sized pool of functional regulatory T cells irrespective of the disease status. Haematologica. 2014;99(10):1605–1610.
- Gupta R, Ganeshan P, Hakim M, et al. Significantly reduced regulatory T cell population in patients with untreated multiple myeloma. Leuk Res. 2011;35(7):874–878.
- Prabhala RH, Neri P, Bae JE, et al. Dysfunctional T regulatory cells in multiple myeloma. Blood. 2006;107(1):301–304.
- Gorgun G, Samur MK, Cowens KB, et al. Lenalidomide enhances immune checkpoint blockade-induced immune response in multiple myeloma. Clin Cancer Res. 2015;21(20):4607–4618.
- Kwon M, Kim CG, Lee H, et al. PD-1 Blockade Reinvigorates Bone Marrow CD8(+) T cells from patients with multiple myeloma in the presence of TGFbeta Inhibitors. Clin Cancer Res. 2020;26(7):1644–1655.
- Guillerey C, Harjunpaa H, Carrie N, et al. TIGIT immune checkpoint blockade restores CD8(+) T-cell immunity against multiple myeloma. Blood. 2018;132(16):1689–1694.
- Fostier K, Caers J, Meuleman N, et al. Impact of lenalidomide maintenance on the immune environment of multiple myeloma patients with low tumor burden after autologous stem cell transplantation. Oncotarget. 2018;9(29):20476–20489.
- Chung DJ, Pronschinske KB, Shyer JA, et al. T-cell exhaustion in multiple myeloma relapse after autotransplant: optimal timing of immunotherapy. Cancer Immunol Res. 2016;4(1):61–71.
- Suen H, Brown R, Yang S, et al. Multiple myeloma causes clonal T-cell immunosenescence: identification of potential novel targets for promoting tumour immunity and implications for checkpoint blockade. Leukemia. 2016;30(8):1716–1724.
- Bhutani M, Foureau D, Zhang Q, et al. Peripheral immunotype correlates with minimal residual disease status and is modulated by immunomodulatory drugs in multiple myeloma. Biol Blood Marrow Transplant. 2019;25(3):459–465.
- Dhodapkar MV, Sexton R, Das R, et al. Prospective analysis of antigen-specific immunity, stem-cell antigens, and immune checkpoints in monoclonal gammopathy. Blood. 2015;126(22):2475–2478.
- Reina-Ortiz C, Constantinides M, Fayd-Herbe-de-Maudave A, et al. Expanded NK cells from umbilical cord blood and adult peripheral blood combined with daratumumab are effective against tumor cells from multiple myeloma patients. Oncoimmunology. 2020;10(1):1853314.
- Tamura H, Ishibashi M, Yamashita T, et al. Marrow stromal cells induce B7-H1 expression on myeloma cells, generating aggressive characteristics in multiple myeloma. Leukemia. 2013;27(2):464–472.
- van der Veer MS,de Weers M, van Kessel B, et al. Towards effective immunotherapy of myeloma: enhanced elimination of myeloma cells by combination of lenalidomide with the human CD38 monoclonal antibody daratumumab. Haematologica. 2011;96(2):284–290.
- Costello RT, Boehrer A, Sanchez C, et al. Differential expression of natural killer cell activating receptors in blood versus bone marrow in patients with monoclonal gammopathy. Immunology. 2013;139(3):338–341.
- El-Sherbiny YM, Meade JL, Holmes TD, et al. The requirement for DNAM-1, NKG2D, and NKp46 in the natural killer cell-mediated killing of myeloma cells. Cancer Res. 2007;67(18):8444–8449.
- Jinushi M, Vanneman M, Munshi NC, et al. MHC class I chain-related protein A antibodies and shedding are associated with the progression of multiple myeloma. Proc Natl Acad Sci U S A. 2008;105(4):1285–1290.
- von Lilienfeld-Toal M, Frank S, Leyendecker C, et al. Reduced immune effector cell NKG2D expression and increased levels of soluble NKG2D ligands in multiple myeloma may not be causally linked. Cancer Immunol Immunother. 2010;59(6):829–839.
- Benson DM Jr., Bakan CE, Mishra A, et al. The PD-1/PD-L1 axis modulates the natural killer cell versus multiple myeloma effect: a therapeutic target for CT-011, a novel monoclonal anti-PD-1 antibody. Blood. 2010;116(13):2286–2294.
- Beldi-Ferchiou A, Lambert M, Dogniaux S, et al. PD-1 mediates functional exhaustion of activated NK cells in patients with Kaposi sarcoma. Oncotarget. 2016;7(45):72961–72977.