
ABSTRACT
Tumor-associated macrophages (TAM) and cancer-associated fibroblasts (CAF) and their precursor mesenchymal stromal cells (MSC) are often detected together in tumors, but how they cooperate is not well understood. Here, we show that TAM and CAF are the most abundant nonmalignant cells and are present together in untreated human neuroblastoma (NB) tumors that are also poorly infiltrated with T and natural killer (NK) cells. We then show that MSC and CAF-MSC harvested from NB tumors protected human monocytes (MN) from spontaneous apoptosis in an interleukin (IL)-6 dependent mechanism. The interactions of MN and MSC with NB cells resulted in a significant induction or increase in the expression of several pro-tumorigenic cytokines/chemokines (TGF-β1, MCP-1, IL-6, IL-8, and IL-4) but not of anti-tumorigenic cytokines (TNF-α, IL-12) by MN or MSC, while also inducing cytokine expression in quiescent NB cells. We then identified a TGF-β1/IL-6 pathway where TGF-β1 stimulated the expression of IL-6 in NB cells and MSC, promoting TAM survival. Evidence for the contribution of TAM and MSC to the activation of this pathway was then provided in xenotransplanted NB tumors and patients with primary tumors by demonstrating a direct correlation between the presence of CAF and p-SMAD2 and p-STAT3. The data highlight a new mechanism of interaction between TAM and CAF supporting their pro-tumorigenic function in cancer.
Introduction
The tumor microenvironment (TME) provides multiple mechanisms of therapeutic resistance and immune escape to cancer cells.Citation1–3 Tumor-associated macrophages (TAM) and cancer-associated fibroblasts (CAF) and their precursors, mesenchymal stromal cells (MSC), play an important modulatory role in the TME.Citation4,Citation5 These cells have a significant degree of heterogeneity and can be educated or polarized by tumor cells toward pro- or anti-tumorigenic functions.Citation6,Citation7 TAM and CAF are frequently detected together in tumors, and their presence is often an indicator of poor clinical outcome,Citation8–10 but their ability to cooperate during tumor progression has not been examined in detail.
The rapid development of successful immunotherapies in some cancers and the realization of the critical role of the TME have made the understanding of the TME landscape critically important.Citation11 Hence, a better characterization of the mechanisms and cells involved in inducing a therapy resistant TME will allow for the development of more successful cancer treatment.
Neuroblastoma (NB) is the most common extracranial solid tumor in childrenCitation12 and a cancer where passive immunotherapy has been shown to be effective post-chemotherapy in newly diagnosed patients or in combination with chemotherapy in recurrent and refractory disease.Citation13–15 Fifty percent of the children diagnosed with NB are classified as having a high-risk cancer based on amplification of the MYCN oncogene (MYCN-A), or on unfavorable histological and clinical features.Citation16,Citation17 The presence of an inflammatory signature inclusive of myeloid markers in high-risk NB lacking MYCN amplification (MYCN-NA) also carries a poor prognosis.Citation18 TAM and CAF that share characteristics of MSC are often present in high-risk NB tumors, where each exert a pro-tumorigenic function, promoting tumor cell growth, survival, and resistance to chemotherapy.Citation19–21
Here, we investigated how monocytes (MN)/TAM and CAF or MSC cooperate in the TME of NB tumors and support immune escape of malignant cells.
Materials and methods
Cell lines and human monocytes
Human NB cell lines CHLA-255, SK-N-AS (MYCN-NA), CHLA-136, SK-N-BE(2) (MYCN-A) were established at Children’s Hospital Los Angeles and cultured as previously described.Citation19 Cell line authentication was done by genotype analysis using AmpFISTR® Identifier® PCR Amplification Kit and Gene Mapper ID v3.2 (Applied Biosystems). Some cell lines have been transfected with a Luciferase expression vector or green fluorescent protein (GFP) expression vector. Experiments were conducted with three sources of MSC. Human MSC were obtained from the bone marrow of healthy donors, from the bone marrow of patients with metastatic NB (designated BM-MSC) and collected from freshly resected NB tumors (designated CAF-MSC) as previously described.Citation19 Human monocytes (MN) were isolated from the peripheral blood of healthy blood donors using a protocol previously reported.Citation22 A freshly purified MN preparation from different donors was used for each experiment. MN were routinely tested for viability by trypan blue exclusion and for their ability to differentiate into M1 macrophages in the presence of granulocyte-macrophage colony-stimulating factor (GM-CSF).
When indicated, MN and MSC were pre-incubated with NB cells for 3–5 d. Cells were periodically assessed for the absence of Mycoplasma using MycoAlert™ PLUS Mycoplasma Detection Kit (Lonza).
In vitro cultures
Co-culture experiments were performed in transwell (0.4 µm pore membranes, Corning). Dual co-cultures were performed with a 1:1 ratio for NB:MN and a 4:1 ratio for NB:MSC and MN:MSC. Triple co-culture used a 4:4:1 ratio for NB:MN:MSC. NB cells and MSC were seeded separately the first day and fresh MN added after 24 h in the presence of Iscove’s Modified Dulbecco’s Medium (IMDM) and 2% acid-treated FBS (Ac-FBS) (v/v). Acid treatment of FBS was done by adding 10% 1 N HCl (v/v) for 10 min before the addition of 10% (v/v) 1.2 N NaOH-0.5 M HEPES to reach a pH of 7.4. Heat treatment of FBS was done at 95°C for 15 min. Cultures were maintained for different times depending on the experiments (10 min to 3 d). Cultures were treated as indicated in the legend to the figures.
Treatments, ELISA assays, immune-blot analysis, RNA isolation, quantitative real-time PCR, and immunocytochemistry are detailed in Supplementary Methods.
Ex vivo expansion of activated NK (aNK) cell and in vitro cytotoxicity assays
NK cells isolated from peripheral blood of healthy donors were propagated and activated ex vivo using K562-mbIL21 feeder cells and IL-2, as previously described.Citation23,Citation24 T cells were depleted at d 7 of culture using EasySep™ Human CD3 Positive Selection Kit (StemCell Technologies).
K562-mbIL21-expanded aNK cells were cultured in medium with 100 IU/mL IL-2 and treated either with TGF-β1 or in the presence of triple co-cultures for 3 d. For TGF-β1 treatment, aNK were plated into 24-well plates in the presence of 0–5 ng/mL recombinant TGF-β1. For the triple co-cultures, MN and MSC were plated together in the upper chamber of Transwell plates in the presence of NB cells plated in the lower chamber for 72 h. MN and MSC were then harvested and plated together in the upper chamber with new NB cells in the presence of aNK cells plated alone in the lower chamber of Transwell plates, with or without Galunisertib. For the aNK cytotoxicity assay, GFP-expressing NB cell lines were seeded into individual wells of a 96-well plate, and aNK cells expanded as described above were added to NB cells at a 2:1 effector-to-target ratio. The surviving tumor cells were identified by green fluorescence and quantified by the IncuCyte S3 live-image fluorescence microscopy system during 24 h of co-incubation.
Orthotopic implantation
Animal experiments were performed in accordance with a protocol approved by the Institutional Animal Care Utilization Committee at The Saban Research Institute of Children’s Hospital Los Angeles (Protocol #41-20 approved on October 25, 2020).
Eight- to 12-week-old immunodeficient NOD SCID Gamma (NSG) mice were divided into four groups of four to five mice each and orthotopically implanted with CHLA-255-LUC or CHLA-136-LUC cells alone or mixed with MN, MSC, or a combination of both cell types. Mice were anesthetized using 3–5% inhaled isoflurane. An incision was made to expose the left kidney and the adrenal fat pad or subcapsular space was injected with cells resuspended in 25–30 μL of Matrigel (BD Bioscience). Following tumor implantation, mice were monitored once a week using bioluminescence imaging (Xenogen IVIS 100, Caliper Life Science) to measure luciferase intensity and tumor growth. Mice were sacrificed 3 to 4 weeks post-implantation, and tumors were processed for histological analysis and immunohistochemistry.
Multiplex immunohistochemistry
All studies involving tumor samples from patients were performed in accordance with the ethical standards of the institutional and/or national research committee and with the 1964 Helsinki declaration and its later amendments or comparable ethical standards (Children’s Hospital Los Angeles IRB: CCI-06-00198).
Tumor samples were obtained at diagnosis and 4 μm formalin-fixed paraffin sections were stained using the Leica Biosystems BOND Rx Autostainer. Leica DAB detection kit was used with an AEC-HTP Red substrate (Victor Lab SK-4285). The primary antibodies used are listed in Supplementary Table 2. Sequential staining of the same slide was performed using a protocol from AEC-RedCitation25 with Leica retrieval buffers. Slides were coated with aqueous mounting media, covered with a glass coverslip, and imaged using an Aperio scanner (Leica Biosystems). All slides were reviewed by pathologists’ expert in NB (B.R.P and H.S). Two automatic scoring programs were run using a custom pipeline in FIJI ImageJ softwareCitation26 after images were aligned using the “Linear Stack Alignment with SIFT” plugin.Citation27 The scoring method gave a percentage of the area positivity for one marker by calculating the area of a marker (in pixel) over the area of the nuclei (same control for all markers). The scoring method provided a single-cell analysis with the percentage of cells positive for one or several markers over the total number of cells based on nuclear and cell boundaries estimated with Voronoi lines. The same threshold was used for the two scoring programs. Cells were identified as follows: PHOX2B+ for tumor cells, CD163+ for TAM, αSMA+ adjacent to CD31+ for pericytes, αSMA+ nonadjacent from CD31+ for CAF, αSMA+ CD105+ for MSC, CD31+ for endothelial cells (EC), CD8+ and CD3+ for T cells, CD3- CD94+ for NK cells.
Statistical analysis
For group comparisons, Wilcoxon–Mann–Whitney test, Kruskal–Wallis test, or ANOVA two-way test was used for overall condition effects with GraphPad Prism 9.0 Software (GraphPad). All data are presented as mean ±SEM or ±SD of at least two to five independent experiments with indicated technical replicates. P-value <0.05 was considered statistically significant.
Results
TAM, CAF and MSC are the most abundant nonmalignant cells in the TME of NB tumors
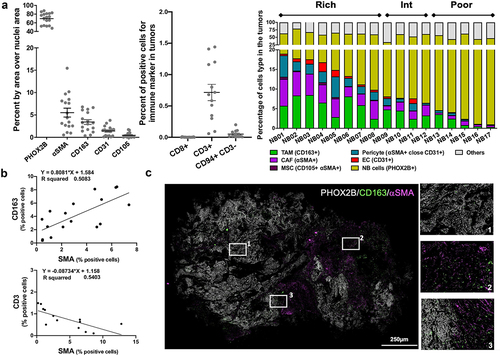
The presence of TAM, CAF and MSC and other TME cells in 17 untreated human NB tumors was examined and quantified by multiplex immunohistochemistry using a panel of eight antibodies to identify tumor cells, TAM, CAF, MSC, endothelial cells (EC), pericytes, T cells and NK cells (, S1A, S1B). Tumors varied in their content of TME cells which represented more than 10% in some tumors (designated TME-rich, n = 8), less than 5% in others (designated TME-poor, n = 5) and between 6% and 9% in tumors designated TME intermediate (n = 4). TAM (3.4% ±0.5 SD) and CAF and MSC (5.6% ±1 SD) were the most abundant stromal cells in these NB tumors that were poorly infiltrated with CD3+ T cells (0.8% ±0.1 SD) and NK cells (0.1% ±0.05 SD) and in which CD8+ T cells were absent (). The joint presence of CD163+ TAM and αSMA+ CAF directly correlated (r2 = 0.51), whereas the presence of CAF inversely correlated with the presence of CD3+ T cells (r2 = 0.54) (). Differences were observed in spatial distribution between CD163+ TAM and αSMA+ CAF, with CAF being present predominantly in connective tissue surrounding tumor nodules, and TAM evenly distributed throughout the entire tumor (). Thus, the data suggest that untreated NB tumors are poorly infiltrated with T and NK cells and can be heavily infiltrated with TAM and CAF. These observations led us to further examine their interaction and cooperation.
Figure 1. TAM, CAF and MSC are the most abundant nonmalignant cells in the TME of NB tumors.
MSC protect MN from spontaneous apoptosis through IL-6 and sIL-6 Rα
We initially examined whether MSC could affect monocytes (MN) or TAM survival. Co-culturing MN with MSC demonstrated a significant decrease in MN apoptosis that was dependent on the MN:MSC cell ratio, with complete suppression of apoptosis at a ratio of 2:1 over a 5-d period (). The anti-apoptotic effect of MSC was observed in MN preincubated with four different NB cell lines to promote their polarization into TAM () and did not vary whether MSC were preincubated with NB cells or whether MSC were obtained from healthy donors, from the bone marrow of patients with NB (BM-MSC) or from NB tumors (CAF-MSC) (Figure S2A). The protective effect of MSC on MN apoptosis was confirmed by flow cytometry experiments that compared cell–cell contact and Transwell co-cultures. These experiments demonstrated a significant increase in live MN and a decrease in late apoptosis after 3 d of co-culture with MSC under both culture conditions (Figure S2B).
Figure 2. MSC protect MN from spontaneous apoptosis through IL-6 and sIL-6Rα.
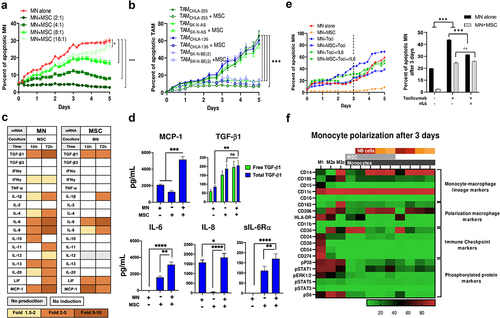
MN and MSC in Transwell co-cultures were then examined by mRNA analysis for the expression of cytokines and chemokines. In the presence of MSC, mRNA expression in MN was increased by >5-fold for several cytokines including transforming growth factor (TGF)-β1, IL-6, IL-8 and monocyte chemoattractant protein (MCP)-1. A similar mRNA analysis of MSC in Transwell co-cultures with MN indicated a > 5-fold increase in IL-6 (, S2C). Consistent with the mRNA data, a protein analysis by ELISA revealed a significant increase in the presence of TGF-β1, IL-6, IL-8 and MCP-1 in the culture medium of MN+MSC co-cultures (). In contrast, tumor necrosis factor (TNF)-α, IL-4, and IL-12 were not detected in the medium of co-cultures and low levels of IL-10 were only detected in MN+MSC co-cultures (Figure S2D). The majority of TGF-β1 was found to be free of its latency-associated pro-peptide (LAP) as experiments were performed in the presence of acid-treated FBS, a process that depleted α2-macroglobulin, an inhibitor of LAP degrading plasminCitation28 (Figure S2E). The agonist-soluble IL-6 receptor α (sIL-6 Rα) was also found to be produced by MSC and its presence increased in co-cultures with MN. The significant increased expression of IL-6 and sIL-6 Rα by MSC in the presence of MN led us to test their role in the pro-survival effect of MSC on MN.
Blocking IL-6 R with a monoclonal antibody (Tocilizumab) resulted in a 70% loss in the protective effect of MSC on MN apoptosis that was not corrected by the addition of rIL6, pointing toward a key role of the IL-6 R (). The addition of rIL6 or rIL6 and sIL-6 Rα to MN resulted in a significant decrease in apoptosis over a 3-d culture period (Figure S2F). In contrast, the addition of Galunisertib, a small-molecule inhibitor of TGF-βR1/ALK5 had no effect on MSC’s anti-apoptotic activity on MN (Figure S2G). The data indicate that the interaction between MN and MSC stimulates their production of pro-tumorigenic cytokines/chemokines and point to an IL-6/IL-6R mediated mechanism by which MSC protect MN from apoptosis.
NB but not MSC promote the polarization of MN into TAM and activate MSC into CAF
A CyTOF-based proteomic analysis of MN in co-culture with MSC and NB cells or with NB cells alone (either CHLA-255, CHLA-136, or SK-N-AS) revealed polarization of monocytes toward a mix M2a, M2c phenotype with increase CD14, CD163, and CD206 markers and low HLA-DR. However, co-cultures of MN with MSC alone led to macrophages that lacked CD14, CD163 or CD206 suggesting an M0 phenotype (, S2H). Thus, macrophage polarization toward an M2-like phenotype was primarily driven by tumor cells and not significantly affected by MSC after 3 d. We also examined the effect of NB and NB+MN on the expression of fibroblast-specific protein (FSP)-1 and fibroblast activation protein (FAP), 2 markers of activation of CAF, and demonstrate an increase in both markers in MSC co-cultured for 72 h with NB or NB and MN (Figure S2I, S2J). The data thus provide evidence that when in co-culture with NB cells, MN and MSC are activated into TAM and CAF, respectively.
CAF and TAM induce the production of several cytokines/chemokines in NB cells
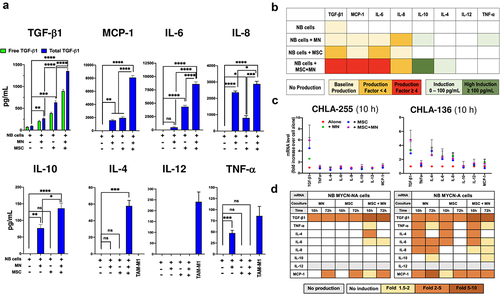
Having shown that in the presence of NB cells, MSC and MN developed characteristics of CAF and TAM, respectively, we then examined whether the production of cytokines/chemokines was affected by the presence of NB cells in triple co-cultures of MN, MSC and NB cells. The analysis of media of NB cells cultured alone revealed that with the exception of TGF-β1 (detected at an average low level of 86.6 ± 11.9 SEM pg/mL), no other cytokine/chemokine was constitutively expressed by NB cells derived from four cell lines examined (). This observation was confirmed by an in-silico gene expression analysis of cytokines/chemokines of 46 NB cell lines from the Cancer Cell Line Encyclopedia (CCLE) (Figure S3A). In contrast, the addition of MN, MSC or their combination to NB cells resulted in a significant increase in cytokine/chemokine production over baseline in dual (NB+MN or NB+MSC) or triple (NB+MN+MSC) culture conditions with a >4-fold increase in the production of TGF-β1 (896.2 ± 61.3 vs 86.6 ± 11.9 SEM pg/mL, MSC+MN+NB vs NB), MCP-1 (8092.1 ± 319.4 vs 1675.1 ± 113 SEM pg/mL, MSC+MN+NB vs MN) and IL-6 (9593 ± 411.7 vs 1590.3 ± 156.6 SEM pg/mL, MSC+MN+NB vs MSC), and a >2-fold increase in the production of IL-8 (2880.4 ± 167.5 vs 1490.3 ± 103.5 SEM pg/mL, MSC+MN+NB vs MN), and an induction of IL-10 (136.5 ± 15.4 vs 0 SEM pg/mL, MSC+MN+NB vs NB) and IL-4 (57.8 ± 6.8 vs 0 SEM pg/mL, MSC+MN+NB vs NB) (). The highest levels of proteins detected were generally achieved in the media of triple MN+MSC+NB co-cultures. In contrast, the pro-inflammatory type 1 cytokine IL-12 was not detected in all co-culture conditions, and only low levels of TNF-α (47.4 ± 6.3 SEM pg/mL) were detected in NB+MN co-cultures. Similar levels of increase in the production of TGF-β1, IL-6 and IL-8 in co-cultures were observed when BM-MSC or CAF-MSC were used in co-cultures with MN and NB cells (Figure S3B). An analysis of the mRNA from NB cells revealed a >2-fold increase in mRNA for TGF-β1, TNF-α, IL-4, IL-6, IL-8, and MCP-1 with a stronger effect seen in MYCN-A cells (, S3C), demonstrating that MN and MSC increased the expression of TGF-β1 in NB cells and induced the expression of several other pro-tumorigenic cytokines/chemokines including MCP-1, IL-6 and IL-8 not constitutively produced. Thus, our data indicate that MSC, MN and NB influence each other to increase or to induce the production of significant number of pro-tumorigenic cytokines with TGF-β1, MCP-1, IL-6 and IL-8 being among the highest produced cytokines.
Figure 3. CAF and TAM induce the production of cytokines/chemokines in NB cells.
TGF-β1 stimulates the production of IL-6 in NB and MSC
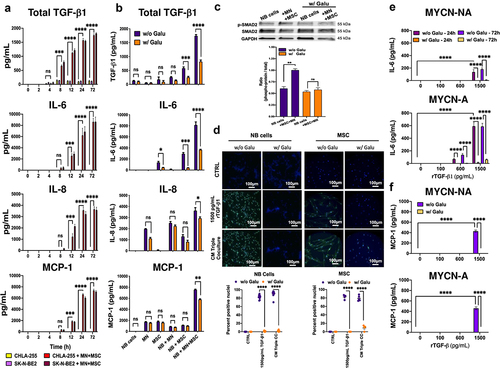
The mechanism by which MSC and MN induced the expression of these cytokines was further explored. A time course analysis of the production of TGF-β1, IL-6, IL-8 and MCP-1 in cultures of NB cells alone or in the presence of MN+MSC () revealed the presence of TGF-β1 as early as 4 h after initiation of the co-culture with a concentration reaching 1,785 ± 29 SEM pg/mL at 72 h. In contrast, IL-6, IL-8 and MCP-1 were detected later at 8 h and reached concentrations of 8,641 ± 491, 3,621 ± 158 and 7,258 ± 142 SEM pg/mL at 72 h, respectively. The data suggested that their production may be the result of TGF-β1 activity, a possibility that was investigated in the presence of the TGF-βR1 inhibitor Galunisertib. The addition of Galunisertib to co-cultures resulted in a statistically significant suppression of IL-6, IL-8 and MCP-1 (55.2%, 10.9% and 30.6% decrease in NB+MN+MSC cultures) (). Galunisertib also inhibited the production of TGF-β1 in dual and triple co-cultures with MSC, suggesting the presence of an autocrine loop whereby TGF-β1 stimulated its own production. A similar observation for IL-6 was made with two other TGF-β1R1/ALK5 small-molecule inhibitors (LY2109761 and SB525334) (Figure S4A). Thus, the data indicate that the production of IL-6 and MCP-1 in co-cultures could be in part TGF-β1-dependent. We next evaluated the contribution of TGF-β1 on the production of these cytokines by NB cells and MSC. To first demonstrate that these cells responded to TGF-β1, we examined the phosphorylation of SMAD2 (p-SMAD2), a downstream signaling response of these cells, in co-culture experiments. We observed an increase in p-SMAD2 in NB cells in the presence of MN+MSC that was suppressed by Galunisertib (). We also documented an increase in nuclear translocation of p-SMAD2 in NB cells and MSC in the presence of conditioned medium (CM) from triple co-cultures or rTGF-β1 that was suppressed by Galunisertib (). We then examined the effect of rTGF-β1 on IL-6, IL-8 and MCP-1 production by NB cells (, S4B). In MYCN-NA and MYCN-A NB cells, IL-6 and MCP-1, but not IL-8, production upon rTGF-β1 treatment was dose-dependent, with levels of 159 ± 36 and 429 ± 22 (MYCN-NA) and 642 ± 61 and 459 ± 27 (MYCN-A) SEM pg/mL for IL-6 and MCP-1, respectively, achieved upon treatment with rTGF-β1 at 1,500 pg/mL, a concentration only observed in triple co-cultures. This effect was entirely suppressed in the presence of Galunisertib. In MSC and CAF-MSC, rTGFβ-1 increased the production of IL-6, but not IL-8 and MCP-1, in a dose-dependent manner above basal expression (1,818 and 1,899 pg/mL) with a 4.2-fold and 3.6-fold increase (7406 ± 604 and 6894 ± 162 SEM pg/mL) at 1500 pg/mL of rTGF-β1 for MSC and CAF-MSC, respectively. The stimulation of IL-6 expression by TGFβ-1 in MSC was partially reversed in the presence of Galunisertib (Figure S4C).
Figure 4. TGF-β1 stimulates the production of IL-6 in NB and MSC.
CAF and TAM inhibit the cytotoxicity of NK cells against NB cells by a TGF-β1-dependent mechanism
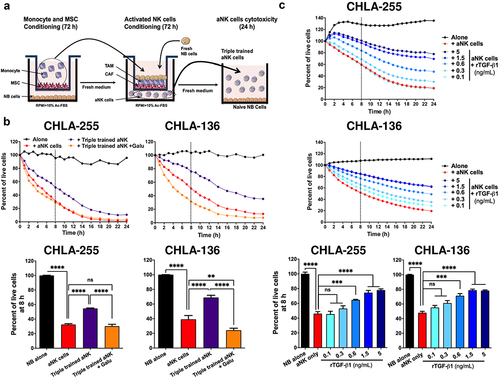
Considering the known immune suppressive function of TGF-β,Citation29 we tested whether MN and MSC could inhibit the cytotoxic activity of NK cells against NB cells (). These experiments revealed that activated NK cells (aNK) exposed to media of NB+MN+MSC (via Transwell) led to significantly lower cytotoxicity against NB cells compared to control aNK cells (54.7% vs 28.5% live CHLA-255 at 8 h, and 68.9% vs 35.2% live CHLA-136 at 8 h) (). The addition of Galunisertib restored the cytotoxic activity of aNK cells pointing to a TGF-β1-dependent mechanism. We had previously shown that the cytotoxic activity of aNK cells against NB is reduced in the presence of 10 ng/mL TGF-β1,Citation30 a concentration not achieved in triple co-cultures. We thus tested whether the direct cytotoxicity of aNK cells against NB cells could be suppressed in the presence of lower (0.1 to 5 ng/mL) TGF-β1 concentrations () found in the MSC+MN+NB conditions. We observed a dose-dependent effect that reached a plateau for inhibiting cytotoxic effect at a concentration of >1.5 ng/mL. Thus, CAF and TAM collaborate to suppress the cytotoxicity of aNK cells via physiologic levels of TGF-β1.
Figure 5. CAF and TAM inhibit the cytotoxicity of NK cells against NB cells by a TGF-β1-dependent mechanism.
TAM and CAF activate a TGF-β1-IL-6 signaling pathway in NB tumors
In vivo evidence for the collaboration between MSC, MN and NB cells in the production of TGF-β1 and IL-6 in the TME was obtained in immunodeficient mice that were orthotopically implanted with NB cells in the presence of MN, MSC or their combination (, S5). The most significant increase in tumor growth was observed in mice implanted with CHLA-255 or CHLA-136 cells in the presence of MN and MSC, consistent with our in vitro data demonstrating their pro-tumorigenic effect (). The analysis of these tumors by immunohistochemistry also demonstrated significant increase in both nuclear p-SMAD2 and p-STAT3, indicating active TGF-β1 and IL-6 presence, in mice implanted with NB cells (CHLA-255 or CHLA-136) and combination of MN and MSC compared to NB cells alone. Although we could not detect the presence of human CD163+ TAM in tumors co-injected with MN or MN+MSC, we did detect human αSMA+ CAF in tumors co-injected with MSC or MN+MSC, an observation that is consistent with these cells being an important source of TGF-β1 and IL-6 activating SMAD2 and STAT3 in NB cells, respectively ().
Figure 6. TAM and CAF activate a TGF-β1-IL-6 signaling pathway in NB tumors.
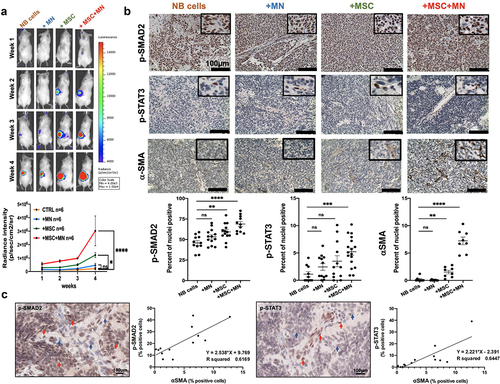
The analysis of the expression of p-SMAD2 and p-STAT3 in human tumors by immunohistochemistry also provided indirect evidence for activity of the TGF-β1/IL-6 pathway by CAF. There was positive correlation between the percentage of cells positive for nuclear p-SMAD2 (r2 = 0.62) and p-STAT3 (r2 = 0.64) and the presence of αSMA+ CAF ().
Discussion
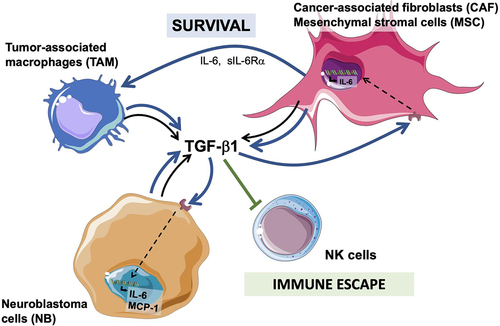
The data presented here provide a novel insight into the contribution of TAM and CAF to the TME in NB. We provide evidence that TAM, CAF and MSC are the main TME cells in primary untreated NB tumors and are often present together. Their presence is correlated inversely with the limited infiltration of T and NK cells seen in these tumors. In vitro, that the interaction between TAM, CAF and NB cells results in significant cytokine/chemokine alteration with significant activation of a TGF-β1/IL-6 pathway in MSC and NB cells that via IL-6 and sIL-6Rα protect MN from apoptosis. The significant TGF-β1 levels produced in the combination of NB, MN, and MSC also inhibit the cytotoxic activity of aNK cells against NB cells (). Last, we provide in vivo evidence of cooperation between TAM and CAF leading to enhanced tumor growth in vivo and evidence of activation of p-SMAD2 and p-STAT3 in NB cells in association with the presence of αSMA+ CAF in murine and human tumor samples.
Figure 7. Diagram summarizing the cooperation between CAF and MSC and TAM and NB cells in the TME and their effect on NK cells.
In most of our experiments, we used human MSC and human MN from healthy donors rather than cells obtained from tumor samples. In the case of MSC, we performed confirmatory experiments with CAF-MSC obtained from NB tumors and maintained in cultures as previously describedCitation19 and demonstrated that CAF-MSC like MSC are a source of cytokines and chemokines. We also provide evidence that in the presence of NB cells – conditions used in our studies – these cells become activated CAF with an increased expression of αFAP and FSP-1. In the case of MN, because of the rarity of fresh NB tumors, the harvesting of TAM would have not been practical. We therefore use MN freshly collected from healthy donors as in previous publicationCitation20 and demonstrate that in the presence of NB cells, MN become polarized into TAM.
The TME landscape analysis performed on NB tumors indicates that untreated NB tumors are immunologically cold and poorly infiltrated by immune cells such as T cells and NK cells but can be infiltrated with TAM, CAF and MSC, an observation made by other laboratories and reviewed recently by us.Citation21,Citation31 We then provide data demonstrating that the presence of CAF is associated with evidence of increased TGF-β1 activity in tumors suggesting that the presence of these cells could provide a mechanism of immune escape. Whether refractory and recurrent tumors have a similar TME landscape remains to be determined. Although our data point to TAM and CAF as a main source of TME-derived TGF-β1, other cells like myeloid-derived suppressor cells (MDSC) – not examined here – could play an additional role. For example, in the TME of NB, monocytic MDSC stimulated by an ATP-rich environment produce TGF-β1.Citation32
Data analyzing TAM and CAF individually in NB tumors suggest a pro-tumorigenic role as their presence is associated with more severe clinical outcome and is inversely correlated with favorable clinical features.Citation18,Citation33,Citation34 Our data demonstrate that together they maintain a pro-tumorigenic function by stimulating the production and secretion of multiple cytokines/chemokines with a pro-tumorigenic function such as TGF-β1, IL-6, IL-8, MCP-1 and IL-10Citation35–38 in the absence of cytokines with an anti-tumorigenic function such as TNF-α and IL-12.Citation39,Citation40 The collaboration between TAM and CAF as they interact with NB cells is highlighted by the observation that the highest levels of these pro-tumorigenic cytokines/chemokines and their biological activity were achieved only in the combination of all three cell types.
Our data also identify a TGF-β-dependent mechanism of induction of IL-6 and MCP-1 expression in NB and of stimulation of IL-6 expression in MSC. A TGF-β-dependent expression of IL-6 has been reported in lung alveolar macrophages upon viral infection,Citation41 in fibrotic lung fibroblasts,Citation42 in mast cells,Citation43 in retinal pigmented cellsCitation44 and in non-small lung cancer with drug-resistant mutations.Citation45 TGF-β has also been reported to induce the production of MCP-1 by normal cells.Citation46,Citation47 However, to our knowledge, this is the first report of a TGF-β1-dependent expression of IL-6 in MSC and IL-6 and MCP-1 in tumor cells. Sphingosine 1 phosphate-dependent expression of MCP-1 has been implicated in the recruitment of TAM in NB tumors.Citation48 TGF-β1 is a key regulator of MSC differentiation, promoting chondrogenesis and osteogenesisCitation49 and MSC and CAF are a source of IL-6,Citation50–52 but their interdependence has not been demonstrated. IL-6 is known to promote MN differentiation into macrophagesCitation53 and here we provide data that it extends their survival, as MN typically do not survive more than a few days in non-cytokine-supported environment.Citation54 The interaction between MN, MSC and NB cells creates a feed-forward loop where the stimulation of TGF-β1 by the interaction of these cells stimulates the production of IL-6 and sIL-6Rα, protecting MN from spontaneous death and further promoting TGF-β production. By showing that the anti-apoptotic effect of MSC on MN is suppressed by blocking IL-6R (Tocilizumab) but not TGFβR1 (Galunisertib) we provide evidence that the constitutive expression of IL-6 by MSC is however sufficient to protect MN from apoptosis. IL-8 is present in NB tumors and its receptor is present in the microvasculature, indicating a contribution to angiogenesis. Its expression in NB cells is induced by IL-1β and TNF-αCitation55 but not by TGFβ-1 as shown by our studies. Like IL-6, serum levels of IL-8 are elevated in patients with high-risk NB tumors.Citation56 The role of MCP-1 in the TME of cancer including NB is however more complex including pro and anti-tumor activities. Tumor-derived MCP-1 elicits T cell chemotaxis,Citation57 and NB-derived MCP-1 is downregulated by MYCN and promotes the migration of iNKT cells thus contributing to tumor infiltration with immune cells.Citation58,Citation59 MCP-1 produced by tumor cells is also a chemoattractant for MN leading toward the accumulation of TAM.Citation60,Citation61
In contrast to other published reports,Citation62,Citation63 we did not find an effect of MSC on macrophage polarization, an effect that was primarily driven by tumor cells. The reason may be related to differences in the source of monocytes as one studyCitation62 utilized THP-1, an acute monocytic leukemia cell line, as model for macrophages, while another study did not compare their polarized monocytes to controlled monocytes polarized to M1, M2a, or M2c using established cytokine stimulations as we have done in this study.
Importantly, our study demonstrates the immune-suppressive activity of TGF-β1 levels produced by the interaction between TAM, CAF, and NB cells on NK cells’ cytotoxicity activity against NB cells furthering our understanding of therapeutic resistance driven by the NB TME in high-risk NB. Although NB tumors are poorly infiltrated with T cells and NK cells, cellular immunotherapies with aNK, NKT and CAR-T cells have recently emerged as viable therapeutic approaches,Citation15 some already tested in Phase I clinical trials,Citation64,Citation65 others being the subject of pre-clinical studies.Citation66–68 The success of these approaches depends on the ability of these cells to penetrate tumors which remains challenging considering that untreated NB tumors are poorly infiltrated with these cells. However, should these cells infiltrate tumors, the presence of CAF and TAM may provide a mechanism of immune resistance and their joint presence in tumors should be examined as a possible prognostic biomarker for immunotherapies. MSC, CAF and TAM assessment by αSMA and CD163 combined with markers of their activity (e.g., p-SMAD2) could be valuable signatures to identify NB tumors prone to resistance to immunotherapy. Their presence may also suggest new therapeutic combinations with cellular immunotherapy targeting the effect of these TME cells such as the addition of TGF-β inhibitors.
Contributions
S.A. and Y.A.D. developed the original hypothesis and designed the experiments. K.L., T.P., M.H.L. and S.M. performed the experiments, analyzed, and interpreted the data. R.K. assisted with the procurement of the human samples. L.B. performed the animal experiments and contributed to the analysis. E.S. generated the data in Figure S2D. G.E.F. assisted in the analysis of the multiplex immunohistochemistry data. F.Y. performed the immunohistochemistry. B.R.P. and H.S. assisted in the selection and analysis of human tumor samples. K.L, S.A. and Y.A.D. coordinated the work, wrote, and edited the manuscript. S.A. and Y.A.D. supervised the entire study.
Data Availability
The data that support the findings of this study are available from the corresponding authors [S.A., Y.A.D.], upon reasonable request.
References
- Hanahan D, Coussens LM. Accessories to the crime: functions of cells recruited to the tumor microenvironment. Cancer Cell. 2012;21:309–13. doi:10.1016/j.ccr.2012.02.022.
- Mortezaee K. Immune escape: a critical hallmark in solid tumors. Life Sci. 2020;258:118110. doi:10.1016/j.lfs.2020.118110.
- Petitprez F, Meylan M, de Reyniès A, Sautès-Fridman C, Fridman WH. The tumor microenvironment in the response to immune checkpoint blockade therapies. Front Immunol. 2020;11:784. doi:10.3389/fimmu.2020.00784.
- Barrett R, Puré E. Cancer-associated fibroblasts: key determinants of tumor immunity and immunotherapy. Curr Opin Immunol. 2020;64:80–87. doi:10.1016/j.coi.2020.03.004.
- Lopez-Yrigoyen M, Cassetta L, Pollard JW. Macrophage targeting in cancer. Ann N Y Acad Sci. 2021;1499:18–41. doi:10.1111/nyas.14377.
- Yang M, McKay D, Pollard JW, Lewis CE. Diverse functions of macrophages in different tumor microenvironments. Cancer Res. 2018;78:5492–5503. doi:10.1158/0008-5472.CAN-18-1367.
- Sahai E, Astsaturov I, Cukierman E, DeNardo DG, Egeblad M, Evans RM, Fearon D, Greten FR, Hingorani SR, Hunter T, et al. A framework for advancing our understanding of cancer-associated fibroblasts. Nat Rev Cancer. 2020;20:174–186. doi:10.1038/s41568-019-0238-1.
- Biffi G, Tuveson DA. Diversity and biology of cancer-associated fibroblasts. Physiol Rev. 2021;101:147–176. doi:10.1152/physrev.00048.2019.
- Cortese N, Carriero R, Laghi L, Mantovani A, Marchesi F. Prognostic significance of tumor-associated macrophages: past, present and future. Semin Immunol. 2020;48:101408. doi:10.1016/j.smim.2020.101408.
- Komohara Y, Takeya M. CAFs and TAMs: maestros of the tumour microenvironment. J Pathol. 2017;241:313–315. doi:10.1002/path.4824.
- Binnewies M, Roberts EW, Kersten K, Chan V, Fearon DF, Merad M, Coussens LM, Gabrilovich DI, Ostrand-Rosenberg S, Hedrick CC, et al. Understanding the tumor immune microenvironment (time) for effective therapy. Nat Med. 2018;24:541–550. doi:10.1038/s41591-018-0014-x.
- Matthay KK, Maris JM, Schleiermacher G, Nakagawara A, Mackall CL, Diller L, Weiss WA. Neuroblastoma. Nat Rev Dis Primers. 2016;2:16078. doi:10.1038/nrdp.2016.78.
- Mody R, Yu AL, Naranjo A, Zhang FF, London WB, Shulkin BL, Parisi MT, Servaes S-E-N, Diccianni MB, Hank JA, et al. Irinotecan, temozolomide, and dinutuximab with GM-CSF in children with refractory or relapsed neuroblastoma: a report from the children’s oncology group. J Clin Oncol. 2020;38:2160–2169. doi:10.1200/JCO.20.00203.
- Yu AL, Gilman AL, Ozkaynak MF, Naranjo A, Diccianni MB, Gan J, Hank JA, Batova A, London WB, Tenney SC, et al. Long-term follow-up of a phase iii study of ch14.18 (dinutuximab) + cytokine immunotherapy in children with high-risk neuroblastoma: COG study ANBL0032. Clin Cancer Res. 2021;27:2179–2189. doi:10.1158/1078-0432.CCR-20-3909.
- Nguyen R, Thiele CJ. Immunotherapy approaches targeting neuroblastoma. Curr Opin Pediatr. 2021;33:19–25. doi:10.1097/MOP.0000000000000982.
- Nakazawa A. Biological categories of neuroblastoma based on the international neuroblastoma pathology classification for treatment stratification. Pathol Int. 2021;71:232–244. doi:10.1111/pin.13085.
- Irwin MS, Naranjo A, Zhang FF, Cohn SL, London WB, Gastier-Foster JM, Ramirez NC, Pfau R, Reshmi S, Wagner E, et al. Revised neuroblastoma risk classification system: a report from the children’s oncology group. J Clin Oncol. 2021;39:3229–3241. doi:10.1200/JCO.21.00278.
- Asgharzadeh S, Salo JA, Ji L, Oberthuer A, Fischer M, Berthold F, Hadjidaniel M, Liu CW-Y, Metelitsa LS, Pique-Regi R, et al. Clinical significance of tumor-associated inflammatory cells in metastatic neuroblastoma. J Clin Oncol. 2012;30:3525–3532. doi:10.1200/JCO.2011.40.9169.
- Borriello L, Nakata R, Sheard MA, Fernandez GE, Sposto R, Malvar J, Blavier L, Shimada H, Asgharzadeh S, Seeger RC, et al. Cancer-associated fibroblasts share characteristics and protumorigenic activity with mesenchymal stromal cells. Cancer Res. 2017;77:5142–5157. doi:10.1158/0008-5472.CAN-16-2586.
- Hadjidaniel MD, Muthugounder S, Hung LT, Sheard MA, Shirinbak S, Chan RY, Nakata R, Borriello L, Malvar J, Kennedy RJ, et al. Tumor-Associated macrophages promote neuroblastoma via STAT3 phosphorylation and up-regulation of c-MYC. Oncotarget. 2017;8:91516–91529. doi:10.18632/oncotarget.21066.
- Hashimoto O, Yoshida M, Koma Y-I, Yanai T, Hasegawa D, Kosaka Y, Nishimura N, Yokozaki H. Collaboration of cancer-associated fibroblasts and tumour-associated macrophages for neuroblastoma development. J Pathol. 2016;240:211–223. doi:10.1002/path.4769.
- Kubala MH, DeClerck YA. Conditional knockdown of gene expression in cancer cell lines to study the recruitment of monocytes/macrophages to the tumor microenvironment. J Vis Exp. 2017. doi:10.3791/56333.
- Wu H-W, Sheard MA, Malvar J, Fernandez GE, DeClerck YA, Blavier L, Shimada H, Theuer CP, Sposto R, Seeger RC. Anti-CD105 antibody eliminates tumor microenvironment cells and enhances anti-GD2 antibody immunotherapy of neuroblastoma with activated natural killer cells. Clin Cancer Res. 2019;25:4761–4774. doi:10.1158/1078-0432.CCR-18-3358.
- Liu Y, Wu H-W, Sheard MA, Sposto R, Somanchi SS, Cooper LJN, Lee DA, Seeger RC. Growth and activation of natural killer cells ex vivo from children with neuroblastoma for adoptive cell therapy. Clin Cancer Res. 2013;19:2132–2143. doi:10.1158/1078-0432.CCR-12-1243.
- Tsujikawa T, Kumar S, Borkar RN, Azimi V, Thibault G, Chang YH, Balter A, Kawashima R, Choe G, Sauer D, et al. Quantitative multiplex immunohistochemistry reveals myeloid-inflamed tumor-immune complexity associated with poor prognosis. Cell Rep. 2017;19:203–217. doi:10.1016/j.celrep.2017.03.037.
- Schindelin J, Arganda-Carreras I, Frise E, Kaynig V, Longair M, Pietzsch T, Preibisch S, Rueden C, Saalfeld S, Schmid B, et al. Fiji: an open-source platform for biological-image analysis. Nat Methods. 2012;9:676–682. doi:10.1038/nmeth.2019.
- Lowe DG. Distinctive image features from scale-invariant keypoints. Int JComp Vis. 2004;60:91–110. doi:10.1023/B:VISI.0000029664.99615.94.
- Hyytiäinen M, Penttinen C, Keski-Oja J. Latent TGF-beta binding proteins: extracellular matrix association and roles in tgf-beta activation. Crit Rev Clin Lab Sci. 2004;41:233–264. doi:10.1080/10408360490460933.
- Batlle E, Massagué J. Transforming growth factor-β signaling in immunity and cancer. Immunity. 2019;50:924–940. doi:10.1016/j.immuni.2019.03.024.
- Tran HC, Wan Z, Sheard MA, Sun J, Jackson JR, Malvar J, Xu Y, Wang L, Sposto R, Kim ES, et al. TGFβR1 blockade with galunisertib (LY2157299) enhances anti-neuroblastoma activity of the anti-gd2 antibody dinutuximab (Ch14.18) with natural killer cells. Clin Cancer Res. 2017;23:804–813. doi:10.1158/1078-0432.CCR-16-1743.
- Blavier L, Yang R-M, DeClerck YA. The tumor microenvironment in neuroblastoma: new players, new mechanisms of interaction and new perspectives. Cancers (Basel). 2020;12:E2912. doi:10.3390/cancers12102912.
- Bianchi G, Vuerich M, Pellegatti P, Marimpietri D, Emionite L, Marigo I, Bronte V, Di Virgilio F, Pistoia V, Raffaghello L. ATP/P2X7 axis modulates myeloid-derived suppressor cell functions in neuroblastoma microenvironment. Cell Death Dis. 2014;5:e1135. doi:10.1038/cddis.2014.109.
- Asgharzadeh S, Pique-Regi R, Sposto R, Wang H, Yang Y, Shimada H, Matthay K, Buckley J, Ortega A, Seeger RC. Prognostic significance of gene expression profiles of metastatic neuroblastomas lacking MYCN gene amplification. J Natl Cancer Inst. 2006;98:1193–1203. doi:10.1093/jnci/djj330.
- Zeine R, Salwen HR, Peddinti R, Tian Y, Guerrero L, Yang Q, Chlenski A, Cohn SL. Presence of cancer-associated fibroblasts inversely correlates with schwannian stroma in neuroblastoma tumors. Mod Pathol. 2009;22:950–958. doi:10.1038/modpathol.2009.52.
- Zhen Z, Guo X, Liao R, Yang K, Ye L, You Z. Involvement of IL-10 and TGF-β in HLA-E-mediated neuroblastoma migration and invasion. Oncotarget. 2016;7:44340–44349. doi:10.18632/oncotarget.10041.
- Xu Y, Sun J, Sheard MA, Tran HC, Wan Z, Liu WY, Asgharzadeh S, Sposto R, Wu HW, Seeger RC. Lenalidomide overcomes suppression of human natural killer cell anti-tumor functions by neuroblastoma microenvironment-associated IL-6 and TGFβ1. Cancer Immunol Immunother. 2013;62:1637–1648. doi:10.1007/s00262-013-1466-y.
- Péquignot Y, Clarke PG. Changes in Lamination and neuronal survival in the isthmo-optic nucleus following the intraocular injection of tetrodotoxin in chick embryos. J Comp Neurol. 1992;321:336–350. doi:10.1002/cne.903210303.
- Yang F, Jove V, Buettner R, Xin H, Wu J, Wang Y, Nam S, Xu Y, Ara T, DeClerck YA, et al. Sorafenib inhibits endogenous and IL-6/S1P induced JAK2-STAT3 signaling in human neuroblastoma, associated with growth suppression and apoptosis. Cancer Biol Ther. 2012;13:534–541. doi:10.4161/cbt.19603.
- Alvarez S, Blanco A, Fresno M, Muñoz-Fernández MÁ. TNF-α contributes to caspase-3 independent apoptosis in neuroblastoma cells: role of NFAT. PLoS One. 2011;6:e16100. doi:10.1371/journal.pone.0016100.
- Barker SE, Grosse SM, Siapati EK, Kritz A, Kinnon C, Thrasher AJ, Hart SL. Immunotherapy for neuroblastoma using syngeneic fibroblasts transfected with IL-2 and IL-12. Br J Cancer. 2007;97:210–217. doi:10.1038/sj.bjc.6603857.
- Woods PS, Tazi MF, Chesarino NM, Amer AO, Davis IC. TGF-β-induced IL-6 prevents development of acute lung injury in influenza a virus-infected F508del CFTR-heterozygous mice. Am J Physiol Lung Cell Mol Physiol. 2015;308:L1136–1144. doi:10.1152/ajplung.00078.2015.
- Pelaia G, Gallelli L, D’Agostino B, Vatrella A, Cuda G, Fratto D, Renda T, Galderisi U, Piegari E, Crimi N, et al. Effects of TGF-beta and glucocorticoids on map kinase phosphorylation, IL-6/IL-11 secretion and cell proliferation in primary cultures of human lung fibroblasts. J Cell Physiol. 2007;210:489–497. doi:10.1002/jcp.20884.
- Ganeshan K, Bryce PJ. Regulatory T cells enhance mast cell production of IL-6 via surface-bound TGF-β. J Immunol. 2012;188:594–603. doi:10.4049/jimmunol.1102389.
- Kuppner MC, McKillop-Smith S, Forrester JV. TGF-beta and IL-1 beta act in synergy to enhance IL-6 and IL-8 MRNA levels and IL-6 production by human retinal pigment epithelial cells. Immunology. 1995;84:265–271.
- Yao Z, Fenoglio S, Gao DC, Camiolo M, Stiles B, Lindsted T, Schlederer M, Johns C, Altorki N, Mittal V, et al. TGF-beta IL-6 axis mediates selective and adaptive mechanisms of resistance to molecular targeted therapy in lung cancer. Proc Natl Acad Sci U S A. 2010;107:15535–15540. doi:10.1073/pnas.1009472107.
- Cheng J, Diaz Encarnacion MM, Warner GM, Gray CE, Nath KA, Grande JP. TGF-beta1 stimulates monocyte chemoattractant protein-1 expression in mesangial cells through a phosphodiesterase isoenzyme 4-dependent process. Am J Physiol Cell Physiol. 2005;289:C959–970. doi:10.1152/ajpcell.00153.2005.
- Qi W, Chen X, Polhill TS, Sumual S, Twigg S, Gilbert RE, Pollock CA. TGF-beta1 induces IL-8 and MCP-1 through a connective tissue growth factor-independent pathway. Am J Physiol Renal Physiol. 2006;290:F703–709. doi:10.1152/ajprenal.00254.2005.
- Li M-H, Harel M, Hla T, Ferrer F. Induction of chemokine (c-c motif) ligand 2 by sphingosine-1-phosphate signaling in neuroblastoma. J Pediatr Surg. 2014;49:1286–1291. doi:10.1016/j.jpedsurg.2014.04.001.
- Chen MJ, Whiteley JP, Please CP, Schwab A, Ehlicke F, Waters SL, Byrne HM. Inducing chondrogenesis in msc/chondrocyte co-cultures using exogenous tgf-β: a mathematical model. J Theor Biol. 2018;439:1–13. doi:10.1016/j.jtbi.2017.11.024.
- Jobe NP, Rösel D, Dvořánková B, Kodet O, Lacina L, Mateu R, Smetana K, Brábek J. Simultaneous blocking of IL-6 and IL-8 is sufficient to fully inhibit CAF-induced human melanoma cell invasiveness. Histochem Cell Biol. 2016;146:205–217. doi:10.1007/s00418-016-1433-8.
- Sohara Y, Shimada H, Minkin C, Erdreich-Epstein A, Nolta JA, DeClerck YA. Bone marrow mesenchymal stem cells provide an alternate pathway of osteoclast activation and bone destruction by cancer cells. Cancer Res. 2005;65:1129–1135. doi:10.1158/0008-5472.CAN-04-2853.
- Louault K, Bonneaud TL, Séveno C, Gomez-Bougie P, Nguyen F, Gautier F, Bourgeois N, Loussouarn D, Kerdraon O, Barillé-Nion S, et al. Interactions between cancer-associated fibroblasts and tumor cells promote mcl-1 dependency in estrogen receptor-positive breast cancers. Oncogene. 2019;38:3261–3273. doi:10.1038/s41388-018-0635-z.
- Chomarat P, Banchereau J, Davoust J, Palucka AK. IL-6 switches the differentiation of monocytes from dendritic cells to macrophages. Nat Immunol. 2000;1:510–514. doi:10.1038/82763.
- Hunter M, Wang Y, Eubank T, Baran C, Nana-Sinkam P, Marsh C. Survival of monocytes and macrophages and their role in health and disease. Front Biosci (Landmark Ed). 2009;14:4079–4102. doi:10.2741/3514.
- Ferrer FA, Pantschenko AG, Miller LJ, Anderson K, Grunnet M, McKenna PH, Kreutzer D. Angiogenesis and neuroblastomas: interleukin-8 and interleukin-8 receptor expression in human neuroblastoma. J Urol. 2000;164:1016–1020. doi:10.1097/00005392-200009020-00024.
- Moreno-Guerrero SS, Ramírez-Pacheco A, Rocha-Ramírez LM, Hernández-Pliego G, Eguía-Aguilar P, Escobar-Sánchez MA, Reyes-López A, Juárez-Villegas LE, Sienra-Monge JJL. Association of genetic polymorphisms and serum levels of il-6 and il-8 with the prognosis in children with neuroblastoma. Cancers (Basel). 2021;13(529). doi:10.3390/cancers13030529.
- Brown CE, Vishwanath RP, Aguilar B, Starr R, Najbauer J, Aboody KS, Jensen MC. Tumor-derived chemokine MCP-1/CCL2 is sufficient for mediating tumor tropism of adoptively transferred t cells. J Immunol. 2007;179:3332–3341. doi:10.4049/jimmunol.179.5.3332.
- Song L, Ara T, Wu H-W, Woo C-W, Reynolds CP, Seeger RC, DeClerck YA, Thiele CJ, Sposto R, Metelitsa LS. Oncogene MYCN regulates localization of NKT cells to the site of disease in neuroblastoma. J Clin Invest. 2007;117:2702–2712. doi:10.1172/JCI30751.
- Metelitsa LS, Wu H-W, Wang H, Yang Y, Warsi Z, Asgharzadeh S, Groshen S, Wilson SB, Seeger RC. Natural killer T cells infiltrate neuroblastomas expressing the chemokine CCL2. J Exp Med. 2004;199:1213–1221. doi:10.1084/jem.20031462.
- Dreanca A, Sarosi C, Parvu AE, Blidaru M, Enacrachi G, Purdoiu R, Nagy A, Sevastre B, Oros NA, Marcus I, et al. Systemic and local biocompatibility assessment of graphene composite dental materials in experimental mandibular bone defect. Materials (Basel). 2020;13:E2511. doi:10.3390/ma13112511.
- Negus RP, Stamp GW, Relf MG, Burke F, Malik ST, Bernasconi S, Allavena P, Sozzani S, Mantovani A, Balkwill FR. The detection and localization of monocyte chemoattractant protein-1 (MCP-1) in human ovarian cancer. J Clin Invest. 1995;95:2391–2396. doi:10.1172/JCI117933.
- Chen S, Morine Y, Tokuda K, Yamada S, Saito Y, Nishi M, Ikemoto T, Shimada M. Cancer‑associated fibroblast‑induced M2‑polarized macrophages promote hepatocellular carcinoma progression via the plasminogen activator inhibitor‑1 pathway. Int J Oncol. 2021;59:59. doi:10.3892/ijo.2021.5239.
- Takahashi H, Sakakura K, Kudo T, Toyoda M, Kaira K, Oyama T, Chikamatsu K. Cancer-associated fibroblasts promote an immunosuppressive microenvironment through the induction and accumulation of protumoral macrophages. Oncotarget. 2017;8:8633–8647. doi:10.18632/oncotarget.14374.
- Heczey A, Courtney AN, Montalbano A, Robinson S, Liu K, Li M, Ghatwai N, Dakhova O, Liu B, Raveh-Sadka T, et al. Anti-GD2 CAR-NKT cells in patients with relapsed or refractory neuroblastoma: an interim analysis. Nat Med. 2020;26:1686–1690. doi:10.1038/s41591-020-1074-2.
- Straathof K, Flutter B, Wallace R, Jain N, Loka T, Depani S, Wright G, Thomas S, Cheung GW-K, Gileadi T, et al. Antitumor activity without on-target off-tumor toxicity of gd2-chimeric antigen receptor t cells in patients with neuroblastoma. Sci Transl Med. 2020;12:eabd6169. doi:10.1126/scitranslmed.abd6169.
- Heitzeneder S, Bosse KR, Zhu Z, Zhelev D, Majzner RG, Radosevich MT, Dhingra S, Sotillo E, Buongervino S, Pascual-Pasto G, et al. GPC2-CAR T cells tuned for low antigen density mediate potent activity against neuroblastoma without toxicity. Cancer Cell. 2022;40:53–69.e9. doi:10.1016/j.ccell.2021.12.005.
- Zobel MJ, Zamora AK, Wu H-W, Sun J, Lascano D, Malvar J, Wang L, Sheard MA, Seeger RC, Kim ES. Initiation of immunotherapy with activated natural killer cells and anti-gd2 antibody dinutuximab prior to resection of primary neuroblastoma prolongs survival in mice. J Immunother Cancer. 2020;8:e001560. doi:10.1136/jitc-2020-001560.
- Moghimi B, Muthugounder S, Jambon S, Tibbetts R, Hung L, Bassiri H, Hogarty MD, Barrett DM, Shimada H, Asgharzadeh S. Preclinical assessment of the efficacy and specificity of gd2-b7h3 synnotch car-t in metastatic neuroblastoma. Nat Commun. 2021;12:511. doi:10.1038/s41467-020-20785-x.
Supplemental Material
Download Zip (5.6 MB)Acknowledgments
The authors thank Jacqueline Rosenberg for her assistance in typing the manuscript and Martine Torres, PhD, for her editorial help. The authors also thank members of the SC2 and flow cytometry core facilities of The Saban Research Institute for their excellent assistance. This work was supported by the National Cancer Institute under Grant P01 CA217959-01 (PI J. Maris) to Y.A.D. and S.A.
Disclosure statement
The authors report no potential financial conflict of interest.
Supplementary material
Supplemental data for this article can be accessed online at https://doi.org/10.1080/2162402X.2022.2146860