
ABSTRACT
T-cell-based immune checkpoint blockade therapy (ICB) can be undermined by local immunosuppressive M2-like tumor-associated macrophages (TAMs). However, modulating macrophages has proved difficult as the molecular and functional features of M2-TAMs on tumor growth are still uncertain. Here we reported that immunosuppressive M2 macrophages render cancer cells resistant to CD8+ T-cell-dependent tumor-killing refractory ICB efficacy by secreting exosomes. Proteomics and functional studies revealed that M2 macrophage-derived exosome (M2-exo) transmitted apolipoprotein E (ApoE) to cancer cells conferring ICB resistance by downregulated MHC-I expression curbing tumor intrinsic immunogenicity. Mechanistically, M2 exosomal ApoE diminished the tumor-intrinsic ATPase activity of binding immunoglobulin protein (BiP) to decrease tumor MHC-I expression. Sensitizing ICB efficacy can be achieved by the administration of ApoE ligand, EZ-482, enhancing ATPase activity of BiP to boost tumor-intrinsic immunogenicity. Therefore, ApoE may serve as a predictor and a potential therapeutic target for ICB resistance in M2-TAMs-enriched cancer patients. Collectively, our findings signify that the exosome-mediated transfer of functional ApoE from M2 macrophages to the tumor cells confers ICB resistance. Our findings also provide a preclinical rationale for treating M2-enriched tumors with ApoE ligand, EZ-482, to restore sensitivity to ICB immunotherapy.
Introduction
Cancer immunotherapy has become highly successful against cancers by triggering the cytotoxic potential of the human immune system.Citation1–3 Among cancer immunotherapy, immune checkpoint blocking (ICB) antibodies against cytotoxic-T-lymphocyte-associated protein 4 (CTLA4) or programmed cell death protein 1 (PD-1)/programmed death-ligand 1 (PD-L1) axis have displayed durable clinical responses in multiple types of cancers.Citation2–4 Although ICB immunotherapies have had a notable effect on cancer treatment, various mechanisms of immune resistance exist in tumors.Citation5 Various types of innate and adaptive immune cells reside or recruit to the tumor microenvironment. The dynamic cross-talk between these immune cells and tumor cells defines the immune status of the tumor, promoting or hindering the tumor response to ICB.Citation6 Along with tumors evolving, the tumor microenvironment (TME) gradually becomes more immunosuppressive with several components of the immunosuppressive immune system contributing to tumor immune evasion and inevitably to resistance to ICB treatment.
Tumor-associated macrophages (TAMs) constitute a major component of TME and play pivotal roles in the regulation of tumor immune response. Studies on the complex plasticity of macrophages suggest the presence of a spectrum of phenotypes with M1 and M2 being the two ends of the spectrum. While M1 macrophages classically express pro-inflammatory cytokines and promote an anti-tumor immune response, M2 macrophages are characterized by the expression of anti-inflammatory cytokines and chemokines and suppress cytolytic CD8+ T-cell antitumor response and contribute to tumor immune evasion.Citation7,Citation8 We previously showed that TAMs exhibit pro-tumorigenic M2-like polarization and provide a protumor microenvironment to promote tumor progression, metastasis, and immune evasion.Citation9,Citation10 Currently, growing evidence suggests that high infiltration of immunosuppressive M2-like TAMs correlates with poor prognosis and ICB resistance,Citation11–14 which makes them an important target to overcome ICB resistance for cancer treatment.Citation15,Citation16 However, modulating macrophages has proved extremely difficult, as we still lack a complete understanding of the molecular and functional diversity of the tumor macrophage compartment.
It is well established that M2-like macrophages promote tumor immunosuppression through the suppression of T-cell function. Beyond this, in this study, we revealed that immunosuppressive M2-like macrophages modulate tumor cells to suppress T-cell-mediated tumor killing resulting in ICB resistance via exosomes secretion, a type of secreted vesicles and its diameter is about 30-150 nm.Citation17,Citation18 We previously reported that M2-polarized TAM-derived exosomes promote the progression and chemotherapy resistance of advanced tumors.Citation19,Citation20 Here, by proteomics analysis, we further identified that M2-like macrophage-derived exosomes (M2-exo) diminished tumor immunogenicity by directly degrading the major histocompatibility complex class I (MHC-I) expression on tumor cells, which impairs antigen presentation that is one of the common mechanisms of immune evasionCitation21,Citation22 and mutations or loss of heterozygosity of MHC-I has been implicated in resistance to ICB therapy.Citation21,Citation23–25 Furthermore, we identified the molecular mechanisms of how M2-exosomal ApoE modulates tumoral MHC-I expression to dampen tumor intrinsic immunogenicity. Finally, we validated the effect of targeting ApoE to rescue the ICB resistance induced by M2-exo in vivo. These observations suggest a need for a precision medicine approach in which the design of the immunotherapeutic combination is modified on the basis of the tumor immune landscape to overcome ICB resistance, highlighting a strong rationale to consider targeting macrophage exosome to rescue the ICB resistance in M2-TAMs enriched tumor microenvironment.
Materials and methods
Cell lines and mouse strains
MFC, MC38, THP-1, MGC-803 (MGC), and BGC-823 (BGC) were obtained from the Cell Bank of the Chinese Academy of Sciences, and tests free for mycoplasma. Cells were maintained in DMEM/F12 with 10% fetal bovine serum (Gibco) and penicillin plus streptomycin (Gibco). The plasmid of ApoE overexpression (ApoE-OE, PGMLV-4931-Apoe) and respective control vectors (PGMLV-4931) were provided by Shanghai Genomeditech Company and were transfected using Lipofectamine 3000 Transfection Reagent according to the manual (ThermoFisher). Female 8-week-old wild-type and Apoe−/− mice with a C57BL/6 background were purchased from Vital River Laboratory Animal Technology Company (Beijing, China). All animal experiments were carried out according to the Principles of Laboratory Animal Care and approved by the Ethics Committee of Xinhua Hospital, Shanghai Jiao Tong University.
Macrophage polarization
Murine bone marrow-derived macrophages (BMDMs) were prepared and plated in bone macrophage medium (BMM) consisting of 50 ng/ml M-CSF. After 7 d in culture, cells were induced toward a polarized phenotype with the addition of 20 ng/ml IL-4 plus 20 ng/ml IL-13 for M2 polarization or 100 ng/ml LPS plus 20 ng/ml IFN-γ for M1 polarization. Human THP-1 cells were treated with 100 ng/ml PMA to generate M0. After 24 h cells were induced M2 polarization with 20 ng/ml IL-4 plus 20 ng/ml IL-13. Polarized macrophages were cultured in FBS-free DMEM/F12 and 1% penicillin plus streptomycin for 2 d. The supernatant was purified and collected to prepare M0, M1, or M2 macrophage-derived exosomes (M0-exo, M1-exo, and M2-exo, respectively). Apoe−/− M2-exo were prepared from Apoe−/− mice. MC38 cells were grown in the DMEM-complete medium. After 1 d, the medium was recovered and filtered to prepare the tumor-conditioned medium (TCM). TAMs have induced M0 macrophages to macrophages treated with TCM (TCM-M) with 2 d of coculturing with TCM.
Exosomes preparation and uptake analysis
Exosomes were collected by density gradient (1.15–1.19 g/mL) ultracentrifugation according to previously published protocol.Citation15 After ultracentrifugation preparations, exosomes were labeled with PKH67 Fluorescent Cell Linker Kits (Sigma-Aldrich) according to the manufacturer’s instructions, followed by washing through Exosome Spin Columns (MW3000) (Invitrogen) to remove excess dye. Next, 5 μg exosomes were incubated with 1 × 10Citation5 MFC or other cancer cells for 24 h which were examined under a confocal microscope at the indicated time points.
Exosomes identification
For transmission electron microscope,Citation26 10 μL of exosome suspension was adsorbed onto carbon-coated copper grids, washed with double-distilled water, and negatively stained with 2% uranyl acetate solution. Grids were visualized in FEI TecnaiG2 TEM. The nanoparticle tracking analysisCitation27 instrument is the ZetaView Analyzer to obtain the particle size and concentration of exosomes.
Western blot and co-immunoprecipitation
Western blot (WB) was performed as previously described.Citation7 The Co-Immunoprecipitation (Co-IP) kit (Abcam, UK) was applied to analyze the combined protein of ApoE and the ATPase activity of BIP. According to the manual, the beads with the antigen–antibody (Ag-Ab) complex were collected and used directly for an activity assay or WB analyses. All antibodies used for western blot and Co-IP are listed in Supplementary Table S6.
Nano-LC-MS/MS analysis
Fifty micrograms of proteins from exosomes or Co-IP proteins from ApoE-overexpressed MC38 cells were submitted for proteomic analysis using Nano-LC-MS/MS. For proteomic analysis, MC38 cells were treated with M0-exo or M2-exo for 48 h and then harvested for proteomics analysis. Experiments were performed on a Q-Exactive HF mass spectrometer that was coupled to Easy nLC1200 (ThermoFisher) in Shanghai Oebiotech Company. Data were searched using ProteomeDiscover (v.2.4) against the UniProt mouse sequence database. The protein identification criteria that we used were based on a score ≥20. Protein identification results were extracted from the mascot data file with in-house software (Build Summary).
Single-cell RNA sequencing dataset analysis
To analyze ApoE expression in tumor-associated macrophages, we use the datasets from Tumor Immune Single-Cell Hub (http://tisch.comp-genomics.org/), a large-scale curated database that integrates single-cell transcriptomic profiles of nearly 2 million cells from 76 high-quality tumor datasets across 27 cancer types.
CD8+ T-cell killing assay
Anti-CD3/CD28+ IL-2 activated CD8+ T cells from mice spleen cells co-cultivate with cancer cells according to a certain proportion for a certain period of time. Following the instructions of the Apoptosis Detection Kit Caspase-3/7 Green Detection Reagent (Invitrogen), the total cell number and the green fluorescent staining apoptotic cell number were counted under a fluorescent microscope for calculating the percentage of survival cells.
Flow cytometry staining and analysis
Single cells were generated from cell lines with trypsin or from mouse tumors with collagenase Type IV (1 mg/mL; Worthington, USA), DNase I (0.02 mg/mL; Sigma-Aldrich, USA), hyaluronidase (0.1 mg/mL; BBI Life Sciences, USA) at 37°C for 30 min. Appropriate dilutions of various combinations of fluorescently labeled antibodies were used and are listed in Supplementary Table S7. Labeled cells were analyzed on a BD Canto II (BD Bioscience), and the data were processed using FlowJo v10.8 (BD Bioscience).
Immunofluorescence assay
MC38 was cocultured with M2-derived macrophages exosomes (M2-exo), ApoE or BIP was visualized by staining with respective first antibody and the second antibody conjugated Alexa Flour 488 or 555 (Abcam) according to the manual. Images were captured using Leica SP5 laser scanning confocal microscope.
Tumor challenge and treatment experiments
Female 8-week-old wild-type or Apoe−/− C57BL/6 mice were subcutaneously injected with 5 × 10⁵ MC38 cells. The mice were injected intraperitoneally with 100 μg of anti-PD-1 (BioXcells, RMP1–14) or rat IgG2a isotype control (BioXcells, 2A3) four times after 7, 10, 13, and 16 d of tumor incubation. Exosomes intratumor injection was initiated on post – tumor implant d 7 (tumor volume was about 200 mm3) and ended on d 19 per 60 µg once every 3 d. EZ-482 (MCE) was administered by oral gavage every day at a concentration of 15 mg/kg. All mice were killed on d 24, and the tumors were excised for subsequent analysis.
Immunohistochemical staining
Mouse fresh tumor Immunohistochemical staining was performed using a standard protocol.Citation15 Automated image acquisition was performed using an Aperio ScanScope XT Slide Scanner system with a × 20objective (Aperio Technologies).
RNA extraction and quantitative real-time PCR
RT-PCR analyses were performed as previously described.Citation15 Primer sequences of mentioned genes are described in Supplementary Table S8.
ATPase assay
ATPase Assay Colorimetric kits were used for experiments (ab234055, Abcam). Briefly, reaction samples were prepared for each 10 min time point between 0 and 60 min. BiP (ab78432, Abcam) at 10 μM concentration was used in all experiments, to which 10 μM of ApoE (ab55210, Abcam) or 50 μM EZ-482 was added for 4°C overnight incubation. Then add ATPase Assay Developer to all samples and measure OD at 650 nm in endpoint mode according to the manufacturer’s protocol.
Statistical analyses
All statistical analyses were run using GraphPad Prism 9.0 software and displayed as the mean and SD. The statistical significance of the difference was assessed using the Student's t-test, and the one-way ANOVA with Tukey post-test was conducted for multiple comparisons. For the survival analysis, Kaplan–Meier survival curves were calculated, and significance was determined by a log-rank test. A significant difference was considered when the p-value was less than 0.05. The p-value was represented by *p < 0.05, **p < 0.01, ***p < 0.001, and ****p < 0.0001.
Results
M2-like macrophage-derived exosomes impaired T-cell-mediated tumor killing to attenuate ICB efficacy
Despite the immunosuppression of M2 macrophages on T cells is well identified, the impact of M2 macrophages on the immunogenicity of tumor cells has not been explored, which is capable of eliciting potent antitumor T-cell responses.Citation28–31 To this end, we set up the strategized in vitro co-culture platform of T-cell-mediated tumor cell killing assay to evaluate the effect of M2 macrophages on tumor cell’ immunogenicity. The isolated CD8+ T cells from the mouse spleen were activated in vitro, as indicated by the high CD69 expression (Figure S1A). Then, we cocultured MFC cells, murine gastric cancer cells, with CD8+ T cells at various ratios and certified the apoptosis of MFC caused by activated CD8+ T cells (Figure S1B-D). The generation of M2-macrophages was derived from the bone marrow of homologous mice or THP-1 cells and phenotypic characterization is well defined, as indicated by the typical markers (F4/80, CD163, CD206) and gene signatures (Arg1, Il10, Tgfb) of M2-like macrophage (Figure S2A-C). Interestingly, we found that MFC cells pretreated with M2-supernatant (M2-sup) were dramatically resistant to activated CD8+ T-cell-mediated killing (Figure S2D-F). Emerging evidence from our previous study and other groupsCitation28–31 suggests that M2 macrophages secret an abundance of the exosome, which have a central role in cell–cell communication in the TME. Next, we sought to test whether exosomes in M2-sup mediated the resistance of T-cell-mediated tumor killing. The typical morphology, correct size distribution (30–150 nm), and classical exosomal biomarkers of M2 macrophage-derived exosomes (M2-exo) were validated by TEM (), NTA (), and WB (Figure S3A) respectively. Using fluorescence microscopy, we also confirmed that live MFC cells can uptake the PKH67-labeled M2-exo (, Figure S3B). Indeed, MFC cells pretreated with M2-exo were dramatically resistant to T-cell-mediated killing (Figure S3C-E). Consistently, MC38 cells educated with M2-exo also resist T-cell-mediated killing (). Considering the diversity of macrophages in TME, we established the tumor condition medium-treated macrophages (TCM-M) to mimic the TAMs in vitro. TCM-M mainly displayed the characteristic of CD206+ M2-like polarized macrophage (Figure S3F). Notably, we found that TCM-M-derived exosomes (TCM-Mexo) educated MC38 cells to resist T-cell-mediated killing (Figure S3G-J). These data indicate that M2-exo instigates tumor cell refractory T-cell-mediated killing.
Figure 1. M2-like macrophage-derived exosomes inhibit T-cell-mediated tumor cell killing and dampen immunotherapy response. (A) Identification of exosomes derived from M2-like macrophages (M2-Exo) by TEM. The scale bar represented 500 nm. (B) Analyzation of M2-Exo diameter by NTA. (C) PKH67(green fluorescence) labeled M2-Exo was taken up by MFC. (D) Caspase 3/7 and percent of survival cells were detected in M2exo pretreated MC38 or the control group that co-cultured with CTL. n = 3 per group. (E) Flow cytometry scatters diagram of PI and Annexin-V showed apoptosis and percent of survival cells of M2-exo pretreated MC38 or control group that co-cultured with CTL. n = 3 per group. (F) Schema of anti-PD1 treatment and M2-Exo interference to MC38 subcutaneous injection models. (G–I) Tumor mean volume curves (G), representative tumors image (H), and individual tumor growth curves (I) of MC38 tumors that separated subcutaneously from mice or which were treated with M2-exo, anti-PD-1 antibody, anti-PD1+M2-Exo as indicated. (J) Representative flow cytometry scatters diagram of CD4+ and CD8+ T cells and the ratio of CD8+ T cells in MC38 tumor tissues of the four indicated groups. Error bars, S.D. Two-sided Student’s t-test (D, E). Two-way ANOVA with Tukey’s multiple comparison posttest (G, J). *p < 0.05, **p < 0.01, ***p < 0.001, ****p < 0.0001.
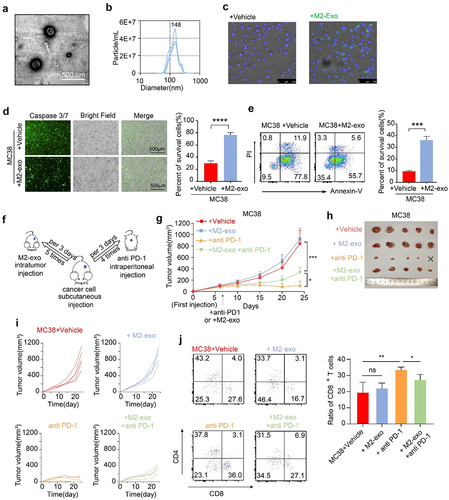
To explore the effect of M2-exo on ICB response in vivo, we used the immunogenic MC38 mouse model (), which was responsive to ICB treatment. Notably, compared with the control group, anti-PD-1 treatment significantly reduced MC38 tumor growth (). However, the addition of M2-exo abolished the effect of anti-PD-1 treatment, as indicated by the increased tumor growth in the mice bearing the MC38 tumors (). Similarly, M2-exo also abolished the efficacy of anti-PD-1 treatment in the MFC tumor model (Figure S4A-B). M2-exo alone treatment did not alter MC38 tumor growth, compared to the control group (Figure S4C-E). Moreover, the result showed that the TCM-Mexo administration also abolished the ICB response in the MC38 model (Figure S4F-I), consistent with M2-exo. In addition, tumor-infiltrating CD8+ T cells were significantly decreased in the mice treated with ICB in combination with M2-exo () or TCM-Mexo (Figure S4J-K) compared to ICB alone. Collectively, our data highlight that M2-exo exhibits a strong immunosuppressive effect by instigating tumor cells to resist ICB treatment.
Exosomal apolipoprotein E mediated the M2-exo-induced ICB resistance
Previously, we identified the protein components of M2-exo using mass spectrometryCitation20 and found that ApoE was a highly specific and enriched protein (Figure S5A, Table S1). The immunoblot results confirmed that M2-exo and TCM-Mexo contain abundant ApoE (, Figure S5B). Data mining the single-cell RNAseq dataset, we validated that ApoE was typically predominantly expressed in myeloid immune cells, especially macrophages, in the TME (Figure S5C). Further analysis showed that ApoE expression levels are negatively correlated with overall survival (Figure S5D) and cytolytic CD8+ T cell activity (Figure S5E) in patients with colorectal cancer.
Figure 2. Exosomal apolipoprotein E mediated the M2-exo-induced ICB resistance. (A) Immune blotting validated the ApoE expression in exosomes derived from M0/M2 macrophages.(B) Intracellular green fluorescence of ApoE in MFC cells after co-culture with M0-exo or M2-exo. (C, D) Caspase 3/7 staining (C) and percent of survival cells (D) were detected in WT or Apoe−/− M2-exo pretreated MC38 cells or a control group that co-cultured with activated CTL. n = 3 per group. (E, F) Flow cytometry scatter diagram of PI and Annexin-V showed apoptosis (E) and percent of survival cells (F) of WT or Apoe−/− M2-exo pretreated MC38 cells or the control group that co-cultured with activated CTL. n = 3 per group.(G-I) Individual tumor growth curves (G), mean volume curves (H), and representative tumor images (I) of MC38 tumors that separated subcutaneously from mice or which were treated with anti-PD-1 antibody, anti-PD1+WT M2-exo in WT mice, or anti-PD-1+ Apoe−/− M2-exo in Apoe −/− mice. (J) Quantification of CD8/CD4 Ratio in MC38 tumors treated as indicated above. n = 5 per group. (K, L) Representative immunohistology images (K) and quantification (L) of the CD8+ T cells and ApoE+ tumor cells in the tumor slice of indicated four groups above. n = 5 per group. Error bars, SD. One-way ANOVA with Tukey’s multiple comparison posttest (D, F, I).
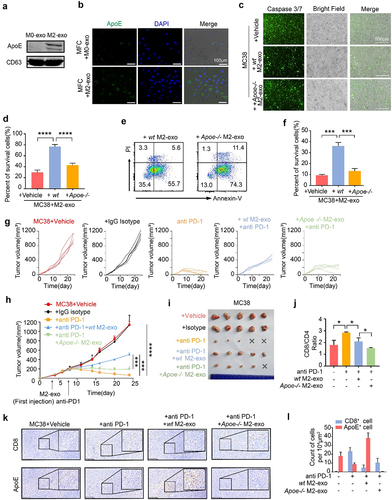
To investigate whether ApoE mediates the function of M2-exo on tumor cell immunogenicity, we performed the T-cell-mediated killing assay with M2-exo generated from BMDMs of wild-type or Apoe−/− mice. We confirmed that exosomal ApoE can be transferred from M2 macrophages to MFC cells (). Compared to M2-exo from BMDMs of wildtype mice (WT M2-exo), M2-exo from BMDMs of Apoe−/− mice (Apoe−/− M2-exo) induced a significant reduction in tumor cell survival after cocultured with activated T cells, as indicated with the increased apoptosis by immunofluorescent staining and flow cytometry analysis (). To validate the direct function of ApoE on tumor immunogenicity, we generated the ApoE-overexpressed MFC cells and MC38 cells, in which the endogenous ApoE expression was undetectable in both cell lines (Figure S5F-G). The result showed that the enhanced ApoE expression in tumor cells restrained T-cell-mediated killing (Figure S5H), consistent with the finding that M2-exosomal ApoE restricts tumor immunogenicity. In the preclinical model, we found that the administration of Apoe−/− M2-exo in combination with anti-PD-1 induced a significant tumor reduction in the mice bearing MC38 tumors, compared to WT M2-exo (), indicating that M2-exo mediates ICB resistance through exosomal ApoE. Analysis of TME showed an increased tumor-infiltrating CD8+ T cells and decreased ApoE+ tumor cells in MC38-bearing mice with the treatment of Apoe−/− M2-exo + ICB (). As expected, we found that M2-exo and TCM-Mexo directly suppressed the proliferation and IFN-γ secretion of CD8+ T cells (Figure S5I-J). However, it seems that this direct inhibition of M2-exo on CD8+ T cell is independent of exosomal ApoE as Apoe-/- M2-exo exhibited a similar effect as WT M2-exo (Figure S5I-J). Taken together, these data demonstrate that M2-exosomal ApoE targets tumor cells to impair T-cell-mediated killing ex vivo and guild the ICB resistance in vivo.
Proteomics shows M2-exosomal ApoE deteriorates the immunogenicity of tumor cells
To in-depth decipher the mechanism of how M2-exosomal ApoE impacts tumor cells, we performed an LC/MS-based quantitative proteomics strategy to compare the proteomes of MC38 tumor cells pretreated with M0-exo vs M2-exo (). The initial analysis identified 342 proteins present in significantly different quantities, of which 75 proteins are upregulated and 267 proteins are downregulated (, Table S2). Given the ApoE-overexpressed MC38 mimicking the similar effect of M2-exosomal ApoE in terms of T-cell mediated killing, we also profiled the proteomics of Ctrl vs ApoE-OE MC38 cells (), in which 19 upregulated proteins and 76 downregulated proteins were identified in ApoE-OE MC38 cells compared to Ctrl cells (, Table S2). In total, 90 proteins were exclusively changed in M2-exo-treated MC38 cells, 43 proteins were exclusively changed in ApoE-OE MC38 cells, while the abundance of the remaining 52 proteins emerged as overlapped common hits that were significantly different in both M2-exo-treated and ApoE-OE MC38 cells, compared to control cells, respectively (, D, Table S6).
Figure 3. (A, B) Volcano Plots diagram (A) and quantification (B) showed downregulated (blue) and upregulated (red) proteins in MC38 which were treated with M2-exo versus M0-exo and ApoE-OE versus Ctrl. n = 3 per group. (C) Venn diagram showed the number of significantly different proteins from the four groups above. (D) Heatmap of 52 shared proteins of intersection in the Venn diagram above. (E, F) Top 30 GO terms of downregulated proteins in MC38 which was treated with M2-exo versus M0-exo (E) or ApoE-OE (F) versus Ctrl.Proteomics profiling of MC38 tumor cells treated with M2-exo or ApoE overexpression.
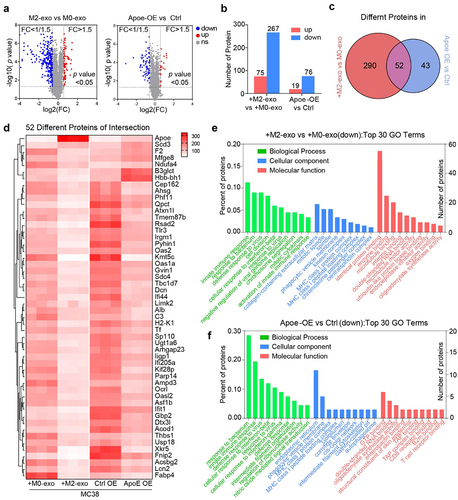
The clustering heat map indicated that highly ApoE enrichment through M2-exosomal transfer or genetic overexpression altered protein expression profiling in MC38 cells (). The overlapped downregulated proteins were subjected to GO classification to investigate biological processes, molecular function, and cellular compartment. Overall, it displayed a striking resemblance that a high overall overlap between the enriched categories in M2-exo-treated MC38 (, Table S3) and ApoE-OE MC38 cells (, Table S4). As expected, Apoe−/− M2-exo rescued protein changes caused by WT M2-exo (Figure S6A-C, Table S5). Remarkably, abundance-decreased proteins in MC38 cells with high ApoE were involved in the biological process such as cellular response to interferon-beta/gamma and innate immune response. These proteins were classified into cellular components such as the MHC class I protein complex and MHC class I peptides loading complex. Proteins associated with the molecular function were involved in antigen presentation-related proteins, as well as T-cell receptor binding, and B2M binding, all of which play important roles in the resistance to immunotherapy response. Downregulation of antigen presentation and IFN signaling categories in highly ApoE enrichment through M2-exosomal transfer concurred with ApoE genetic overexpression MC38, which indicated that M2-exosomal ApoE likely mediated T-cell killing through this pathway.
M2-exosomal ApoE degraded MHC class I expression of tumor cells
Given the functional similarity of the protein profiles to both treatments, we sought to find the major common functional determinants associated with the immune response and ICB response in tumor cells with highly ApoE enrichment through M2-exosomal transfer or genetic overexpression. Of note, when running the profiling on the proteomics combined with available knowledge, the critical feature that indicates tumor immunogenicity was MHC-I downregulation by ApoE enrichment in tumor cells, which induces the insufficient antigen presentation to activate T cells comprises a large proportion of patients leading to ICB resistance. MHC class I (MHC-I), the key component in antigen presentation, presents intracellular peptide antigens to the cell surface for recognition by antigen-specific CD8+ T cells. MHC-I loss or downregulation in cancer cells is a major mechanism of resistance to T-cell-based immunotherapies.Citation21,Citation24,Citation32
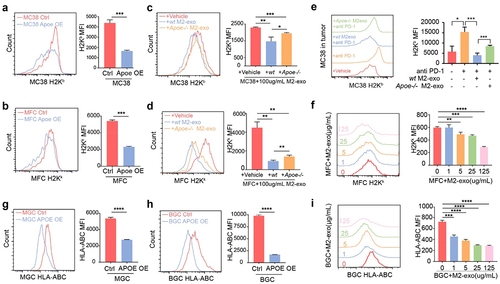
As we expected, MHC-I expression of MC38 cells was significantly decreased in tumor tissue after the intervention of M2-exo or TCM-Mexo (Figure S6D–F). The phenomenon demonstrated M2-exo deteriorated the immunogenicity of tumor cells consistent with the proteomics results expectation. To validate the impaired MHC-I expression in tumor cells by ApoE enrichment, we found that M2-exo and ApoE genetic overexpression significantly induce the MHC-I downregulation (, B). Notably, Apoe−/− M2-exo partially restores the MHC-I expression, indicating the impairment of MHC-I expression by M2-exo is ApoE dependent (). Consistent with in vitro results, we also found that M2-Exo induced the loss of MHC-I expression, and Apoe−/− M2-exo rescued the MHC-I expression of MC38 in ICB-treated tumor tissue (). Similarly, ApoE enrichment by genetic overexpression or M2-exosomal ApoE transfer impaired MHC-I expression in MFC cells (). To prove this phenotype for human relevance, we generate the human M2 macrophage from human monocytes and isolated M2-exo treated human gastric cancer cells BGC and MGC. In accordance with the murine tumor cells, ApoE-OE MGC and BGC also have downregulated MHC-I and M2-exo induces the impaired MHC-I in BGC cells (). Meanwhile, we detected the MHC-I expression on tumor cells after the treatment with free ApoE in the supernatant. The recombinant ApoE protein was unable to decrease MHC-I expression in BGC or MGC cells (Figure S6F). As we know, the transport of ApoE protein relies on receptors such as ApoER2 or low-density lipoprotein receptor (LDLR).Citation33 We confirmed the low expression of ApoER2 and LDLR in BGC or MGC cells by WB. However, HepG2 and Hela cells expressed a high level of ApoER2 and LDLR (Figure S6G) and the MHC-I expressions were decreased by recombinant ApoE in a dose-dependent way (Figure S6F). The transport of ApoE into the cytoplasm of tumor cells by exosomal transfer or receptor was essential for impairing the MHC-I expression.
Figure 4. M2-exo and ApoE overexpression hinders MHC class I expression of tumor cells. (A, B) Representative flow cytometric analysis and quantification of mean fluorescence intensity (MFI) of MHC class I complex H2Kb on MC38 cells (A) or H2Kk on MFC cells (B) with overexpressed ApoE or control. (C, D) Representative flow cytometric analysis and quantification of MFI of MHC class I complex H2Kb on MC38 cells (C) or H2Kk on MFC cells (D) co-cultured with M2-exo derived from WT mouse or Apoe−/− mouse. (E) Representative flow historiography and the quantified MFI of H2Kb on MC38 tumor cells in MC38-bearing mice with indicated treatment respectively. (F) Representative flow historiography and the quantified MFI of H2Kk on MFC cells co-cultured with M2-exo at incremental doses. (G, H) Representative flow cytometric analysis (G) and quantification (H) of MFI of HLA-ABC on human gastric cancer cell MGC-803 or BGC-823 with overexpressed ApoE or control. (I) the representative flow historiography and the quantified MFI of HLA-ABC on BGC-823 co-cultured with M2-exo at incremental doses. All data above are shown from three independent experiments. Error bars, SD. Two-sided Student’s t-test (A, B, G). One-way ANOVA with Tukey’s multiple comparison posttest (C– F, H, I).
Additionally, given that PD-L1 expression on cancer cells interacts with PD-1 on T cells enabling cancer cells to escape T-cell-mediated immune surveillanceCitation34, we also examined the impact of M2-exo on PD-L1 expression of tumor cells. We found that M2-exo upregulated PD-L1 of MFC, MC38 cells (Figure S7A–D), and BGC cells (Figure S7E–G) at the mRNA level and protein level. However, this PD-L1 induction is unlikely mediated by exosomal ApoE because ApoE-OE MFC did not induce the PD-L1 expression (Figure S8A–C). Also, we did not find a significant induction of PD-L1 on ApoE-OE MC38 cells (Figure S8D) or M2-exo administration in vivo (Figure S8E, F), indicating that tumoral PD-L1 induction of M2-exo is probably cell-context and did not necessarily dependent on ApoE. To sum up, our data revealed that M2-exosomal ApoE impaired tumoral MHC-I expression to deteriorate the immunogenicity of tumor cells.
ApoE inhibits the ATPase activity of BIP to downregulate MHC-I expression
To understand the detailed molecular mechanism of how ApoE enrichment elicits lower MHC-I expression, we sought to identify the direct functional protein of ApoE in tumor cells through Co-IP followed by LC-MS. Among the multiple proteins that potentially interact with ApoE, binding immunoglobulin protein (BiP; also termed GRP78) is the top protein binding with ApoE with the highest affinity (, Table S6). BiP, a major endoplasmic reticulum (ER) chaperone, acts as the primary sensor in the activation of the unfolded protein response, reducing ER stress levels due to an enhancement of the cellular folding capacity. Importantly, proper folding and assembly in the ER are essential steps for the expression of functional MHC-I molecules on the cell surface,Citation35 and BiP was reported to regulate the MHC-I repairing and loading.Citation36 Thus, we focus on BiP protein to figure out the molecular mechanism of ApoE-mediated MHC-I loss. By immunoprecipitation assay, we validated that ApoE binds with BiP (). Confocal co-localization assay also validated that M2-exosomal ApoE also interacted and colocalized with BiP in M2-Exo-treated MC38 cells (, Figure S8G).
Figure 5. ApoE binds and inhibits the ATPase activity of BIP to inhibit MHC-I expression on tumor cells. (A) Top ten ApoE binding proteins’ relative abundances in ApoE-OE MC38 by Co-IP and LC/MS. (B) BIP and ApoE binding analysis by Co-IP and WB. (C) Cellular co-localization of ApoE and BIP in MC38 after co-cultured with M2-exo. (D, E) H2Kk or H2Kb fluorescence intensity and MFI of MFC (D) and MC38 (E) which were cultured with HA15. n = 3 per group. (F, G) Predicted Schematic (F) and dock pose (G) of the active binding pose between BIP (PDB ID: 6ZYH) ATPase domain and ApoE (PDB ID: 1GS9). ZDock Score is 20.3. (H) the highest energy binding site of ApoE to EZ482 coincides with the dock poses of BIP to ApoE. Lib dock Score is 103.095. (I) Pi release rate of recombinant protein BIP plus its cochaperone EDJ that cultured with recombinant protein ApoE overnight after EZ-482 interfering or not. n = 3 per group. (J) Pi release rate of BIP from ApoE OE MC38 was detected after EZ-482 interfering or not. All data above are shown from three independent experiments.Error bars, SD. One-way ANOVA with Tukey’s multiple comparison posttest (D, E, I, J).
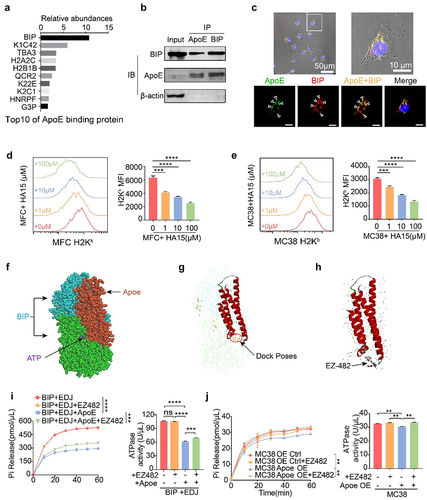
To explore BiP function on MHC-I expression in tumor cells, we tested the effect of BiP-specific inhibitor HA15 on MHC-I levels in MFC and MC38 cells. Indeed, HA15 treatment specifically downregulated MHC-I expression in a dose-dependent manner (). Given the function of BiP is dependent on the intrinsic ATPase activity, we applied the Discovery Studio Software to deduce the ApoE and BiP docking and predict that how ApoE affects the BiP activity. The ZDock results showed ApoE (PDB ID:1GS9) can bind on BiP (PDB ID: 6ZYH) and most dock poses were on the NBD chains of BiP which perform the ATPase activity (). This docking assay indicated that ApoE may blockade the ATP to locate BiP NBD chains and induce the downregulated ATPase activity of BiP. Consequently, we directly measured the ATPase activity of recombinant protein BiP or tumor cell-intrinsic BiP by Pi release rate. The dock sites of EZ-482, an ApoE ligand,Citation37 and ApoE coincided with the dock poses of BIP to ApoE (). Human recombinant protein BIP was cultured with human recombinant protein ApoE overnight with or without EZ-482 blocking the binding of ApoE with BiP. Functionally, ApoE inhibited the ATPase activity of BiP plus its cochaperone Edj by potential binding with BiP. However, EZ-482 rescued the ATPase activity of BiP by releasing the blocking binding with BiP (, S8H). Consistently, ApoE overexpression in MC38 cells also inhibited the ATPase activity of BiP while EZ-482 restored the BiP function (). These data suggested ApoE might exhibit the MHC-I downregulation by directly binding and inhibiting BiP function, indicating the potential of blocking the interaction between BiP and ApoE to restore the antitumor immune response.
ApoE ligand EZ-482 overcomes ICB resistance induced by M2-exo administration
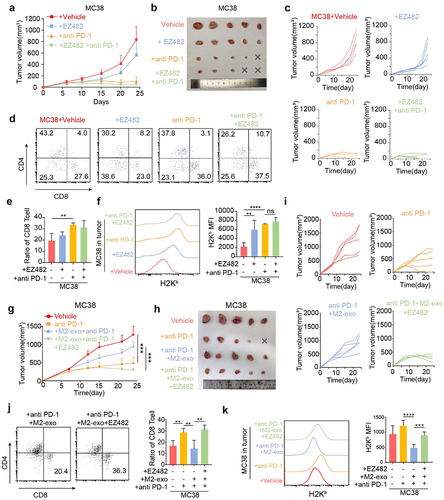
Lastly, we sought to test the effect of EZ-482 in the MC38 tumor model. Although oral administration of EZ-482 alone did not hinder tumor progression () and did not coordinate ICB therapy to increase the percentage of tumor-infiltrating CD8+ T cells significantly (), EZ-482 in combination with anti-PD-1 promoted MHC-I expression of MC38 cells, which counteracted the downregulated effect of MHC-I by M2 exosomal ApoE (). Obviously, M2-exo administration counteracted the slower tumor growth caused by anti-PD-1; however, the EZ-482 administration reduced tumor progression and rescue the ICB resistance induce by M2-exo (). Furthermore, the addition of EZ-482 in the anti-PD-1 + M2-exo group increased the presence of tumor-infiltrating CD8+ T cells (), indicating that EZ-482 remodeled the M2-exo-induced pro-tumor to anti-tumor TME. In addition, the EZ-482 treatment increased the MHC-I expression on the MC38 cells (), consistent with our in vitro experiment showing that EZ-482 treatment rescued the inhibitory function of ApoE enrichment on BiP binding and MHC-I expression. Altogether, immunosuppressive M2-exo can dampen ICB immunotherapy responses and our data support EZ-482 treatment enhancing MHC-I levels on cancer cells to partly rescue the M2-exo-induced ICB resistance as a promising strategy to improve ICB efficacy.
Figure 6. ApoE ligand, EZ-482, reverses ICB resistance induced by M2-exo. (A–C) Tumor means volume curve (A), harvest tumor image (B), and individual tumor growth curve (C) of MC38-bearing mice treated with Vehicle, EZ-482, anti-PD-1, or anti-PD1+EZ482. n = 5 per group. (D, E) Representative flow cytometry scatter diagrams of the CD4 and CD8 cells (D) and quantified the percentage of CD8+ T cells (E) in all CD3+ immune cells from MC38 tumors as indicated treatment. (F) Representative flow cytometric analysis and quantification of H2Kb MFI on MC38 cells in tumors of four groups above. (G–I) Tumor means volume curve (G), harvest tumor image (H), and individual tumor growth curve (I) of MC38-bearing mice treated with Vehicle, anti-PD1 antibody, anti-PD-1+M2-exo or anti-PD1+M2-exo+EZ482. n = 5 per group. (J) Representative flow cytometry scatter diagrams of the CD4 and CD8 cells and quantified the percentage of CD8+ T cells in all CD3+ immune cells from MC38 tumors as indicated treatment. (K) Representative flow cytometric analysis and quantification of H2Kb MFI on MC38 cells in tumors of four groups above. Error bars, SD. One-way ANOVA with Tukey’s multiple comparison posttest (E, F, J, K).
Discussion
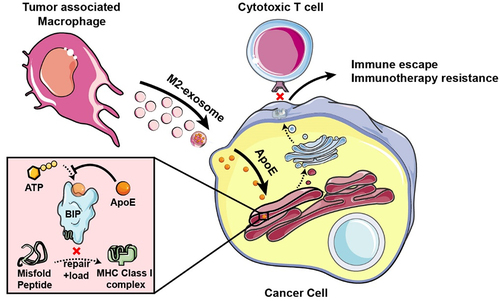
We reported here that immunosuppressive TAMs, especially M2 macrophages, confer ICB immunotherapy resistance by the secreted exosome. We further identified that M2-exosomal ApoE degraded MHC-I expression to repress tumor cell immunogenicity by targeting tumor-intrinsic ATPase activity of ER chaperone BiP (). Finally, we validated that the ApoE ligand, EZ-482, reverses ICB resistance induced by M2-exo in preclinical tumor models. These data suggest that the malignant phenotype of cancer cells can be altered by ApoE delivered by exosomes derived from neighboring macrophages in the TME and that inhibiting exosomal-ApoE function is an alternative modality in the treatment of cancer in combination with ICB.
Figure 7. Schema of that M2-like macrophage-derived exosomes induces immune escape of cancer cells. BIP protein has ATPase activity and can repair and load mismatched MHC-I. M2-exosomal ApoE is transferred to tumor cells and then binds to the BIP in the endoplasmic reticulum to inhibit its ATPase, resulting in decreased expression of MHC-I on tumor cells and inducing the immune escape to avoid CD8+ T-cell recognition and killing leading to ICB immunotherapy resistance.
Despite the incredible clinical benefits obtained using ICB therapy, resistance is still common for many types of cancer.Citation23,Citation26,Citation38–41 It is now acknowledged that even in the case of immunogenic tumors, the functions of effector CD8+ T cells are highly compromised by the presence of an immunosuppressive tumor microenvironment at the tumor site.Citation6 TAMs are abundant nonmalignant stromal cell types within the TME of most cancer types and they are crucial drivers of tumor progression, metastasis, and immune escape.Citation42,Citation43 The established pro-tumoral roles of TAMs include stimulating pro-tumor inflammation, constituting a suppressive immune microenvironment, facilitating cancer cell immune evasion, and deteriorating immunotherapy efficacy. In terms of the immune-suppressive function, it is well established that TAMs are capable to regulate either directly or indirectly cytolytic T-cell recruitment and functions. Given that TAMs are one of the dominant innate immune cell populations in tumors, the reciprocal interactions between cancer cells and TAMs, in particular M2-like TAMs, might shape the tumor immune landscape to impair ICB efficacy. In our previous studies, we showed that tumor-derived lipid content induced M2-like polarization of TAMs, which displayed pro-tumorigenic characteristics with decreased phagocytosis and impaired anti-tumor immunity.Citation9 In this study, we further revealed that M2-like macrophage modulated the tumor cell immunogenicity by secreted exosome to confer its immune suppressive function leading to the resistance to ICB therapy. As vital messengers, macrophage-derived exosomes can transfer multiple types of bioactive molecules such as proteins, RNA, and DNA from macrophages to recipient cells, modulating the biological function of recipient cells.Citation44,Citation45 Recently, increasing studies have shown that exosomes could play a crucial role in orchestrating the crosstalk between macrophages and cancer cells. In recent years, the growing evidenceCitation46–49 including our previous studies,Citation19,Citation20 showed that M2 macrophage-derived exosome modules tumor progression, metastasis, and chemotherapy resistance. To the best of our knowledge, this is the first report to discover the direct effect of macrophage on tumor-intrinsic immunogenicity by secreted exosomes to confer ICB resistance. This finding reveals a novel immunosuppressive role of M2-like macrophages by the secreted exosome, expanding the immunoregulation function for M2 macrophages in tumor immunity.
Furthermore, our present study delineated that the M2-exo – mediated tumor immunogenicity attenuation was dependent on exosome-transmitted ApoE, which was confirmed both in vivo and in vitro by the genetic knockout ApoE in M2-like macrophage. ApoE is an apolipoprotein that mediates cholesterol metabolism and has known roles in cardiovascular and Alzheimer’s disease.Citation50 Consistent with our previous report,Citation20 a recent study confirmed that elevated ApoE is highly dominantly elevated in TAMs within TME.Citation33 Unlike the recent report that the recombinant ApoE mediated immune suppression through the LDLR,Citation33 we identified that M2-exo transmitted ApoE deteriorates tumor-intrinsic immunogenicity by downregulating the surface expression of MHC-I, leading to despaired CD8+ T-cell-mediated tumor killing. The impaired antigen presentation caused by mutations or loss of MHC-I has been implicated in ICB resistance.Citation24,Citation25 Usually, the mutations of MHC-I are rarely found; however, downregulation of MHC-I expression on tumor cells is more frequent, which is the major common mechanism of immune evasionCitation51 and ICB resistance.Citation6 Interestingly, by utilizing Co-IP-based proteomics, we identified that M2-exo transmitted ApoE induces the MHC-I downregulation by directly binding and inhibiting the ATPase activity of BiP. The ER chaperone BiP is a master regulator of ER functions and inadequate BiP availability defines endoplasmic reticulum stress,Citation52,Citation53 which impairs MHC I-peptide presentation, in which ER stress is a typical feature of infected and malignant cells, can impair MHC I-peptide presentation impinging on cues for adaptive immune recognition.Citation54 Our study reveals a novel immunosuppressive role of M2-exosomal ApoE impairing tumor immunogenicity through the BiP signaling pathway. For the translational study, we further showed that the ApoE ligand EZ-482 can phenocopy ApoE deficiency and preferentially induce MHC-I expression, leading to enhanced sensitivity of cancer cells to T-cell-driven cytotoxicity. The combination of EZ-482 and ICB is likely to benefit patients with enriched M2-TAMs tumor microenvironments. This is potentially exciting given the biosafety of profiles of EZ-482, which has the potential for Alzheimer’s disease,Citation37 from multiple early-phase clinical studies.
Collectively, our results demonstrate that ApoE derived from M2-exo has the potential to induce tumor cell-intrinsic MHC-I loss leading to impaired CD8+ T-cell-mediated tumor killing and ICB resistance through down-regulating BiP activity, whereas the blockage of ApoE binding activity by ApoE ligand EPZ-482 in M2-exo-treated tumor cells abolishes ICB resistance. Notably, several studies have investigated the use of cancer therapies targeting M2 macrophages in clinical trials with little success. A valuable contribution of this study is the identification of the important role of M2-exosomal ApoE in ICB response, providing an alternative target that may prove to be more useful in the clinic where macrophage-targeting agents have failed. Thus, despite further investigation being warranted, we propose that the interruption of the ApoE-BiP-MHC-I pathway could be a useful therapeutic approach for ICB-resistant patients with M2-TAMs enriched microenvironment.
Data and materials availability
All data needed to evaluate the conclusions in the paper are present in the paper and/or the Supplementary Materials. Additional data related to this paper may be requested from the authors.
Supplemental Material
Download Zip (40.1 MB)Disclosure statement
No potential conflict of interest was reported by the authors.
Supplementary material
Supplemental data for this article can be accessed online at https://doi.org/10.1080/2162402X.2023.2210959.
Additional information
Funding
References
- Sharma P, Siddiqui BA, Anandhan S, Yadav SS, Subudhi SK, Gao J, Goswami S, Allison JP. The next decade of immune checkpoint therapy. Cancer Discov. 2021;11(4):838–14. doi:10.1158/2159-8290.CD-20-1680.
- Forde PM, Chaft JE, Smith KN, Anagnostou V, Cottrell TR, Hellmann MD, Zahurak M, Yang SC, Jones DR, Broderick S, et al. Neoadjuvant PD-1 blockade in resectable lung cancer. N Engl J Med. 2018;378(21):1976–1986. doi:10.1056/NEJMoa1716078.
- Tawbi HA, Forsyth PA, Algazi A, Hamid O, Hodi FS, Moschos SJ, Khushalani NI, Lewis K, Lao CD, Postow MA, et al. Combined nivolumab and ipilimumab in melanoma metastatic to the brain. N Engl J Med. 2018;379(8):722–730. doi:10.1056/NEJMoa1805453.
- Abril-Rodriguez G, Ribas A. SnapShot: immune checkpoint inhibitors. Cancer Cell. 2017;31(6):848. doi:10.1016/j.ccell.2017.05.010.
- Hegde PS, Chen DS. Top 10 challenges in cancer immunotherapy. Immunity. 2020;52(1):17–35. doi:10.1016/j.immuni.2019.12.011.
- Morad G, Helmink BA, Sharma P, Wargo JA. Hallmarks of response, resistance, and toxicity to immune checkpoint blockade. Cell. 2021;184(21):5309–5337. doi:10.1016/j.cell.2021.09.020.
- Shapouri-Moghaddam A, Mohammadian S, Vazini H, Taghadosi M, Esmaeili S-A, Mardani F, Seifi B, Mohammadi A, Afshari JT, Sahebkar A. Macrophage plasticity, polarization, and function in health and disease. J Cell Physiol. 2018;233(9):6425–6440. doi:10.1002/jcp.26429.
- Locati M, Curtale G, Mantovani AD. Mechanisms, and significance of macrophage plasticity. Annu Rev Pathol. 2020;15(1):123–147. doi:10.1146/annurev-pathmechdis-012418-012718.
- Luo Q, Zheng N, Jiang L, Wang T, Zhang P, Liu Y, Zheng P, Wang W, Xie G, Chen L, et al. Lipid accumulation in macrophages confers protumorigenic polarization and immunity in gastric cancer. Cancer Sci. 2020;111(11):4000–4011. doi:10.1111/cas.14616.
- Wu K, Lin K, Li X, Yuan X, Xu P, Ni P, Xu D. Redefining tumor-associated macrophage subpopulations and functions in the tumor microenvironment. Front Immunol. 2020;11:1731. doi:10.3389/fimmu.2020.01731.
- Yu J, Green MD, Li S, Sun Y, Journey SN, Choi JE, Rizvi SM, Qin A, Waninger JJ, Lang X, et al. Liver metastasis restrains immunotherapy efficacy via macrophage-mediated T cell elimination. Nat Med. 2021;27(1):152–164. doi:10.1038/s41591-020-1131-x.
- Wang X, Tokheim C, Gu SS, Wang B, Tang Q, Li Y, Traugh N, Zeng Z, Zhang Y, Li Z. In vivo CRISPR screens identify the E3 ligase Cop1 as a modulator of macrophage infiltration and cancer immunotherapy target. Cell. 2021;184(21): 5357–5374.e22. doi:10.1016/j.cell.2021.09.006.
- Diskin B, Adam S, Cassini MF, Sanchez G, Liria M, Aykut B, Buttar C, Li E, Sundberg B, Salas RD, et al. PD-L1 engagement on T cells promotes self-tolerance and suppression of neighboring macrophages and effector T cells in cancer. Nat Immunol. 2020;21(4):442–454. doi:10.1038/s41590-020-0620-x.
- Lin C, He H, Liu H, Li R, Chen Y, Qi Y, Jiang Q, Chen L, Zhang P, Zhang H, et al. Tumour-associated macrophages-derived CXCL8 determines immune evasion through autonomous PD-L1 expression in gastric cancer. Gut. 2019;68(10):1764–1773. doi:10.1136/gutjnl-2018-316324.
- Mantovani A, Marchesi F, Malesci A, Laghi L, Allavena P. Tumour-associated macrophages as treatment targets in oncology. Nat Rev Clin Oncol. 2017;14(7):399–416. doi:10.1038/nrclinonc.2016.217.
- Yap TA, Parkes EE, Peng W, Moyers JT, Curran MA, Tawbi HA. Development of immunotherapy combination strategies in cancer. Cancer Discov. 2021;11(6):1368–1397. doi:10.1158/2159-8290.CD-20-1209.
- Thery C, Witwer KW, Aikawa E, Alcaraz MJ, Anderson JD, Andriantsitohaina R, Antoniou A, Arab T, Archer F, Atkin-Smith GK, et al. Minimal information for studies of extracellular vesicles 2018 (MISEV2018): a position statement of the international society for extracellular vesicles and update of the MISEV2014 guidelines. J Extracell Vesicles. 2018;7(1):1535750. doi:10.1080/20013078.2018.1535750.
- Kalluri R, LeBleu VS. The biology, function, and biomedical applications of exosomes. Science. 2020;367(6478). doi:10.1126/science.aau6977.
- Zheng P, Chen L, Yuan X, Luo Q, Liu Y, Xie G, Ma Y, Shen L. Exosomal transfer of tumor-associated macrophage-derived miR-21 confers cisplatin resistance in gastric cancer cells. J Exp Clin Cancer Res. 2017;36(1):53. doi:10.1186/s13046-017-0528-y.
- Zheng P, Luo Q, Wang W, Li J, Wang T, Wang P, Chen L, Zhang P, Chen H, Liu Y, et al. Tumor-associated macrophages-derived exosomes promote the migration of gastric cancer cells by transfer of functional Apolipoprotein E. Cell Death Dis. 2018;9(4):434. doi:10.1038/s41419-018-0465-5.
- Gu SS, Zhang W, Wang X, Jiang P, Traugh N, Li Z, Meyer C, Stewig B, Xie Y, Bu X, et al. Therapeutically increasing MHC-I expression potentiates immune checkpoint blockade. Cancer Discov. 2021;11(6):1524–1541. doi:10.1158/2159-8290.CD-20-0812.
- Montesion M, Murugesan K, Jin DX, Sharaf R, Sanchez N, Guria A, Minker M, Li G, Fisher V, Sokol ES, et al. Somatic HLA class I loss is a widespread mechanism of immune evasion which refines the use of tumor mutational burden as a biomarker of checkpoint inhibitor response. Cancer Discov. 2021;11(2):282–292. doi:10.1158/2159-8290.CD-20-0672.
- Yamamoto K, Venida A, Yano J, Biancur DE, Kakiuchi M, Gupta S, Sohn ASW, Mukhopadhyay S, Lin EY, Parker SJ, et al. Autophagy promotes immune evasion of pancreatic cancer by degrading MHC-I. Nature. 2020;581(7806):100–105. doi:10.1038/s41586-020-2229-5.
- Rodig SJ, Gusenleitner D, Jackson DG, Gjini E, Giobbie-Hurder A, Jin C, Chang H, Lovitch SB, Horak C, Weber JS, et al. MHC proteins confer differential sensitivity to CTLA-4 and PD-1 blockade in untreated metastatic melanoma. Sci Transl Med. 2018;10(450). doi:10.1126/scitranslmed.aar3342.
- McGranahan N, Rosenthal R, Hiley CT, Rowan AJ, Watkins TBK, Wilson GA, Birkbak NJ, Veeriah S, Van Loo P, Herrero J, et al. Allele-Specific HLA loss and immune escape in lung cancer evolution. Cell. 2017;171(6):1259–1271.e1211. doi:10.1016/j.cell.2017.10.001.
- Jerby-Arnon L, Shah P, Cuoco MS, Rodman C, Su M-J, Melms JC, Leeson R, Kanodia A, Mei S, Lin J-R, et al. A cancer cell program promotes T cell exclusion and resistance to checkpoint blockade. Cell. 2018;175(4):984–997 e924. doi:10.1016/j.cell.2018.09.006.
- Zhang Q, Deng T, Zhang H, Zuo D, Zhu Q, Bai M, Liu R, Ning T, Zhang L, Yu Z, et al. Adipocyte‐derived exosomal MTTP suppresses ferroptosis and promotes chemoresistance in colorectal cancer. Advanced Science. 2022;9(28):2203357. doi:10.1002/advs.202203357.
- Vredevoogd DW, Kuilman T, Ligtenberg MA, Boshuizen J, Stecker KE, de Bruijn B, Krijgsman O, Huang X, Kenski JCN, Lacroix R, et al. Augmenting immunotherapy impact by lowering tumor TNF cytotoxicity threshold. Cell. 2019;178(3):585–599 e515. doi:10.1016/j.cell.2019.06.014.
- Burr ML, Sparbier CE, Chan KL, Chan Y-C, Kersbergen A, Lam EYN, Azidis-Yates E, Vassiliadis D, Bell CC, Gilan O, et al. An evolutionarily conserved function of polycomb silences the MHC class I antigen presentation pathway and enables immune evasion in cancer. Cancer Cell. 2019;36(4):385–401 e388. doi:10.1016/j.ccell.2019.08.008.
- Goel S, DeCristo MJ, Watt AC, BrinJones H, Sceneay J, Li BB, Khan N, Ubellacker JM, Xie S, Metzger-Filho O, et al. CDK4/6 inhibition triggers anti-tumour immunity. Nature. 2017;548(7668):471–475. doi:10.1038/nature23465.
- Ishizuka JJ, Manguso RT, Cheruiyot CK, Bi K, Panda A, Iracheta-Vellve A, Miller BC, Du PP, Yates KB, Dubrot J, et al. Loss of ADAR1 in tumours overcomes resistance to immune checkpoint blockade. Nature. 2019;565(7737):43–48. doi:10.1038/s41586-018-0768-9.
- Starling S. MHC molecules: immune editing shapes the cancer landscape. Nat Rev Immunol. 2017;17(12):729. doi:10.1038/nri.2017.129.
- Kemp SB, Carpenter ES, Steele NG, Donahue KL, Nwosu ZC, Pacheco A, Velez-Delgado A, Menjivar RE, Lima F, The S, et al. Apolipoprotein E promotes immune suppression in pancreatic cancer through NF-κB–Mediated production of CXCL1. Cancer Res. 2021;81(16):4305–4318. doi:10.1158/0008-5472.CAN-20-3929.
- Errico AI. PD-1–PD-L1 axis: efficient checkpoint blockade against cancer. Nat Rev Clin Oncol. 2015;12(2):63. doi:10.1038/nrclinonc.2014.221.
- de Almeida SF, Fleming JV, Azevedo JE, Carmo-Fonseca M, de Sousa M. Stimulation of an unfolded protein response impairs MHC class I expression. J Immunol. 2007;178(6):3612–3619. doi:10.4049/jimmunol.178.6.3612.
- Hegde NR, Chevalier MS, Wisner TW, Denton MC, Shire K, Frappier L, Johnson DC. The role of BiP in endoplasmic reticulum-associated degradation of major histocompatibility complex class I heavy chain induced by cytomegalovirus proteins. J Biol Chem. 2006;281(30):20910–20919. doi:10.1074/jbc.M602989200.
- Mondal T, Wang H, DeKoster GT, Baban B, Gross ML, Frieden C. ApoE: in Vitro studies of a small molecule effector. Biochemistry. 2016;55(18):2613–2621. doi:10.1021/acs.biochem.6b00324.
- George S, Miao D, Demetri GD, Adeegbe D, Rodig SJ, Shukla S, Lipschitz M, Amin-Mansour A, Raut CP, Carter SL, et al. Loss of PTEN is associated with resistance to anti-PD-1 checkpoint blockade therapy in metastatic uterine leiomyosarcoma. Immunity. 2017;46(2):197–204. doi:10.1016/j.immuni.2017.02.001.
- Verma V, Shrimali RK, Ahmad S, Dai W, Wang H, Lu S, Nandre R, Gaur P, Lopez J, Sade-Feldman M, et al. PD-1 blockade in subprimed CD8 cells induces dysfunctional PD-1(+)CD38(hi) cells and anti-PD-1 resistance. Nat Immunol. 2019;20(9):1231–1243. doi:10.1038/s41590-019-0441-y.
- Restifo NP, Smyth MJ, Snyder A. Acquired resistance to immunotherapy and future challenges. Nat Rev Cancer. 2016;16(2):121–126. doi:10.1038/nrc.2016.2.
- Pan D, Kobayashi A, Jiang P, Ferrari de Andrade L, Tay RE, Luoma AM, Tsoucas D, Qiu X, Lim K, Rao P, et al. A major chromatin regulator determines resistance of tumor cells to T cell–mediated killing. Science. 2018;359(6377):770–775. doi:10.1126/science.aao1710.
- Cassetta L, Pollard JW. Targeting macrophages: therapeutic approaches in cancer. Nat Rev Drug Discov. 2018;17(12):887–904. doi:10.1038/nrd.2018.169.
- DeNardo DG, Ruffell B. Macrophages as regulators of tumour immunity and immunotherapy. Nat Rev Immunol. 2019;19(6):369–382. doi:10.1038/s41577-019-0127-6.
- Wang Y, Zhao M, Liu S, Guo J, Lu Y, Cheng J, Liu J. Macrophage-derived extracellular vesicles: diverse mediators of pathology and therapeutics in multiple diseases. Cell Death & Disease. 2020;11(10):924. doi:10.1038/s41419-020-03127-z.
- Colombo M, Raposo G, Thery C. Biogenesis, secretion, and intercellular interactions of exosomes and other extracellular vesicles. Annu Rev Cell Dev Biol. 2014;30(1):255–289. doi:10.1146/annurev-cellbio-101512-122326.
- Wu J, Gao W, Tang Q, Yu Y, You W, Wu Z, Fan Y, Zhang L, Wu C, Han G, et al. Retracted: m2 macrophage–derived exosomes facilitate HCC metastasis by transferring αMβ2 integrin to tumor cells. Hepatology. 2021;73(4):1365–1380. doi:10.1002/hep.31432.
- Lan J, Sun L, Xu F, Liu L, Hu F, Song D, Hou Z, Wu W, Luo X, Wang J, et al. M2 macrophage-derived exosomes promote cell migration and invasion in colon cancer. Cancer Res. 2019;79(1):146–158. doi:10.1158/0008-5472.CAN-18-0014.
- Yang Y, Guo Z, Chen W, Wang X, Cao M, Han X, Zhang K, Teng B, Cao J, Wu W, et al. M2 macrophage-derived exosomes promote angiogenesis and growth of pancreatic ductal adenocarcinoma by targeting E2F2. Mol Ther. 2021;29(3):1226–1238. doi:10.1016/j.ymthe.2020.11.024.
- Guo Y, Wu H, Xiong J, Gou S, Cui J, Peng T. MiR-222-3p-containing macrophage-derived extracellular vesicles confer gemcitabine resistance via TSC1-mediated mTOR/AKT/PI3K pathway in pancreatic cancer. Cell Biol Toxicol. 2022. doi:10.1007/s10565-022-09736-y.
- Mahley RW. Apolipoprotein E: from cardiovascular disease to neurodegenerative disorders. J Mol Med (Berl). 2016;94(7):739–746. doi:10.1007/s00109-016-1427-y.
- Pommier A, Anaparthy N, Memos N, Kelley ZL, Gouronnec A, Yan R, Auffray C, Albrengues J, Egeblad M, Iacobuzio-Donahue CA, et al. Unresolved endoplasmic reticulum stress engenders immune-resistant, latent pancreatic cancer metastases. Science. 2018;360(6394). doi:10.1126/science.aao4908.
- Pobre KFR, Poet GJ, Hendershot LM. The endoplasmic reticulum (ER) chaperone BiP is a master regulator of ER functions: getting by with a little help from ERdj friends. J Biol Chem. 2019;294(6):2098–2108. doi:10.1074/jbc.REV118.002804.
- Vitale M, Bakunts A, Orsi A, Lari F, Tadè L, Danieli A, Rato C, Valetti C, Sitia R, Raimondi A, et al. Inadequate BiP availability defines endoplasmic reticulum stress. eLife. 2019;8:e41168. doi:10.7554/eLife.41168.
- Granados DP, Tanguay P-L, Hardy M-P, Caron É, de Verteuil D, Meloche S, Perreault C. ER stress affects processing of MHC class I-associated peptides. BMC Immunol. 2009;10(1):10. doi:10.1186/1471-2172-10-10.