
ABSTRACT
Changes in intermediary metabolism have profound effects on many aspects of C. elegans biology including growth, development and behavior. However, many traditional biochemical techniques for analyzing chemical composition require relatively large amounts of starting material precluding the analysis of mutants that cannot be grown in large amounts as homozygotes. Here we describe a technique for detecting changes in the chemical compositions of C. elegans worms by Fourier transform infrared microspectroscopy. We demonstrate that the technique can be used to detect changes in the relative levels of carbohydrates, proteins and lipids in one and the same worm. We suggest that Fourier transform infrared microspectroscopy represents a useful addition to the arsenal of techniques for metabolic studies of C. elegans worms.
Introduction
The reactions that occur in intermediary metabolism within multicellular eukaryotes were largely identified by biochemical techniques. Although biochemical approaches have been phenomenally successful in identifying the myriad reactions through which cells store or use energy, or synthesize the building blocks of macromolecules, significant gaps in our understanding remain. In particular, our knowledge of how metabolic processes are regulated is far from complete. There is also a need for a deeper understanding of how the misregulation of particular metabolic pathways in certain metabolic diseases affects other aspects of metabolism or physiology. How, for example, increased lipid synthesis in obese people leads to defects in the secretion or reception of insulin. For such studies it is frequently important to determine the metabolic state of a particular cell type within a tissue containing several or many others. In such circumstances, biochemical techniques may not be sufficient either because it is difficult to isolate the desired cell type from surrounding tissue or because insufficient material can be extracted for the relevant biochemical analysis. To address these problems, several different vibrational microspectroscopic techniques have been developed that can be used to detect and analyze variations in the chemical compositions of different groups of cells within tissue sections.Citation1,2 In these techniques, different types of spectroscopy are used in combination with microscopy to generate a grid of spectra that together sample the entire optic field. Examples of microspectroscopic techniques used in biomedical imaging include coherent anti-Stokes Raman scattering (CARS),Citation3 stimulated Raman scattering (SRS) Citation4 and Fourier transform-infrared (FT-IR).Citation5 While these microspectroscopic techniques generally do not allow the identification of individual metabolites (e.g. differentiate between glucose and galactose in a complex chemical mixture), they can nevertheless be used to detect classes of molecules such as long chain fatty acids, polypeptides, carbohydrates etc., and thereby provide information about how the relative proportions of these classes vary within and among sample sets.Citation6
Genome analyses together with the characterization of metabolic mutants including those of Caenorhabditis elegans and Drosophila melanogaster have strongly suggested that intermediary metabolism is highly conserved in metazoans and that flux through many metabolic pathways is regulated by similar mechanisms in evolutionarily widely diverged organisms.Citation7-9 Thus it is likely that further genetic studies with worms, flies and other invertebrates will provide important general insights into how metabolic pathways are regulated. For wild-type worms, as well as for those mutants that are viable and fertile as homozygotes, the generation of sufficient starting material for use in biochemical experiments is not a significant problem. For such strains, the abundance of particular metabolites can be measured with great accuracy and sensitivity by various techniques including nuclear magnetic resonance (NMR) spectroscopy,Citation10 matrix assisted laser desorption ionization-time-of-flight mass spectrometry (MALDI-TOF MS) Citation11 or, in the case of lipids, by the combination of thin layer and gas-liquid chromatography.Citation12 However, potentially interesting metabolic mutants exist that are not viable or fertile as homozygotes Citation13-15 and that cannot, therefore, be grown in sufficiently large amounts for these types of analysis. Thus, there is a need for techniques that can be used to assess chemical composition of much smaller samples.
Fourier transform-infrared (FT-IR) spectroscopy is a spectroscopic technique that can be used to study molecular structure. The energy of infrared light facilitates transitions between vibrational (or rotational) energy states of chemical compounds. Since the energies of these vibrational (or rotational) transitions are characteristic of particular chemical bonds, FT-IR spectroscopy can be used to obtain information about the functional groups and chemical structure of a compound, or about the composition of a mixture of compounds.Citation16 In biological samples containing entire cells, the absorption at infrared wavelengths is dominated first by that of water and thereafter by the major classes of molecules with infrared active groups found in cells, such as polypeptides, carbohydrates and those containing long-chain fatty acyl moieties (e.g., triglycerides and phospholipids).Citation5 When water is excluded, major bands in the FT-IR spectrum result from absorption by molecules containing carbon-hydrogen bonds, amide bonds, and hydroxyl groups and sugar rings i.e. carbohydrates. In particular, C–H bonds result in absorption between 2800 and 3000 cm−1; amide bonds result in bands in the regions 1584–1718 cm−1 (amide I) and 1484–1583 cm−1 (amide II); carbohydrates result in bands in the regions 1020–1130 cm−1 and 1140–1180 cm−1. The vast majority of amide groups in the cell are found in proteins. Thus, the intensities of the amide bands give a measure of the amount of polypeptides. Of the 2 bands resulting from absorption by carbohydrates, the 1020–1130 cm−1 band results from absorption by individual sugar rings whereas the 1140–1180 cm−1 band results from absorption by the C–O–C bonds in polysaccharides that link adjacent rings. Thus, the band between 1140–1180 cm−1 can be correlated to the polysaccharide content whereas the 1020–1130 cm−1 band gives a measure of the total carbohydrate content. The majority of C–H bonds in cells are in long-chain fatty acids, thus, the intensity of the bands in the 2800–3000 cm−1 region is closely related to the amount of lipids. Therefore, by measuring the absorption across the relevant part of the infrared spectrum, it is possible to assess the relative proportions of lipids, polypeptides and carbohydrates in a mixture.Citation5
FT-IR spectroscopy combined with microscopy (termed FT-IR microspectroscopy) can be used to study how the relative proportions vary between different areas in a spatial (2-dimensional) context.Citation5 Typically, FT-IR microspectroscopy is performed in a non-confocal manner so it is not possible to extract information about chemical compositional changes along the z-axis using this technique (i.e., “depth profiling” is not possible). Commercially available tabletop FT-IR microspectroscopy setups provide diffraction limited spatial resolution.Citation17 In practical terms, this means a spatial resolution of ca. 5 micrometers in the 4000 cm−1 region and 20 µm in the 900 cm−1 spectral region respectively. Within these limits, FT-IR microspectroscopic analyses can reveal whether particular regions in the sample have a proportionally greater amount of lipids, proteins or carbohydrates. A further advantage of FT-IR microspectroscopic analysis is that, in contrast to traditional biochemical techniques, it is non-destructive.
FT-IR microspectroscopy has several distinct advantages over other microspectroscopic methods for determining chemical composition: it is fast, very sensitive and, since signal intensity is generally linearly related to sample amounts, few assumptions need to be made about how signals at different wavelengths vary with the relative amounts of the molecules under study.Citation18 Furthermore, FT-IR microspectroscopy is not disrupted by fluorescence either from natural compounds in the sample or from fluorescent proteins encoded by transgenes.
Previously, it has been shown that the pharynx, intestinal and tail regions of nematodes of several different species (including C. elegans) give statistically significant different FT-IR spectra and that the absorption spectra from the pharyngeal regions can be used to distinguish between different species.Citation19 Here we describe the application of FT-IR microspectroscopy for the analysis of the broad chemical composition of C. elegans worms. We describe methods that allow the detection of differences in the relative amounts of carbohydrates, proteins and lipids between wild-type and mutant strains based on FT-IR spectra. We aim to draw attention to FT-IR microspectroscopy as a useful addition to the arsenal of techniques used to study how the chemical composition of worms is regulated.
Results
Our initial attempts to use FT-IR spectroscopy to analyze the compositions of whole adult hermaphrodite worms were not successful because the specimens absorbed too much light. The strong absorption led to many of the spectral bands being saturated, meaning that they could not be used to determine the relative proportions of the different components giving rise to the signals. With fourth larval stage (L4) worms, however, this problem does not arise. The different steps involved in obtaining FT-IR microspectroscopic data from C. elegans worms are shown in Figure S1. To generate a field of spectra, we washed worms with M9 medium to remove excess E. coli bacteria and then mounted them on CaF2 slides, which are transparent to IR radiation. Worms can either be mounted in pairs lying close to one another or separately on different parts of the slide. The former method has the advantage that worm pairs (e.g. mutant and wild-type or treated and non-treated) can be recorded within the same image meaning that fewer images in total need to be obtained. Additionally, small differences in background signals are minimized in this way and worms can be easily compared within the same image. Having worms on separate parts of the slide, on the other hand, obviates the need to assign pixels in the adjoining region manually to one or other worm in the pair. Using a 64 × 64 focal plane array (FPA) detector, 4096 individual FT-IR spectra that together cover an area of approximately 170 × 170 μm can be obtained in less than one minute. Longer measurement times can be used if necessary to reduce signal to noise ratio but we found acquisition times of around one minute to be sufficient. Figure S2 shows a single spectrum from a single pixel. The general form of the spectrum is similar to that seen in experiments with animal cells.Citation1 In particular, regions assigned to carbohydrates, proteins and lipids can all be identified (as discussed above), and are marked in the figure.
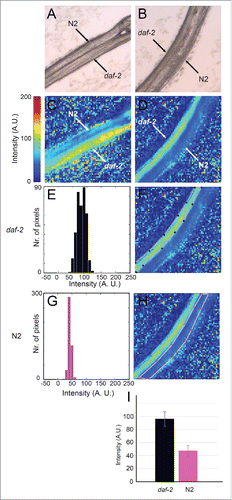
Bands (peaks) in FT-IR spectra appear as a result of absorption of infrared light at those particular wavelengths (energies). The amount of absorption (i.e. band intensity) at a given pixel at a given wavelength is determined in part by the concentration of the molecules absorbing light at that wavelength and in part by the thickness of the sample at that pixel. Since individual worms have different thicknesses and since, even within one specimen, the thickness varies at different pixels as a consequence of the worm's tubular geometry, the absolute absorption varies from worm to worm and from pixel to pixel. Therefore, in order to be able to compare different samples, all the individual spectra for different pixels need to be normalized with respect to total absorption over the entire spectral range at that pixel. From the normalized data, it is possible for any given pixel to calculate the proportion of the total absorption resulting from absorption by a particular type of functional group (for example, peptide bonds in proteins). These relative proportions calculated for each individual pixel can then be used to generate heat maps covering the entire image that show how the relative proportions vary. Panels C and D in show heat maps indicating the relative proportions of C-H band intensities in the region of 2800–3000 cm−1 in images of pairs of wild-type and daf-2 mutant hermaphrodite larvae. Gas-liquid chromatography has been used to show that daf-2(e1370ts) mutants have increased levels of triglycerides compared to wild type.Citation12 Consistent with this biochemical analysis, the heat maps show that the intensities of the lipid-associated bands at 2800–3000 cm−1 are generally greater for the mutant compared to wild type. Panels E-I show quantification of the data for the pair on the right. In all the pairs examined, the average intensities of these lipid-associated bands were at least twice as high in the mutant compared to wild type. This figure agrees well with the results obtained by gas-liquid chromatography.Citation12
Figure 1. FT-IR microspectroscopy detects differences in lipid composition between wild type and daf-2 mutant worms. A and B show bright field images of pairs of wild-type and mutant L4 hermaphrodite worms. N2 indicates the wild-type strain, Bristol N2; daf-2 denotes the hypomorphic allele, daf-2(e1370). C and D show relative intensity heat maps of absorption in the 3000–2000 cm−1 region. Each pixel indicates the relative intensity value calculated from one spectrum. The relative intensity values are calculated by summing the absorption for the 3000–2000 cm−1 region and then dividing by the total absorption across the entire spectrum. A higher relative intensity indicates that the C-H band absorption is a greater proportion of the total absorption at that pixel. The total absorption thus acts as internal control for each data point implying that although the worm may vary in thickness across the sample, the thickness does not affect the relative intensity value. E-I. Quantification of the relative intensity data shown in C and D. F and H show the heat maps displayed in C and D with the areas (pixels) of each image subjected to analysis indicated by colored outlines. E and G show histograms giving the relative intensity distributions for pixels in regions outlined in F and H respectively. I shows a graph of the average relative intensities of all pixels from 3 independent images of worms of either genotype. Between 275 and 448 spectra from each image were used for the calculations.
For certain experiments it is useful to be able to analyze the chemical compositions of adult worms. Since we were unable to obtain satisfactory spectra with whole adult worms, we tested whether tissue dissected from adult worms was amenable to analysis by FT-IR microspectroscopy. The main adipose tissue in C. elegans is the intestine, a relatively large organ that can be physically dissected from the rest of the body. In contrast to the case with whole adult worms, dissected intestinal tissue is thin enough to allow unsaturated spectra to be obtained from all parts of the sample. Panels A-F in show heat maps generated with data from scans of intestines.
Figure 2. FT-IR microspectroscopy can be used to analyze intestinal tissue dissected from adult worms. A – F show relative intensity heat maps of the absorption in the 3000–2000 cm−1 region (lipids) generated with intestinal tissue dissected from adult worms. Each pixel indicates the relative intensity value calculated from one spectrum. N2 indicates the wild-type strain, Bristol N2; daf-2 denotes the hypomorphic allele, daf-2(e1370). Note that many pixels in the images of the daf-2 mutant intestines show the highest relative intensities whereas this is not the case for pixels in the images for wild-type intestines. G-L. Relative intensity heat maps of the absorption in the 1020–1130 cm−1 region for the same dissected intestinal tissue shown in A-F. Note that many pixels in the images of the daf-2 mutant intestines show the highest relative intensities whereas this is not the case for pixels in the images for wild-type intestines. M-R. Relative intensity heat maps of the absorption in the 1140–1180 cm−1 region. There is a modest trend for the relative intensities to be lower in the daf-2 mutants than in wild type. The increased blurriness of the images shown in G to R is because the spatial resolution is less for the higher wavelength of the radiation absorbed by polysaccharides or simple carbohydrates.
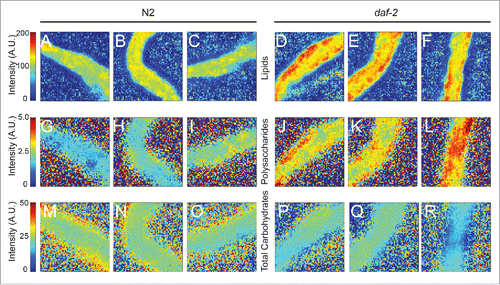
The relative intensities of the lipid-associated bands (2800–3000 cm−1) are generally higher for the daf-2 mutant intestines (D-F) than for those from wild type (A-C).
In contrast, the maps of total absorption by the wild type and mutant tissue are similar (Fig. S3). Thus, the observed differences are not the results of thickness variations but of concentration differences.
Although daf-2 mutants are known from previous work to contain elevated levels of triglycerides, the levels of polysaccharides or of total carbohydrates in these mutants has not been previously reported. Panels G-L in show heat maps giving the relative intensities of the polysaccharide-associated band (-C-O-C- vibrations at 1140–1180 cm−1) in the arrays covering the dissected intestines from wild type and daf-2(e1370). The intensities are clearly generally higher in the mutant compared to wild type suggesting that, as it does in mammals, insulin signaling in C. elegans alters either the rate at which polysaccharides are synthesized from sugars or the rate at which polysaccharides are broken down (or both). In the case of total carbohydrates (bands in the region of 1020–1130 cm−1), there was a trend for the relative intensities to be lower in the daf-2 mutant compared to wild type but these were not statistically significant (). Note that all the information used to assess chemical composition is collected during the same scan i.e., that the data used to calculate the relative proportions of lipids and carbohydrates is collected simultaneously. The speed with which data can be collected compares very favourably with other methods for analyzing chemical composition.
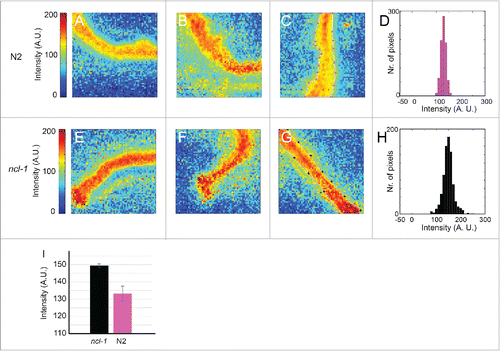
FT-IR microspectroscopy can also be used to assess differences in protein content. ncl-1 encodes a negative regulator of ribosome synthesis and biochemical analyses have revealed that ncl-1 mutants have 22% more protein per gram of dry weight than wild type.Citation20 Panels A-C and E-G in show heat maps generated with intestinal tissue from wild type and ncl-1 mutants. The relative intensities of the amide I band (1584–1718 cm−1) are indicated. Heat maps showing the total intensities determined with the same samples are shown in Figure S4, proving that differences are not due to thickness variations. and show statistical analyses of the images shown in panels and . Consistent with the biochemical studies on ncl-1 mutants,Citation20 FT-IR microspectroscopy detects a significant increase in the relative amount of protein in ncl-1(e1865) mutants compared to wild type.
Figure 3. FT-IR detects differences between the relative protein levels in wild-type hermaphrodites and ncl-1 mutants. A-C and E-G show relative intensity heat maps of the absorption in the 1584–1718 cm−1 (amide I) region by dissected intestinal tissue. N2 indicates the wild-type strain, Bristol N2; ncl-1 denotes ncl-1(e1865). There is a modest trend for the relative intensities to be higher in the ncl-1 mutants than in wild type, corresponding to an increased proportion of proteins. D, H and I show quantification of the relative intensity data shown in the images. D and H show histograms giving the distributions of the relative intensities for pixels from the regions outlined in C and G respectively. N2 indicates the wild-type strain (pink), Bristol N2; ncl-1 denotes ncl-1(e1865) (black). I shows a graph of the average relative intensities of all pixels from 3 independent images of worms of either genotype. Between 593 and 875 spectra from each image were used for the calculations.
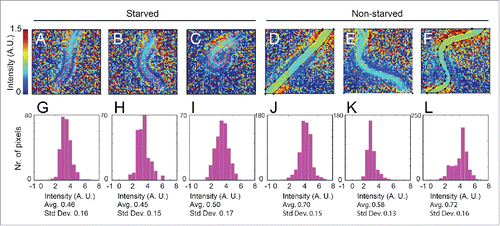
Some mutations causing metabolic defects cause growth arrest at early larval stages.Citation21 In such cases, it is particularly difficult to obtain sufficient material for biochemical analyses because for a given weight of worms, far greater numbers of homozygous mutants must be isolated from a population of non-homozygotes. shows that FT-IR microspectroscopy can be applied to first larval (L1) stage larvae. The figure shows heat maps indicating the relative intensity of the total carbohydrate band (1020–1130 cm−1) in starved and well-fed larvae. As expected, the intensity was generally lower in the starved worms than in their non-starved siblings. For starved worms shown, the average intensity was 0.47 whereas that for the non-starved siblings was 0.65.
Figure 4. FT-IR detects differences between carbohydrate levels in starved and non-starved larvae. A-F show relative intensity heat maps for the absorption in the 1020–1130 cm−1 region (carbohydrates) by first larval (L1) stage hermaphrodites. A-C show images of starved larvae; D-F show images of their non-starved siblings. G-L show histograms giving the distributions of the relative intensities of the 1020–1130 cm−1 region (carbohydrates) for pixels from the regions outlined in the heat maps. There is a modest but statistically significant trend for the relative intensities to be lower in the starved worms, corresponding to a lower proportion of carbohydrates.
Relative intensity heat maps reveal significant differences in chemical composition in a simple and informative way. However, one limitation of this method of analyzing FT-IR microspectroscopic data is that only differences in chosen molecular groups can be detected. i.e. differences in protein, lipid or carbohydrate levels might be detected but potential differences in the abundances of other classes of molecules will be unnoticed. FT-IR microspectroscopic data actually contain much more information than that required for the construction of simple heat maps; with the appropriate mathematical analysis, this information can reveal other differences between the compositions of 2 samples. Indeed, by unbiased analysis of the entire spectral profiles, it is possible to detect all changes in all bands across the IR spectrum. The most sophisticated data analysis techniques used to analyze FT-IR microspectroscopic data sets require significant mathematical and computer skills.Citation6,22 However, streamlined methods are now available for use by biologists without extensive experience of microspectroscopy or chemometrics, which nevertheless allow powerful analysis of FT-IR microspectroscopic data sets. One such method is “multivariate curve resolution – alternating least squares” (MCR–ALS).Citation23 MCR–ALS decomposes the individual spectra into a series of component spectra. Panels A, C and E in show component spectra identified for 2 worms, one wild-type and the other a daf-2 mutant. The component spectra are not those of pure compounds but the combined spectra of compounds whose abundances vary together in different parts of the sample. Heat maps of the component spectra can be generated in the same way as that for those for predefined classes of compounds. In the heat map shown in panel B, the relative intensity of the component giving rise to the spectrum shown in A is higher in the left half of the lower worm. In contrast, panel F shows that the relative intensity of the component giving rise to the spectrum in E is higher in the right part of the upper worm. The heat map in D shows that the component whose spectrum is shown in C is not strongly localized to either worm. By comparisons with standard spectra, one or more of the component spectra can be associated with a particular class of compound but identification is not required per se for the analysis to be carried out.
Figure 5. MCR-ALS analysis of FT-IR spectra can detect differences in chemical composition between worms. A, C, D show component spectra calculated from the FT-IR data obtained with 2 adjacent worms, one wild type and one a daf-2 mutant. B, D and F show intensity maps of the relative intensities of these spectral components. Note that while components A and E appear to correspond to chemical groups enriched in the lower and upper worms respectively, component C is apparently not assigned to enriched in either worm. G shows the relative contributions of the components A (red), C (green) and E (blue) to the 3 clusters identified by k-means clustering. H shows a segmentation image in which each pixel has been assigned to one of the 3 clusters. The majority of the pixels covering the upper worm are in cluster 3 whereas the majority of those from the lower are in cluster 1. I shows a bright field image of the worms.
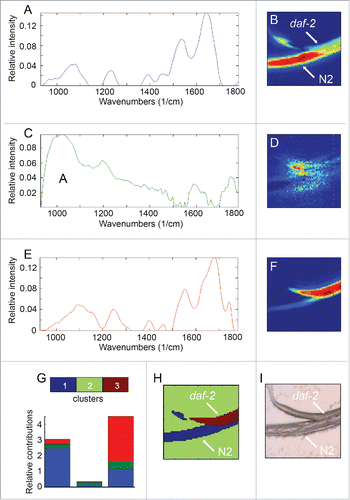
A further level of computational analysis termed segmentation can be used to identify “clusters” of pixels having similar spectral profiles. The numbers of such clusters do not have to be defined by the researcher but can be defined in an unbiased way by algorithms designed specifically for this purpose. One such algorithm uses the mathematical technique of k-means clustering to perform silhouette clustering. The algorithm defines clusters in such a way that within each cluster, the relative intensities of the different component spectra are similar to one another but significantly different from those in all other clusters. This is a so-called hard clustering method meaning that a pixel can belong to one cluster only with no intermediate pixels allowed. shows 3 clusters, 1 (dark blue), 2 (light green) and 3 (dark red) identified for the image shown together with the mean relative intensities of the component spectra in each cluster. shows the segmentation image in which each pixel has been assigned to one of the 3 clusters. The image reveals that the lower part of the lower worm and the tail of the upper worm have a similar chemical composition, which is different from that of the right part of the upper worm. Naturally, both differ from that of the background (in green). It is important to stress that the existence of clusters of pixels in which the chemical composition is significantly different from that in other regions can be determined even if the nature of the difference is not precisely known. The data analysis together with the forms of the component spectra can, therefore, provide stimulus for further investigations aimed at elucidating the nature of the differences.
Discussion
We have presented a powerful, versatile and fast technique to analyze broad changes in chemical composition of C. elegans worms using FT-IR microspectroscopy. The key advantages of this technique are its sensitivity and speed. The method gives information on the entire chemical composition in situ, without the need for stains or dyes. Moreover, the entire chemical composition is monitored simultaneously rather than a single class of compound at a time. This feature, together with the ease with which samples are prepared, makes the technique inexpensive and applicable to large numbers of samples. As with all techniques, drawbacks exist. Most importantly, wet samples are presently difficult to analyze. In addition, the relatively long wavelength of infrared radiation means that resolution in the X-Y plane is limited by diffraction to values between 5–20 µm.Citation17 However, when these limitations are not critical for the analysis, FT-IR microspectroscopy is an efficient and powerful analytical technique. We suggest that it should be added to the toolbox of the C. elegans community to facilitate the use of genetic techniques for the study of metabolic regulation.
Comparison of FT-IR microspectroscopy with Raman microspectroscopic techniques
Two other microspectroscopic techniques have previously been used to study the abundance of particular types of macromolecules in worms. In particular, coherent anti-Stokes Raman scattering (CARS) Citation24,25 and stimulated Raman scattering (SRS) Citation26 have been used to study the distribution of C-H bonds and hence the abundance of lipids. Both are powerful techniques that, in some respects, give information that is complementary to that obtained with FT-IR microspectroscopy. Both CARS and SRS give a high degree of spatial resolution, are not destructive, and require little sample preparation. A significant advantage of CARS and SRS over FT-IR microspectroscopy is that the former 2 techniques can be performed on living worms whereas presently for FT-IR microspectroscopy, the samples must first be dehydrated. While sample preparation for FT-IR microspectroscopy is not at all difficult, there is no doubt that dehydration of C. elegans worms results in significant loss of morphology. Both CARS and SRS rely on light scattering rather than absorption and can be used to generate 3-dimensional images of the distribution of the class of molecule under study. On the other hand, signals in FT-IR spectroscopy are inherently stronger than Raman signals and FT-IR microspectroscopy is generally more sensitive than either CARS or SRS. Furthermore, FT-IR microspectroscopy setups allow for thousands of spectra to be recorded simultaneously and quickly through powerful focal plane array (FPA) detectors.Citation27 While high-speed array detectors exist for Raman setups too, they compromise spatial resolution and sensitivity for speed. Using the FT-IR microspectroscopy setup described in the present article, a 170 μm × 170 μm region can be analyzed with a total of 4096 spectra (obtained simultaneously) in approximately one minute. In contrast, for CARS and SRS to reach their optimum spatial resolution and provide confocality, acquisition typically must be made one pixel at a time, which even with short (1–2s) spectral acquisition times, requires 1–2 hours for each sample. The ability to record each pixel for 60 s (which FT-IR affords) rather than 1–2 s gives better signal to noise ratios Citation28 and consequently reduced detection limits. The ability to record all pixels of the image simultaneously means that multiple scans of the same sample are possible and practical for FT-IR. Another advantage of FT-IR spectroscopy is that the signals are more easily quantified. The quantity measured by FT-IR spectroscopy (the amount of light absorbed) is directly related to the amount of material in the optical path by the Beer-Lambert law.Citation18 For CARS and SRS, which both rely on light scattering, the relationship between the signal measured and the amount of material is far more complex. In addition, CARS signals exhibit non-resonant background that limits detection sensitivity.Citation4 While background problems are significantly less with SRS, quantification remains challenging. A further disadvantage of both the Raman-based techniques is that, in contrast to FT-IR spectroscopy, the presence of fluorescent markers such as GFP can significantly complicate the analysis. Finally, the equipment necessary for FT-IR microspectroscopy is often more readily available than that required for CARS or (in particular) SRS, due to the high costs of instruments that must be custom-built and optimized. Few C. elegans laboratories presently have access to such equipment. Perhaps for these reasons, CARS and SRS have been used to quantify lipids in different C. elegans strains but not to quantify other classes of macromolecules.
MCR-ALS
The use of MCR-ALS in the analysis of data sets has a number of advantages over the use of simple heat maps. MCR-ALS can be used to detect differences in levels of protein, lipids or carbohydrates and is superior to the use of single diagnostic bands since it uses information from the entire spectrum. In certain contexts, the use of single bands for the assessment of proteins levels can be misleading because the amide I band position shifts in the presence of certain interfering groups. MCR-ALS can circumvent such problems since it can detect differences in the relative amounts of classes of compounds whose spectra overlap those of others in a mixture, or whose peak intensities in a cellular context are altered with respect to those in the pure state. In general, more reliable information is achieved by using the full spectral profile, as opposed to individual bands. MCR-ALS is a data analysis technique and does not affect the acquisition of the data. Therefore, it can be invoked if initial data analyses with single band intensities give ambiguous results.
Another clear advantage of the use of MCR-ALS for analyzing FT-IR data sets is that the nature of the potential difference to be investigated is not decided upon in advance. The method is therefore less biased in that it does not rely on preconceptions held by the investigator. MCR-ALS analysis of FT-IR data sets can be used to establish whether or not the chemical compositions of 2 samples are significantly different from one another even if the exact nature of the difference is not known a priori. Besides MCR-ALS, other chemometric analyses exist for analyzing vibrational microspectroscopy data sets including hierarchical cluster analysis (HCA) and principal component analysis (PCA). HCA and PCA have both been used, for example, to distinguish between different cell and tissue types in human skin.Citation29 In these studies, stem cells within the epidermis could be distinguished from other cell types by virtue of their characteristic FT-IR spectra.Citation29 In a study comparing the efficacy of HCA, PCA and MCR-ALS for the analysis of Raman images of endometrial tissue from human patients with endometroid tumors, MCR-ALS provided the best contrast between different histological features and between benign and malignant tissue.Citation30
FT-IR microspectroscopy as a complement to staining techniques
Classically, the abundance of certain metabolites in small tissue samples has been assessed by staining experiments with histological stains or fluorescent dyes.
In C. elegans worms, for example, the abundance of lipids can be studied with the lipophilic dyes Oil Red O Citation31 or Sudan Black,Citation32 or with the fluorescent dye, Nile Red.Citation33 Glycogen stores can be revealed by iodine staining Citation15 or with periodic acid-Schiff staining.Citation34 Such staining techniques, when properly carried out, are undoubtedly informative and will most likely continue to be useful for many years to come. However, it is clear that these techniques are presently not sufficient for comprehensive metabolic analyses. Caveats exist for most if not all staining techniques. In particular, few stains or dyes exist that are entirely specific. It is known, for example, that Nile Red can bind with low affinity to hydrophobic regions within certain proteins.Citation35 Another problem associated with the use of histological stains or fluorescent dyes is that the type of fixation needed for staining with one dye is often incompatible with that required for other stains or dyes. This limitation precludes the simultaneous investigation of multiple compounds in the same sample. For these reasons, FT-IR microspectroscopy, which does allow several classes of macromolecule to be assessed simultaneously, is likely to become a useful complement to staining techniques.
Potential improvements
While we have found that it is possible to carry out FT-IR microspectroscopy on whole larval worms, the signals from adult worms (which are 50 µm or more in diameter) are often saturated, precluding direct analysis of such worms by this technique in transmission mode. However, as we have shown here, tissue dissected from adult worms can be analyzed. Unfortunately, few tissues in C. elegans can be easily dissected away from the rest of the worm. One possible modification that would allow the analysis of a greater proportion of adult worms in transmission mode would be to analyze thin sections. Alternatively, attenuated total reflectance (ATR) mode FT-IR microspectroscopy could be employed, which is a surface sensitive technique.Citation5 In this technique, the infrared light does not have to pass through the entire sample. For C. elegans, it could, in principle, be used to obtain information about chemical composition of regions within a couple of micrometers from the surface but not from the entire worm.
In addition to the thickness limitations, dehydration of samples prior to analysis by FT-IR microspectroscopy may cause problems by inducing significant changes in morphology. Strictly speaking, dehydration is not required by the technique itself, but it is considered beneficial, since water strongly absorbs infrared light and thereby produces intensive bands in the spectrum. One of those bands is located around 1600–1650 cm−1 and overlaps significantly with the amide I band. Thus, quantitative and qualitative analysis of proteins is very difficult in wet samples when normal water is used. A possible way of avoiding this problem would be to prepare samples in D2O, which results in a shift of the 1600 cm−1 water band to ca. 1200 cm−1. The ability to study wet worms, which have normal morphology, would make it easier to correlate chemical compositional changes to specific tissues.
Even without these potential improvements and adaptations, our studies have shown that simple transmission FT-IR microspectroscopy can be applied to C. elegans to gain valuable information about chemical composition rapidly, easily and cost-effectively. We believe, therefore, that FT-IR represents a valuable addition to the arsenal of experimental tools available to the C. elegans community.
Materials and methods
Strains
C. elegans strains were cultured on E. coli OP50 bacteria and manipulated as described.Citation36 Unless otherwise noted, all strains were cultured at 20°C. C.elegans Bristol N2 Citation36 was used as wild-type strain. The following mutant strains were also used: LG I: VB2485, aex-5(sv75) Citation37; LG III: CB1370, daf-2(e1370) Citation38; VB0027, ncl-1(e1865).Citation20
Preparation of worms for FT-IR imaging
Hermaphrodite worms of the appropriate genotype were washed in M9 put onto IR-transparent transparent polished rectangular CaF2 slides (75 × 25 × 1 mm; Crystran Ltd.) and dried in a desiccator for at least 48 hours.
FT-IR microspectroscopy
Spectra were recorded with a Bruker Tensor 27 spectrometer equipped with a Hyperion 3000 microscopy accessory (Bruker Optik GmbH) using a liquid nitrogen–cooled focal plane array (FPA) detector and a Sony Exwave HAD color digital video camera for positioning and white light snapshots. The sample tray was boxed, and the chamber was continuously purged with dry air. Spectra were recorded in transmission mode over the range from 900 to 4000 cm−1 with a spectral resolution of 4 cm−1. For each spectrum, 32 interferograms were summed (co-added) to improve the signal to noise ratio. Prior to sample measurements, background spectra were recorded at a nearby empty spot on the CaF2 carrier window, using the same setup.
Data processing for the generation of heat maps
At least 3 images were recorded per strain and treatment, each containing different individual worms. Spectral pre-treatment included automatic 64-point rubber band baseline correction (excluding CO2 bands) and vector normalization over the entire spectral range (normalization 1) or over the –C–O vibration band between 1177–1277 cm−1 (normalization 2), to eliminate possible errors due to saturation of the amide I band. Since both normalization methods provided the same results, normalization 1 was considered to be generally more applicable and was therefore adopted for the present paper. The normalization procedure applied in this study enables the relative amount of a particular macromolecule in different pixels (in the same or different samples) to be compared but also means that the signals cannot be used to generate absolute measurements of particular types of molecule (e.g., in terms of mg/ml, or mg/mg dry weight, etc).
Pre-treatment of the data was carried out using OPUS (version 7.0, Bruker Optik Gmbh). Heat maps and quantification was based on the evaluation of band area by the built-in B type integration method of OPUS (version 7.0, Bruker Optik Gmbh). The bands at 2800–3000 cm−1 were used to calculate relative lipid levels, the bands at 1584–1718 cm−1 (amide I) and 1484–1583 cm−1 (amide II) were used to calculate relative protein levels. The band area between 1020–1130 cm−1 was used to represent carbohydrates, and the band area between 1140–1180 cm−1 was used to map the –C–O–C– band intensity. Due to the inflexibility of OPUS in scaling heat maps of independent hyperspectral images, integral area maps were re-plotted using Matlab (version R2013a, Mathworks Inc.) to ensure identical scales.
MCR-ALS
Essentially, MCR-ALS decomposes the complex spectra in each pixel of the image into a set of “pure” spectral contributions. “Pure” in this case does not necessarily mean a pure chemical compound, but a component that is not resolved further into its more basic building blocks. The spectral profiles of these “pure” components are calculated (S matrix) together with the relative contributions of each pure component to each pixel of the image (C matrix). So in mathematical terms, the entire hyperspectral data set (D matrix) can be described as: D = C × ST + E, where E is the residual error (noise). MCR-ALS iteratively optimizes the S and C matrices in an alternating fashion to provide the best description of D while minimizing the contribution of E. The resulting S matrix can be used to assign a pure component to a chemical compound or match the pure component spectrum to reference spectra. The C matrix can be used to generate maps of component distribution. The C matrix can also be used as input for k-means clustering to obtain (i) segmentation maps, where regions of the image are colored according to their overall chemical similarity, and (ii) centroid profiles, which describe the relative contribution of each pure component to a certain segment of the image. The procedures used here for MCR-ALS and k-means clustering are described in detail elsewhere.Citation23
Abbreviations
| FT-IR | = | Fourier transform infrared |
| CARS | = | coherent anti-Stokes Raman scattering |
| SRS | = | stimulated Raman scattering |
| NMR | = | nuclear magnetic resonance |
| MALDI-TOF | = | matrix assisted laser desorption ionization-time-of-flight |
| L4 | = | Fourth larval stage |
| FPA | = | focal plane array |
| MCR-ALS | = | multivariate curve resolution – alternating least squares |
| ATR | = | attenuated total reflectance. |
Disclosure of potential conflicts of interest
No potential conflicts of interest were disclosed.
KWRM_A_Supp_1132978.zip
Download Zip (599.2 KB)Acknowledgments
We thank Lars Nilsson, Gautam Kao and Ola Billing for discussions.
Funding
Some strains were provided by the CGC, which is funded by NIH Office of Research Infrastructure Programs (P40 OD010440). The research was supported by project grants from The Swedish Cancer Society (12 0534) and The Swedish Research Council (K2012-67X-20441-063).
References
- Rehman IuM Z, Rehman S. Vibrational Spectroscopy for Tissue Analysis. Boca Raton: CRC Press, Taylor & Francis group, 2013.
- Grahn HF, Geladi, P. Techniques and Applications of Hyperspectral Image Analysis. The Atrium, Southern Gate, Chichester, West Sussex, PO19 8SQ, England: John Wiley & Sons, 2007.
- Evans CL, Xie XS. Coherent anti-stokes Raman scattering microscopy: chemical imaging for biology and medicine. Annu Rev Anal Chem (Palo Alto Calif) 2008; 1:883-909; PMID:20636101; http://dx.doi.org/10.1146/annurev.anchem.1.031207.112754
- Freudiger CW, Min W, Saar BG, Lu S, Holtom GR, He C, Tsai JC, Kang JX, Xie XS. Label-free biomedical imaging with high sensitivity by stimulated Raman scattering microscopy. Science 2008; 322:1857-61; PMID:19095943; http://dx.doi.org/10.1126/science.1165758
- Baker MJ, Trevisan J, Bassan P, Bhargava R, Butler HJ, Dorling KM, Fielden PR, Fogarty SW, Fullwood NJ, Heys KA, et al. Using Fourier transform IR spectroscopy to analyze biological materials. Nat Protocols 2014; 9:1771-91; PMID:24992094; http://dx.doi.org/10.1038/nprot.2014.110
- Stenlund H, Gorzsas A, Persson P, Sundberg B, Trygg J. Orthogonal projections to latent structures discriminant analysis modeling on in situ FT-IR spectral imaging of liver tissue for identifying sources of variability. Analytical Chemistry 2008; 80:6898-906; PMID:18714965; http://dx.doi.org/10.1021/ac8005318
- Chervitz SA, Aravind L, Sherlock G, Ball CA, Koonin EV, Dwight SS, Harris MA, Dolinski K, Mohr S, Smith T, et al. Comparison of the complete protein sets of worm and yeast: orthology and divergence. Science 1998; 282:2022-8; PMID:9851918; http://dx.doi.org/10.1126/science.282.5396.2022
- Adams MD, Celniker SE, Holt RA, Evans CA, Gocayne JD, Amanatides PG, Scherer SE, Li PW, Hoskins RA, Galle RF, et al. The genome sequence of Drosophila melanogaster. Science 2000; 287:2185-95; PMID:10731132; http://dx.doi.org/10.1126/science.287.5461.2185
- Shaye DD, Greenwald I. OrthoList: a compendium of C. elegans genes with human orthologs. PLoS One 2011; 6:e20085; PMID:21647448; http://dx.doi.org/10.1371/journal.pone.0020085
- Swire J, Fuchs S, Bundy JG, Leroi AM. The cellular geometry of growth drives the amino acid economy of Caenorhabditis elegans. Proc Biol Sci 2009; 276:2747-54; PMID:19439436; http://dx.doi.org/10.1098/rspb.2009.0354
- Husson SJ, Clynen E, Baggerman G, Janssen T, Schoofs L. Defective processing of neuropeptide precursors in Caenorhabditis elegans lacking proprotein convertase 2 (KPC-2/EGL-3): mutant analysis by mass spectrometry. J Neurochem 2006; 98:1999-2012; PMID:16945111; http://dx.doi.org/10.1111/j.1471-4159.2006.04014.x
- Ashrafi K, Chang FY, Watts JL, Fraser AG, Kamath RS, Ahringer J, Ruvkun G. Genome-wide RNAi analysis of Caenorhabditis elegans fat regulatory genes. Nature 2003; 421:268-72; PMID:12529643; http://dx.doi.org/10.1038/nature01279
- Lee KZ, Kniazeva M, Han M, Pujol N, Ewbank JJ. The fatty acid synthase fasn-1 acts upstream of WNK and Ste20/GCK-VI kinases to modulate antimicrobial peptide expression in C. elegans epidermis. Virulence 2010; 1:113-22; PMID:21178429; http://dx.doi.org/10.4161/viru.1.3.10974
- Long X, Spycher C, Han ZS, Rose AM, Muller F, Avruch J. TOR deficiency in C. elegans causes developmental arrest and intestinal atrophy by inhibition of mRNA translation. Curr Biol 2002; 12:1448-61; PMID:12225660; http://dx.doi.org/10.1016/S0960-9822(02)01091-6
- Frazier HN, 3rd, Roth MB. Adaptive sugar provisioning controls survival of C. elegans embryos in adverse environments. Curr Biol 2009; 19:859-63; PMID:19398339; http://dx.doi.org/10.1016/j.cub.2009.03.066
- Steele D. Infrared Spectroscopy: Theory. In: Chalmers JMG, P. R., ed. Handbook of Vibrational Spectroscopy. Chichester: John Wiley & Sons, 2001.
- Lasch P, Naumann D. Spatial resolution in infrared microspectroscopic imaging of tissues. Biochim Biophys Acta 2006; 1758:814-29; PMID:16875659; http://dx.doi.org/10.1016/j.bbamem.2006.06.008
- Griffiths PR. Beer's Law. In: Chalmers JMG, P. R., ed. Handbook of Vibrational Spectroscopy. Chichester: John Wiley & Sons, 2001:2225-34.
- Ami D, Natalello A, Zullini A, Doglia SM. Fourier transform infrared microspectroscopy as a new tool for nematode studies. FEBS Lett 2004; 576:297-300; PMID:15498551; http://dx.doi.org/10.1016/j.febslet.2004.09.022
- Frank DJ, Roth MB. ncl-1 is required for the regulation of cell size and ribosomal RNA synthesis in Caenorhabditis elegans. J Cell Biol 1998; 140:1321-9; PMID:9508766; http://dx.doi.org/10.1083/jcb.140.6.1321
- Gems D, Sutton AJ, Sundermeyer ML, Albert PS, King KV, Edgley ML, Larsen PL, Riddle DL. Two pleiotropic classes of daf-2 mutation affect larval arrest, adult behavior, reproduction and longevity in Caenorhabditis elegans. Genetics 1998; 150:129-55; PMID:9725835
- Gorzsas A, Stenlund H, Persson P, Trygg J, Sundberg B. Cell-specific chemotyping and multivariate imaging by combined FT-IR microspectroscopy and orthogonal projections to latent structures (OPLS) analysis reveals the chemical landscape of secondary xylem. Plant Journal 2011; 66:903-14; PMID:21332846; http://dx.doi.org/10.1111/j.1365-313X.2011.04542.x
- Felten J, Hall H, Jaumot J, Tauler R, de Juan A, Gorzsas A. Vibrational spectroscopic image analysis of biological material using multivariate curve resolution-alternating least squares (MCR-ALS). Nat Protoc 2015; 10:217-40; PMID:25569330; http://dx.doi.org/10.1038/nprot.2015.008
- Hellerer T, Axang C, Brackmann C, Hillertz P, Pilon M, Enejder A. Monitoring of lipid storage in Caenorhabditis elegans using coherent anti-Stokes Raman scattering (CARS) microscopy. Proc Natl Acad Sci U S A 2007; 104:14658-63; PMID:17804796; http://dx.doi.org/10.1073/pnas.0703594104
- Wang P, Liu B, Zhang D, Belew MY, Tissenbaum HA, Cheng JX. Imaging lipid metabolism in live Caenorhabditis elegans using fingerprint vibrations. Angew Chem Int Ed Engl 2014; 53:11787-92; PMID:25195517; http://dx.doi.org/10.1002/anie.201406029
- Wang MC, Min W, Freudiger CW, Ruvkun G, Xie XS. RNAi screening for fat regulatory genes with SRS microscopy. Nat Methods 2011; 8:135-8; PMID:21240281; http://dx.doi.org/10.1038/nmeth.1556
- Kidder LH, Levin IW, Lewis EN, Kleiman VD, Heilweil EJ. Mercury cadmium telluride focal-plane array detection for mid-infrared Fourier-transform spectroscopic imaging. Opt Lett 1997; 22:742-4; PMID:18185647; http://dx.doi.org/10.1364/OL.22.000742
- Fellgett PB. On the ultimate sensitivity and practical performance of radiation detectors. J Opt Soc Am 1949; 39:970-6; PMID:15407059; http://dx.doi.org/10.1364/JOSA.39.000970
- Patel, II, Harrison WJ, Kerns JG, Filik J, Wehbe K, Carmichael PL, Scott AD, Philpott MP, Frogley MD, Cinque G, et al. Isolating stem cells in the inter-follicular epidermis employing synchrotron radiation-based Fourier-transform infrared microspectroscopy and focal plane array imaging. Anal Bioanal Chem 2012; 404:1745-58; PMID:22945554; http://dx.doi.org/10.1007/s00216-012-6314-y
- Patel, II, Trevisan J, Evans G, Llabjani V, Martin-Hirsch PL, Stringfellow HF, Martin FL. High contrast images of uterine tissue derived using Raman microspectroscopy with the empty modelling approach of multivariate curve resolution-alternating least squares. Analyst 2011; 136:4950-9; PMID:21987108; http://dx.doi.org/10.1039/c1an15717e
- O'Rourke EJ, Soukas AA, Carr CE, Ruvkun G. C. elegans major fats are stored in vesicles distinct from lysosome-related organelles. Cell Metab 2009; 10:430-5; PMID:19883620; http://dx.doi.org/10.1016/j.cmet.2009.10.002
- Ogg S, Paradis S, Gottlieb S, Patterson GI, Lee L, Tissenbaum HA, Ruvkun G. The Fork head transcription factor DAF-16 transduces insulin-like metabolic and longevity signals in C. elegans. Nature 1997; 389:994-9; PMID:9353126; http://dx.doi.org/10.1038/40194
- Brooks KK, Liang B, Watts JL. The influence of bacterial diet on fat storage in C. elegans. PLoS One 2009; 4:e7545; PMID:19844570; http://dx.doi.org/10.1371/journal.pone.0007545
- Hench J, Bratic Hench I, Pujol C, Ipsen S, Brodesser S, Mourier A, Tolnay M, Frank S, Trifunovic A. A tissue-specific approach to the analysis of metabolic changes in Caenorhabditis elegans. PLoS One 2011; 6:e28417; PMID:22162770; http://dx.doi.org/10.1371/journal.pone.0028417
- Sackett DL, Wolff J. Nile red as a polarity-sensitive fluorescent probe of hydrophobic protein surfaces. Anal Biochem 1987; 167:228-34; PMID:3442318; http://dx.doi.org/10.1016/0003-2697(87)90157-6
- Brenner S. The genetics of Caenorhabditis elegans. Genetics 1974; 77:71-94; PMID:4366476
- Sheng M, Hosseinzadeh A, Muralidharan SV, Gaur R, Selstam E, Tuck S. Aberrant fat metabolism in Caenorhabditis elegans mutants with defects in the defecation motor program. PLoS One 2015; 10:e0124515; PMID:25849533; http://dx.doi.org/10.1371/journal.pone.0124515
- Swanson MM, Riddle DL. Critical periods in the development of the Caenorhabditis elegans dauer larva. Dev Biol 1981; 84:27-40; PMID:7250500; http://dx.doi.org/10.1016/0012-1606(81)90367-5