
Abstract
In this paper, chaotic analysis of the human brain cortical model is presented. Based on these analysis, controlling of epileptic seizures, using a robust control method is considered. To this end we have utilized the mathematical model of cortical tissue activity. Chaotic behavior of this model is investigated through variations of pathological parameters. Utilization of two chaotic criteria known as entropy and largest Lyapunov exponents allowed us to monitor the chaotic behavior of the model during the reasearch. Moreover, both conniption and ending time of seizures are determined using chaotic analysis. The sliding mode method is used to design a robust controller with the purpose of controlling the seizures. The effectivness of the proposed method is shown via analysis and simulation results. Previous approches on controlling seazires did not considered robustness against the uncertainties. This problem is addressd here through designing a controller which is robust against system uncertainties. In addition to the guaranted finite time control of the seizures, consideration of the practical medical limitations for the control signal is another advantage of the proposed method.
1. Introduction
Epilepsy is a common disorder that is characterized by recurrent and unprovoked seizure-like activities. These epileptic seizures have destructive effects on everyday life of those who suffer this disease. These devastating effects could be much more important and dangerous when the patient is in special positions of everyday life like driving or climbing. Almost 50 million people all over the world suffer from this disease (Lopour & Szeri, Citation2010). Medication and other treatments can be very useful for many patients, and about 70% of patients respond to the various treatments so that their seizures could be controlled. Unfortunately, the remaining 30% do not respond to treatment and are inevitably forced to choose other alternatives like surgery (Lopour & Szeri, Citation2010). The surgical procedure is complex and might involve after effects and disarranges a special part of the patient's cortex such as speech and memory. As this process does not guarantee the success, the control engineering approaches are being considered by researchers. Totally, the mathematical investigations on seizures can be seen in two categories: (1) researches that focus on investigating the chaotic behavior of the human brain (Dafilis, Bourke, Liley, & Cadusch,Citation2002; Dafilis, Liley, & Cadusch, Citation2001; Kramer, Lopour,Kirsch, & Szeri, 2006), (2) researches that focus on control algorithms (Chakravarthy, Sabesan, Tsakalis, & Iasemidis,Citation2009; Colpan, Li, Dwyer, & Mogul, Citation2007; Gluckman,Nguyen, Weinstein, & Schiff, 2001; Kramer, Lopour, et al.,2006; Lopour & Szeri, Citation2010). The first approach investigates the chaotic behavior of the human cortex based on chaotic analysis of the human cortical model (CM). In the second approach, the various control algorithms are presented to control and suppress epileptic seizures. All of these control approaches suffer from a common problem. They are not robust against variations of pathological parameters. Any change in pathological state of the patient results in ineffective control system and thus changing the control systems characteristics is inevitable. For example, the presented method by Kramer, Lopour, et al. (2006) which is highly regarded by researchers uses a supervisory on/off controller. When the patient is in the normal state (seizure free), the feedback controller is turned off and when the patient is in the epileptic state the controller is turned on. In this paper, we have dealt with this issue by applying the robust sliding mode controller which is able to control the patient's condition without changing the controller parameters in different states. We utilized the mathematical model of human brain cortex and the CM, which has been used by previous researchers (Liley, Cadusch, &Wright, 1999).
The rest of the paper is organized as follows: The brain CM and the behavior of pathological parameters in this model are provided in Section 2. Section 3 provides the analysis of the model's chaotic behavior and its adaption to chaotic behavior of the human brain. Largest Lyapunov exponents (LLE) and Entropy (En) criteria are utilized in this section. Section 4 is dedicated to the design of the robust sliding mode controller. Finally, simulation results and conclusions are presented in Sections 5 and 6, respectively.
2. Electrical CM of human cortex
To investigate the chaotic behavior of the human brain cortex and propose a suitable control approach, the human cortex activity needs to be expressed using mathematical models. The presented CM which represents the electrical activity of the human cortex in different states includes a set of stochastic partial differential equations (SPDEs) that has been developed and accommodated in recent decades (Bojak & Liley, Citation2005; Liley, Cadusch, &Dafilis, 2002; Liley et al., Citation1999). Considering stochastic and nonlinear behavior of this model, which is suitable for investigating the applications based on Electroencephalography (EEG) such as epilepsy (Kramer,Kirsch, & Szeri, 2005; Kramer, Lopour, et al., 2006; Kramer, Szeri, Sleigh, & Kirsch, Citation2006; Lopour & Szeri,Citation2010), sleep (Lopour, Tasoglu, Kirsch, Sleigh, & Szeri,Citation2011; Wilson et al., Citation2006), and anaesthesia (Bojak & Liley,Citation2005; Bojak, Liley, Cadusch, & Cheng, Citation2004; Steyn-Ross,Steyn-Ross, & Sleigh, 2004; Steyn-Ross, Steyn-Ross, Sleigh, & Whiting, Citation2003). The CM provided in Lileyet al. (1999) and Steyn-Ross et al. (Citation2003) is represented by the following SPDEs:
The subscripts e and i denote excitatory and inhibitory neuron populations, respectively. In this manner, the variable he is the excitatory mean soma potential for a neuronal population and hi is the inhibitory one. The variable Iee is the postsynaptic activation of the excitatory population due to inputs from the excitatory population, the variable Iei is the postsynaptic activation of the inhibitory population due to inputs from the excitatory population, the variable Iie is the postsynaptic activation of the excitatory population due to inputs from the inhibitory population, and the variable Iii is the postsynaptic activation of the inhibitory population due to inputs from the inhibitory population. Finally, the variables φe and φi are corticocortical inputs to excitatory and inhibitory populations, respectively. The Γi terms employed in Equations (3–6) are stochastic inputs. In this paper, it is assumed that the implanted electrodes are fixed at their position so spatial derivatives are vanished in Equations (7) and (8). The second-order terms (Equations (3)–(8)) can be converted into the first-order equations and a simpler system of 14 first-order ordinary differential equations (ODEs) is yielded as follows (Kramer, Lopour, et al., 2006):
A complete description of model state variables and parameters are provided in and , respectively.
Table 1. State variables of the ODE electrical CM.
Table 2. Parameters of the ODE electrical CM.
2.1 Numerical values for state changes
Some of the previous papers in the literature have been converted from the present dimensional form of the CM into the dimensionless form (Kramer, Lopour, et al., 2006; Kramer, Szeri, et al., 2006; Lopour & Szeri, Citation2010). This transition between the normal and epileptic states occurs based on the changes in two parameters; Pee and Γe. These parameters are known as pathological parameters (Kramer,Lopour, et al., 2006; Lopour & Szeri, Citation2010). Numerical values for these parameters are provided in papers which have been utilized as the dimensionless form of the CM. So the corresponding values in the dimensional form of the model must be calculated. Definition of the Pee and Γe in the dimensionless form of the model are as follows:
According to Kramer, Lopour, et al. (2006) and Lopourand Szeri (2010), typical values for these two pathological parameters in normal and epileptic states are as in the following; the normal state has occurred when Pee=11 and , and hyperexcited “epileptic” state occurs when Pee=548 and
. Thus, corresponding values for these two typical values in the dimensional CM are:
and
for normal state, and
and
for the epileptic state which are calculated using Equations (28) and (29).
3. Chaotic behavior of the model
Analysis of transition between the epileptic and normal states plays an important role in designing an effective controller with good performance. In previous researches such as Kramer, Lopour, et al. (2006) and Lopour and Szeri(Citation2010), examination of the designed controller was just performed for typical values of pathological parameters. However, the present paper considers the variation of pathological parameters in different states. Moreover, based on variations of the pathological parameters, we have investigated the occurrence of the transition between the different states.
A physiological aspect of the normal state is having a lower level of excitation in mean soma voltage of excitatory neuron population (he), which is similar to a damping behavior. While in the epileptic state, we have hyperexciting large amplitude oscillations in the he signal. and illustrate typical behavior of the normal and epileptic states, respectively.
Figure 1. Normal state of mean soma potential of excitatory neuron population (he).
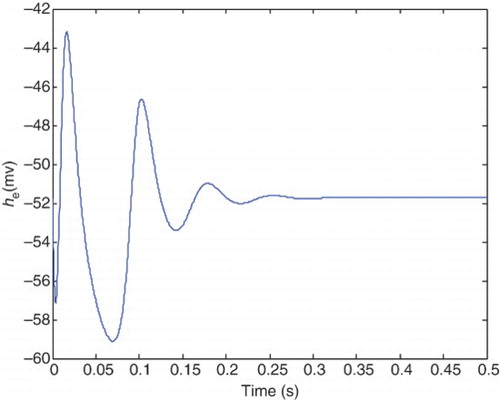
Figure 2. Epileptic state of he.
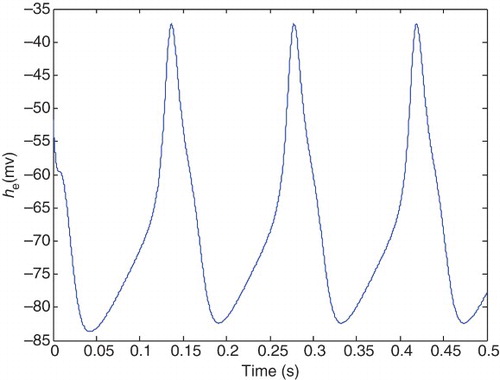
Transition from a healthy to the epileptic state results in increased amplitude and more periodic waveform of the he. Based on the CM, transition between the states occurs through changing two pathological parameters which are pee and Ge. illustrates he in the case of typical healthy values for pathological parameters, and
. Transition from the epileptic to a healthy state occurs while pee increases and Ge decreases (Kramer, Lopour, et al., 2006; Lopour & Szeri,Citation2010). Required percentage of change in pee is much greater than Ge. Moreover, from the physiological aspect, the increased rate of pee is more allowable than the decrease rate of Ge (Kramer, Lopour, et al., 2006). Increasing pee and simultaneously decreasing Ge results in the transition from the normal to the epileptic state. However, continuous increase in pee and decrease in Ge, will eventually cause the brain's dynamics to go back to the healthy state. These transitions will be proved through analyzing chaotic behavior of the CM. This is done by utilizing two chaotic criteria which adopts the model to the chaotic behavior of the human brain.
According to physiological aspects of normal brain activity, the neuronal activities show less organized behavior and greater chaos. On the contrary, during the epileptic state, the behavior of the neuronal population becomes much more organized and the amount of disorder is very small. Adeli, Ghosh-Dastidar, and Dadmehr (Citation2007), Ghosh-Dastidar, Adeli, and Dadmehr (Citation2007), Mirzaei,Ayatollahi, and Vavadi (2011), Vavadi, Ayatollahi, andMirzaei (2010). In this research, we have utilized two chaotic criteria; The LLE (Adeli et al., Citation2007; Ghosh-Dastidar et al., Citation2007) and Entropy (En; Mirzaei et al.,Citation2011; Vavadi et al., Citation2010) to investigate chaotic behavior of the CM. The subsequent subsections are devoted to these chaotic criteria.
3.1 Analysis of LLEs
For the system to be chaotic, at least one of its Lyapunov exponents should be positive, i.e. the LLE has to be greater than zero (Adeli et al., Citation2007). Thus, it can be concluded that the measure of LLE in healthy subjects is greater than in epileptic subjects (Adeli et al.,Citation2007; Ghosh-Dastidar et al., Citation2007). The LLE measures of the he signal for different values of pathological parameters are calculated and presented in for the following intervals: and
. It should be noted that the CM for
and
is in the healthy state.
Table 3. LLE measures of the he dynamic variable of the CM for different values of pathological parameters.
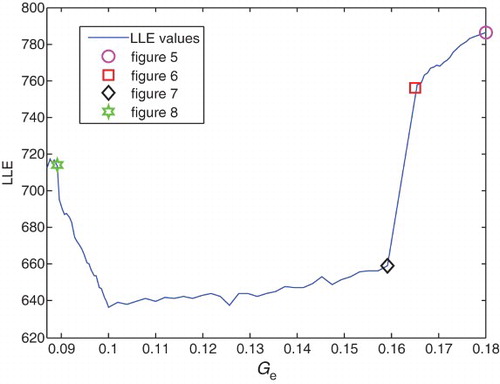
Variations of LLE values versus pee and Ge in this process are illustrated in and , respectively. It is clear from and that the measure of the LLE decreases with a slow rate from ) and
to
) and
, while the he signal shows normal cortical behavior. Themeasure of LLE values show an extreme reduction from
and
, resulting in seizure-like events. By decreasing LLE values, the amplitude of the he signal increases and shows more fluctuations thus becoming more periodic.
Figure 3. Variation of LLE versus pee values.
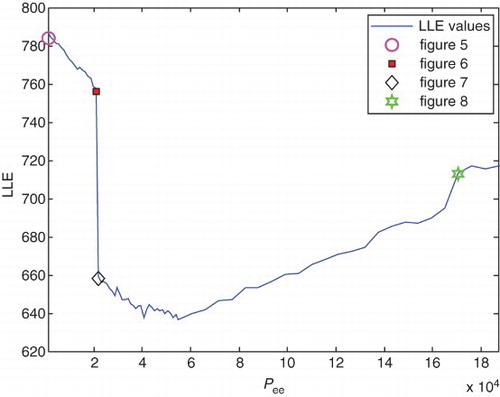
Figure 4. The variation of LLE versus Ge values.
– show the behavior of the he signal in this range. and show the results for ) and
and for
) and
respectively. In this case pee has higher value and Ge a lower value compared with the case in , and it seems that the amplitude of he has increased and its oscillations commence. illustrates the he for
) and
.
Figure 5. Typical normal state with pee=1100(s −1) and Ge=0.18 (mV).
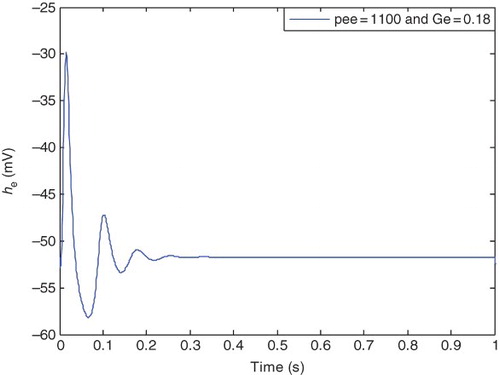
Figure 6. Prior to epileptic state, with pee=21, 000 (s−1) and Ge=0.162 (mV).
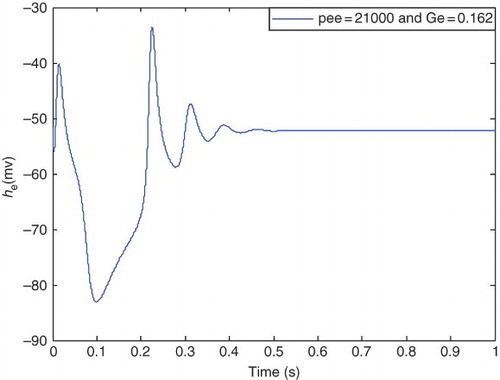
Figure 7. Typical epileptic state, with pee=22, 000 (s−1) and Ge=0.159 (mV).
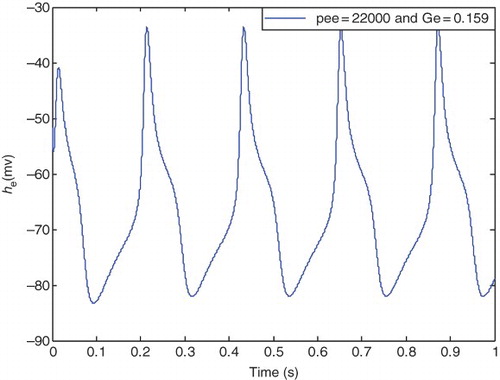
It is clear from that hyperexcited oscillations emerge in these pathological parameters, and seizure-like events occur. In this case, he is periodic with a larger amplitude (as in epileptic state) compared with the healthy state.
In the range and
to
) and
, reduction of the LLE values continues. Nearly from
) and
to
) and
, a slight increase in LLE values are observable, and approximately from
) and
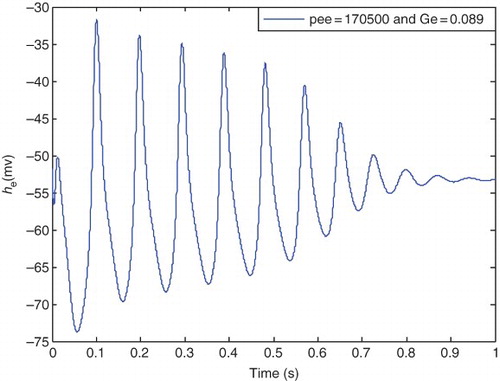
, the transition from epileptic to a healthy state is being started. illustrates the behavior of the he for
) and
. It is clear that the amplitude and fluctuations of the signal he are decreasing. This shows the finishing point of parameters for the epileptic state that occurs in
) and
where he exits from the periodic form. Thus, the transition to the normal state commences.
Figure 8. he with pee=170, 500 (s−1) and Ge=0.089 (mV).
As explained above, due to chaotic behavior of brain dynamics, the measures of LLE in healthy subjects are greater than in epileptic ones (Adeli et al., Citation2007; Ghosh-Dastidar et al., Citation2007). Calculated measures of the LLE for different values of pathological parameters, pee and Ge in different states confirm this behavior of brain dynamics. From the values illustrated in , it can be concluded that by increasing pee and decreasing Ge, and consequently decreasing LLE values, the patient's state is going to be epileptic, and its symptoms appear. These epileptic seizures continue until the pathological parameters reach and
. By completely finishing epileptic seizures, pee starts to decrease and Ge to increase and consequently LLE measures will increase. Thus, the patient would be back to the normal state.
3.2 Analysis of the entropy
The second chaotic criterion that is investigated is entropy. The concept of entropy in information theory was first introduced by Shannon (Mirzaei et al., Citation2011; Vavadi et al., Citation2010). It is a criterion of information theory that concludes the condition of regularity or irregularity. Moreover, Entropy (En) is considered as a chaotic criterion in researches. The definition of Entropy is expressed in terms of a discrete set of probabilities pi. Assume that X is a set of discrete samples , then the Entropy measure of this set is defined as follows:
Table 4. En measures of he state variable of the model for different values of pathological parameters.
Variations of the En with respect to pee and Ge in this process are shown in and , respectively.
Figure 9. The variation of En values versus pee in this process.
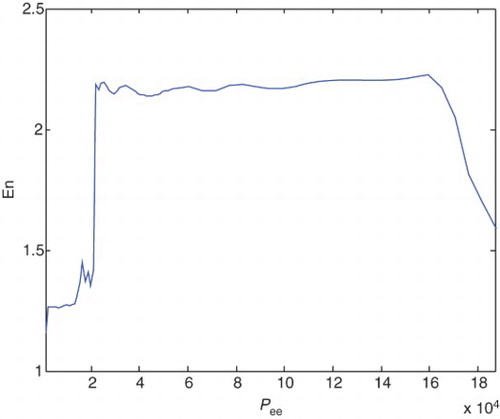
Figure 10. The variation of En values versus Ge in this process.
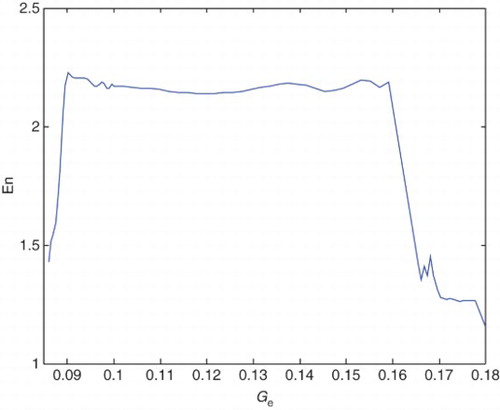
illustrates the variation of En values with respect to the variation of pee. Increase and decrease of the En values in different states of the patient and increaseaing value of pee, is clear in this figure. Also illustrates the variation of En with respect to the variation of Ge. Increase and decrease of the En values in different states of the patient and increaseaing value of Ge, is clear in this figure.
As explained above, from a physiological point of view, the measure of En in healthy subjects is lower than in epileptic ones, and due to chaotic behavior of brain dynamics, the he signal in healthy states would be less regular compared with epileptic ones (Mirzaei et al., Citation2011; Vavadi et al.,Citation2010). The calculated measures of En for different values of pathological parameters, pee and Ge in different states confirm this behavior of brain dynamics.
From the values that are compiled in , it can be concluded that by increasing pee and decreasing Ge results in increasing value of En, the he signal would be more regular, and the patient would transfer from a healthy to epileptic state and experiences the seizure-like events. These epileptic seizures continue until the pathological parameters reach approximately ) and
. By this time, the epileptic state completely passes and
value starts to decrease and Ge value increases which results in decreasing value of En measures. Thus, regularity of he would be reduced and the patient state would be back to the normal form.
It is shown that the two chaotic analyses are representing the same results. The mentioned values will be used in simulations presented in the next section where we will provide the controller.
4. Sliding mode controller
In previous researches, various controllers have been presented by researchers to suppress and control epileptic seizures based on the CM (Dafilis et al., Citation2001, Citation2002; Kramer, Lopour, et al., 2006; Lopour & Szeri, Citation2010). However, the proposed algorithms are not robust against variations of pathological parameters. For example in Dafiliset al. (2002), while the system is in the healthy state, the feedback controller is turned off, and when the system is transferred to the epileptic state, the controller is turned on. So a supervisory controller is needed to discover the epileptic state and to turn the main controller on and off. The controller presented here uses a robust algorithm based on the sliding mode control (SMC) method which is able to suppress and control the seizure-like events in all states despite the changes in pathological parameter values (pee, Ge).
The aim of current research is to halt epileptic seizures and make the controller to be robust against variations of pathological parameters. Here variations of pathological parameters, pee and Ge are considered as system uncertainties. As explained in Section 3, our focus is on suppressing and controlling hyperexcited oscillations of the he known as epileptic seizures. Hence he is the output of interest and the control signal uSMC will be applied to the first equation of the CM (Equation (9)) as follows:
The second term in Equation (39), ueq guarantees that states are remaining on the sliding surface. This term will be introduced in the following theorem. For the uncertain system (36) where it is assumed that the variations are bounded by M
Proof Consider the following Lyapunov function candidate:
Now we will prove that the error signal vanishes in finite time given by Equation (46). From Equation (52) we have the following:
5. Simulation results
In this section, the applicability and performance of the provided control algorithm is verified via simulation. Different states of the patient are considered using different pathological parameters in order to show the ability of the SM controller in controlling epileptic seizures. The error signal of the system and applied control signal are also presented. Finally, the proposed SM controller is compared with the previously presented control methods. As mentioned before the pathological parameters in the CM (Equations (9)–(22)) determine the state of the patient. Numerical values used in simulations are given in .
Table 5. Numerical values used in simulations.
The healthy state is plotted in . shows three different cases: pre-epileptic state with and without control and the healthy state. It is clear that the pre-epileptic state with the application of the SM controller tracks the healthy state with acceptable accuracy. Comparison between the pre-epileptic state with and without applying the SM controller shows that the controller successfully controls epileptic seizures. shows the healthy and epileptic state with and without applying the control signal. It is clear from this figure that the epileptic state with the applied SM tracks the healthy state with acceptable accuracy and consequently epileptic seizures are controlled. It should be noted that a single controller is applied for different states of patient and there is no need to change the controller characteristics similar to previous researches.
Figure 11. A typical healthy state for pee=5500 (s−1) and Ge=0.175 (mV).
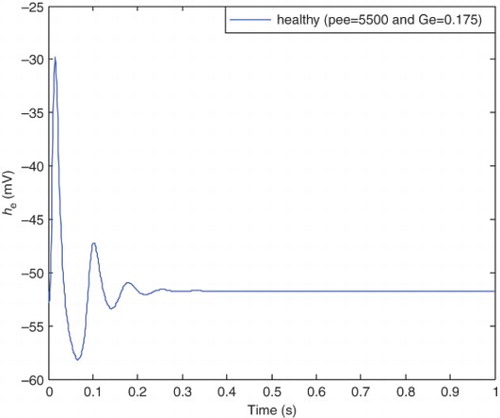
Figure 12. Comparison between the pre-epileptic state (with and without controller) and healthy state.
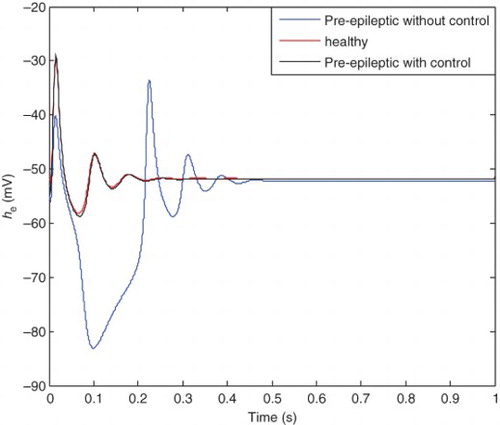
Figure 13. Comparison between the epileptic state (with and without controller) and healthy state.
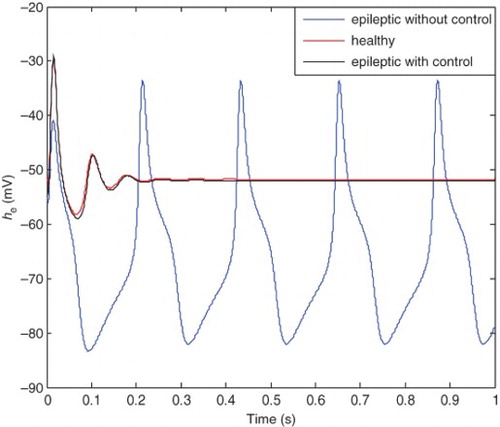
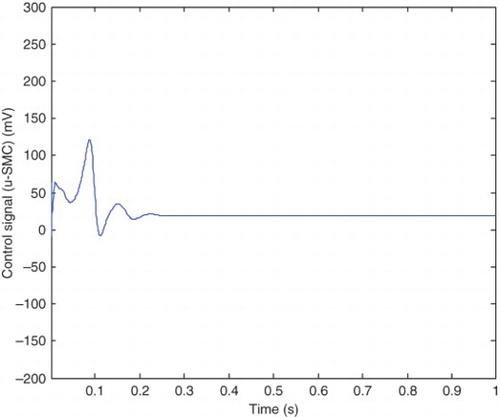
The error between the pre-epileptic state and the applied SM controller and the healthy state, which can be obtained from Equation (42) is illustrated in . The error between the epileptic state and the applied SM controller with the healthy state is also shown in . The applied control signal which is obtained from Equation (39) is shown in . By applying the presented robust control method, the epileptic hyperexcited oscillations are suppressed for different values of pathological parameters in different states.
Figure 14. The error between the pre-epileptic state with applied controller and healthy state.
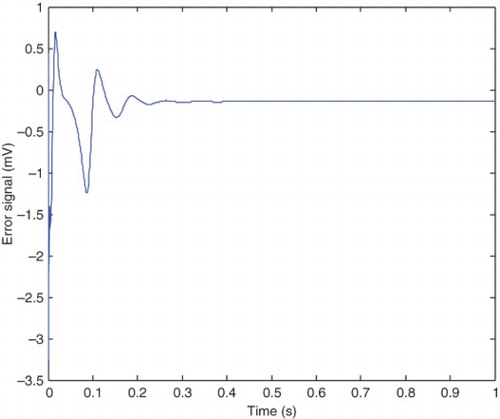
Figure 15. The error between the epileptic state with applied controller and healthy state.
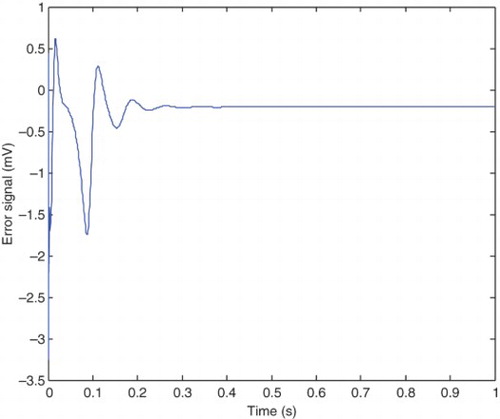
Figure 16. The applied control signal in this model.
5.1 Comparison
From , it can be seen that the steady-state value of he is −52 mV and the controller is able to maintain the steady state at this value. The applied control signal is illustrated in . The steady-state value of the control signal is 18.8 mV which is significantly low compared with the 100 mV steady-state value of Kramer,Lopour, et al. (2006) achieved through applying the linear feedback control. This makes the method of the current paper applicable in practice, but the mentioned proportional feedback control would be difficult to implement safely. The chemical processes associated with this type of control algorithm, would damage the cortical tissue (Lopour& Szeri, 2010; Kramer, Lopour, et al., 2006). Furthermore, the presented proportional feedback controller is not robust against variations of pathological parameters (the uncertainties). To improve this proportional feedback controller, the researchers have considered adding a derivative or integral term to the controller, or even using all three components to produce a proportional-integral-differential controller (Lopour & Szeri, Citation2010). First, we will compare the PD controller with the linear feedback controller, which are both presented in Kramer, Lopour, et al. (2006). The applied voltage delivered by the control signal in differential control method approaches to zero after 1 s which is very good for practical implementation (Kramer, Lopour, et al.,2006). However comparison continues from two points of view: steady-state behavior and robustness. The control signal, presented in of Kramer, Lopour, et al. (2006), approaches to its steady-state value after 1 s. It is clear from that the control signal of the presented method approaches to its steady-state value in 0.2 s. As the required time for approaching the steady-state value increases, the fluctuations around the steady-state value are also increased. These fluctuations can be seen from in the current work and of Kramer, Lopour, et al. (2006).
Fluctuations in the control signal, which would be delivered to the patient's cortex, may damage the cortical tissue. By applying the controller, epileptic seizures are expected to be halted and the behavior of he become similar to the behavior of the healthy state. The presented robust control meets these expectations ( and ). However, the epileptic state after applying the differential controller which is plotted between t=1 s and t=3 s in of Kramer, Lopour, et al. (2006), is not similar to the healthy state shown in of Kramer, Lopour, et al. (2006) or the curve shown in .
According to results of the differential control algorithm illustrated in of Kramer, Lopour, et al. (2006), the controller succeeds in halting the seizures, but the mentioned difference in behavior of the he signal after applying the controller, compared with a healthy state may cause damages to the cortical tissue. Second, the improvement of the presented method compared with the differential controller of Kramer, Lopour, et al. (2006) is robustness. Robustness in Kramer, Lopour, et al. (2006) is investigated with constraint of the time delay. Moreover, by variations of pathological parameters, the results of the controller are not preserved. To show that the differential controller in Kramer, Lopour, et al. (2006) is not robust against the changes in pathological parameters, numerical solutions of the dimensionless model are computed over the parameter range of and
. These ranges of parameters in the dimensionless model are equivalent to
(s−1) and
in the dimensional one. According to chaotic analysis and its corresponding results which are compiled in and , the transition from the epileptic to a healthy state commences from approximately pee=170, 500 (s−1) despite the fact that this value of pee was not considered in Kramer, Lopour, et al. (2006). In other words, a healthy state after the epileptic state was not considered.
Although the integral term in the controller presented in Lopour and Szeri (Citation2010) pushes the integral of the control signal to zero, but the control voltage u, is applied to all electrodes, where the maximum applied voltage by a single electrode is 60 mV (Lopour & Szeri, Citation2010) which is greater than the applied voltage compared with the presented robust method (18.8 mV). Moreover, it is not robust against the variations of pathological parameters.
The filter controller is another control strategy which has been presented in Dafilis et al. (Citation2002) to suppress the seizures. It is able to suppress the oscillations in the epileptic state just for a specific value of the controller gain which is a constraint for the control system. So the filter controller is not a robust method due to its limitation in having a particular gain specified for specific values of pathological parameters in healthy and epileptic states (Dafilis et al., Citation2002). Unlike the filter control approach, the presented robust method could be applied in different states with different pathological parameters without considering any constraint. Comparison of the different control algorithms mentioned above and the presented method is summarized in .
Table 6. Comparing results between the different control algorithms and SMC.
6. Conclusions
In this paper, control of epileptic seizures is considered and a robust sliding mode controller based on the human CM is provided. First the chaotic behavior of the model is investigated based on LLE and Entropy criteria. Based on the chaotic analysis of the model, proper values of the model's pathological parameters for transitions between a healthy and epileptic state and then going back to the healthy state are calculated. The second part of the paper was dedicated to design a robust sliding mode controller capable of controlling the behavior of the brain and halting the hyperexcited oscillations in the epileptic state. Comparison between our control algorithm with previous researches was performed from two points of view. (1) Steady-state behavior, i.e. the amplitude of applied control signal across the cortex tissue and settling time, and (2) Robustness. We analyzed and compared the behavior of the delivered control signal based on its steady-state value, oscillations, and settling time. The control signal presented in the current paper shows reduced oscillations around its steady-state value compared with previous researches. Also the robust method shows lower steady-state value compared with P, PI, and filter controller and higher value compared with the PD controller. However, the settling time in the PD controller is much more than the presented method. Regarding the settling time, the presented method shows lower settling time compared with all previous researches. We have also investigated the robustness of the controller against uncertainties. Here, by uncertainties, we mean the variations of pathological parameters in the model. Unlike previous researches, in this research, the robustness has been taken into account and the method is robust to the mentioned variations.
REFERENCES
- Adeli, H., Ghosh-Dastidar, S., & Dadmehr, N. (2007). A wavelet-chaos methodology for analysis of EEGs and EEG subbands to detect seizure and epilepsy. IEEE Transactions on Biomedical Engineering, 54, 205–211. doi: 10.1109/TBME.2006.886855
- Bojak, I., & Liley, D. T. J. (2005). Modeling the effects of anesthesia on the electroencephalogram. Physical Review, E 71, 1–22. doi: 10.1103/PhysRevE.71.041902
- Bojak, I., Liley, D. T. J., Cadusch, P. J., & Cheng, K. (2004). Electrorhythmogenesis and anaesthesia in a physiological mean field theory. Neurocomputing, 58–60, 1197–1202. doi: 10.1016/j.neucom.2004.01.185
- Chakravarthy, N., Sabesan, S., Tsakalis, K., & Iasemidis, L. (2009). Controlling epileptic seizures in a neural mass model. Journal of Combinatorial Optimization, 17, 98–116. doi: 10.1007/s10878-008-9182-9
- Colpan, M. E., Li, Y., Dwyer, J., & Mogul, D. J. (2007). Proportional feedback stimulation for seizure control in rats. Epilepsia, 48(8), 1594–1603. doi: 10.1111/j.1528-1167.2007.01073.x
- Dafilis, M. P., Bourke, P. D., Liley, D. T. J., & Cadusch, P. J. (2002). Visualizing chaos in a model of brain electrical activity. Chaos & Graphics, 26, 971–976. doi: 10.1016/S0097-8493(02)00183-8
- Dafilis, M. P., Liley, D. T. J., & Cadusch, P. J. (2001). Robust chaos in a model of the electroencephalogram: Implications for brain dynamics. American Institute of Physics, 11, 474–478. doi: 10.1063/1.1394193
- Ghosh-Dastidar, S., Adeli, H., & Dadmehr, N. (2007). Mixed-band Wavelet-Chaos-neural network methodology for epilepsy and epileptic seizure detection. IEEE Transactions on Biomedical Engineering, 54, 1545–1551. doi: 10.1109/TBME.2007.891945
- Gluckman, B. J., Nguyen, H., Weinstein, S. L., & Schiff, S. J. (2001). Adaptive electric field control of epileptic seizure. The Journal of Neuroscience, 15, 590–600. doi: 0270-6474/01/210590-11$15.00/0
- Kramer, M. A., Kirsch, H. E., & Szeri, A. J. (2005). Pathological pattern formation and cortical propagation of epileptic seizures. Journal of the Royal Society Interface, 2, 113–127. doi: 10.1098/rsif.2004.0028
- Kramer, M. A., Lopour, B. A., Kirsch, H. E., & Szeri, A. J. (2006). Bifurcation control of a seizing human cortex Physical Review, E 73, 1–16. doi: 10.1103/PhysRevE.73.041928
- Kramer, M. A., Szeri, A. J., Sleigh, J. W., & Kirsch, H. E. (2006). Mechanisms of seizure propagation in a cortical model. Journal of Computational Neuroscience, 22(1), 63–80. doi: 10.1007/s10827-006-9508-5
- Liley, D. T. J., Cadusch, P. J., & Dafilis, M. P. (2002). A spatially continuous mean field theory of electrocortical activity. Computation in Neural Systems, 13, 67–113. doi: 10.1080/net.13.1.67.113
- Liley, D. T. J., Cadusch, P. J., & Wright, J. J. (1999). A continuum theory of electro-cortical activity. Neurocomputing, 26–27, 795–800. doi: 10.1016/S0925-2312(98)00149-0
- Lopour, B. A., & Szeri, A. J. (2010). A model of feedback control for the charge-balanced suppression of epileptic seizures. Journal of Computational Neuroscience, 28, 375–387. doi: 10.1007/s10827-010-0215-x
- Lopour, B. A., Tasoglu, S., Kirsch, H. E., Sleigh, J. W., & Szeri, A. J. (2011). A continuous mapping of sleep states through association of EEG with a mesoscale cortical model. Journal of Computational Neuroscience, 30, 471–487. doi: 10.1007/s10827-010-0272-1
- Mirzaei, A., Ayatollahi, A., & Vavadi, H. (2011). Statistical analysis of epileptic activities based on histogram and wavelet-spectral entropy. Journal of Biomedical Science and Engineering, 4, 207–213. doi: 10.4236/jbise.2011.43029
- Steyn-Ross, M. L., Steyn-Ross, D. A., & Sleigh, J. W. (2004). Modeling general anesthesia as a first-order phase transition in the cortex. Progress in Biophysics & Molecular Biology, 85, 369–385. doi: 10.1016/j.pbiomolbio.2004.02.001
- Steyn-Ross, M. L., Steyn-Ross, D. A., Sleigh, J. W., & Whiting, D. R. (2003). Theoretical predictions for spatial covariance of the electroencephalographic signal during the anesthetic induced phase transition: Increased correlation length and emergence of spatial self-organization. Physical Review, E 68, 1–18. doi: 10.1103/PhysRevE.68.021902
- Vavadi, H., Ayatollahi, A., & Mirzaei, A. (2010). A wavelet-approximate entropy method for epileptic activity detection from EEG and its sub-bands. Journal of Biomedical Science and Engineering, 3, 1182–1189. doi: 10.4236/jbise.2010.312154
- Wilson, M. T., Steyn-Ross, D. A., Sleigh, J. W., Steyn-Ross, M. L., Wilcocks, L. C., & Gillies, I. P. (2006). The K-complex and slow oscillation in terms of a mean-field cortical model. Journal of Computational Neuroscience, 21, 243–257. doi: 10.1007/s10827-006-7948-6