
Abstract
Government regulations, environmental taxes, media and growing environmental concern among customers have created a need for ecofriendly and economic manufacturing system. Since imperfect products are unavoidable due to faulty production, transport and storage conditions, they must be screened out before delivery to the customer through a 100% screening process which produces reworkable, non-reworkable but slightly defective items and scrap items beside the major perfect items. In manufacturing scenarios the pollutants are the harmful byproducts. Sometimes a small fraction of pollutant remains uncaptured or leaked from the cumulated pollutants. Keeping all these facts in mind, we propose a economic production quantity model with three types of imperfect items as random fractions of production lot-size under two different scenarios namely constant and variable pollution cost. We have illustrated our model by numerical example and sensitivity analysis is also carried out. We have shown that our model can also be used for cap-and-trade policy.
1. Introduction
Environmental pollution, scarcity of resources, climate change, bio-diversity, loss and ecosystem degradation – each of them are the continuous threats to our finite stock of natural capital and it challenges the ability of our economy to provide sustainable growth and prosperity for all. Sustainability is defined as “meeting the need of present without compromising the ability of future generations to meet their own needs” (World Commission on Environmental and Development, 1987). Recent intense industrial development throughout the world resulted in elevated lifestyle and knowledge of common people. Consequently, the identification and increasing understanding of the interrelationship among manufacturing, pollution, health and the environment have highly increased. Pressure from the media, customers, investors, non governmental organization (NGO) and governments has forced the manufacturers to consider the effects of pollutants and taking action to terminate or at least minimize pollution for the protection of the society. Wang and Gupta (Citation2011) reported that in 1994, Asian Productivity Organization (APO, http://www.apo-tokyo.org/) suggested that if Asia has to develop fully, sustainability should be integral part of new paradigm of production. Investors and companies are becoming more and more conscious of the fact that environmental issues affect their businesses, not only as a challenge but also opportunities. There are opportunities in the sense that manufacturers have started to motivate their environment-conscious customers to buy the less polluting items or a product that is manufactured using less polluting technologies. Also getting trade license is easy with environment friendly production technology. Wang and Gupta (Citation2011) in their book reported that green production method shifts industries from “red ocean strategies (low price market competition)” to “blue ocean strategies (new competition opportunities).” They stated that it helps the manufacturers to present new type of competition to rivals and increase the barrier for the new firms. Most of the leading manufacturers are supporting the slogan of “Clean, Green and Lean.” The three objectives of sustainable production are (i) maximizing total desirable production, (ii) minimizing total undesirable waste and (iii) minimizing the consumption of input resources. People are also motivating and preferring those products which are environmentally better (i.e. less waste making, less energy consuming, etc). Sectors such as metal and mining, oil and gas, electronics, pharmaceutical, chemicals, machines and automotives are also serious about pollution prevention and waste reduction from a strategic, competitive and environmental perspective. Other concepts such as PPP (Profit, Planet and People) and 4R (Reduction, Redesign, Reuse and Remanufacture) are also popular among sustainable manufacturing literature.
In many production-inventory systems, it is observed that two types of products are produced namely, useful products (i.e. profitable outputs having positive value for consumers) and harmful products (i.e. outputs having negative value for consumers, such as waste, emissions of pollutants, etc.). In any production process, waste is generated, significant quantities of fossil fuels are consumed in transporting and producing within the production system. Large quantities of water are consumed and contaminated. The law of conservation of mass also support the fact that wastes and pollutants are inevitable in any production process (total amount of raw material is not converted into final products, but a fraction of it. Remaining parts become the wastes and emissive pollutant matters). Business regulations involving environmental protection are constantly improving and almost often create uncertainties for manufacturers bringing significant implications for their financial performance. Consumer's reactions, awards from Government and other environmentally motivated efforts create highly motivated policies that involve companies’ market or affects its financial growth. Several types of costs or losses are associated with industrial pollution: internal and external. Internal costs include cleanup cost for the pollutants already emitted, containment costs to stop or reduce further emission, lost useful matters, penalties related to punitive damages, etc. whereas external costs involve loss of life, injury to workers, costs of repairing public infrastructure, lost-sales, lost consumer value, natural resource damages, etc. There are mainly two types of pollution preventive policies which a manufacturing organization can incur. First is to implement innovative techniques to build or purchase (and install) new equipments which emit less pollutant; which may become very costly affair. The second strategy is to use some pollution control techniques in present procedures which will consume less effort and capital. Labor, capital and energy are required to reduce waste and pollutants’ emissions; which implies some opportunity cost. But in the long run it comes as an unique corporal and social identity of the manufacturer. People are also motivating and preferring those product which are environmentally better (i.e. less waste production, less energy consuming, etc). This outlook has also improved as an opportunity of product differentiation for the items whose composition are almost identical (e.g. utensils, cements, fuels, lubricants, etc). Sectors such as metal and mining, oil and gas, electronics, pharmaceutical, chemical products, machines and automotive are also started being serious about pollution prevention and waste reduction from a strategic, competitive and environmental perspective. Steel production involves pollution from its ore extraction, production, transport and recycling. For example, an ABC steel plant unit in India exhausts several harmful dusts, fumes and substances that are quite injurious to human health, vegetation, crops, landscape, animals, etc. Such discharges contaminate and damage inland waters, environment, soil, food, human settlement and even flora and fauna. Therefore, these wastes should not be left unnoticed and that is why threshold limits for such harmful substances have been fixed and industries are required to adhere to these norms. The ABC authorities publish annual reports emphasizing their corporate social responsibility including environmental sustainability through waste prevention, less dust emission, less resource consumptions and energy saving improvement. To quantify the optimal level of pollution, one has to evaluate the policy that minimizes the total social costs of pollution (the sum of total prevention costs and total damage costs). Also most of the inventories have tendency to deteriorate with time. The deterioration of some items in stores is very common; for example meat, medicine, vegetables, blood, volatile liquids, radioactive chemicals, corrosive metals, etc. The result of deterioration in any inventory system mostly produces wastes, harmful pollutants and malodorous substances. The process of industrialization and consequent pollution during the sustainable growth of civilization has depleted the non-renewable resources of the earth thereby adversely affecting the environment. It is a major challenge for the society to develop new vistas of industries with new technologies that utilize the waste items to manufacture useful products. As long as their intrinsic values and scopes of utilization are not understood, these remain as waste or discarded materials and pollutants.
Few decades ago, industrial pollution prevention practices were initially designed separately for air, water and land pollution. Such methods include the removal of pollutants from waste-receiving water bodies which often shifts the problem from one part of the environment to another. For example, a blast furnace in ABC steel plant produces tons of slag, ashes, sludges and a large volume of dust and smoke per year. Suppose that solid pollutants were filtered from air and water, but then were improperly disposed off on land. Sewage and industrial sludges were incinerated, adding to the air pollution problem; and solid wastes were leached or burned, increasing water or air pollution problems. Present practices to industrial pollution control recognize these environmental interactions and now focus simultaneously on the reduction of wastes and on comprehensive environmental planning. The major methods of pollution prevention programs include: prevention at source methods (e.g. switching to a less polluting input, reducing quantity of pollutants by using new techniques), end-of-pipe methods (such as installing equipment for removing or neutralizing pollutants). Amount of pollutant vary according to the type and quantity of raw materials, the process, the equipments used, and the implementation of pollution reduction technology. Pollutant estimation procedure play the important role in developing pollution control strategies. They are used after collecting the data from source-specific tests or continuous pollution monitors. However, such test data are not always obtainable and they may not reflect the variability of actual pollution over time. Irrespective of their limitations, the pollution factors are still treated as the best or only method available for pollution estimation. Pollution factor (see Section 4.2) represents a value that relates the amount of a pollutant released to the environment with an activity associated with the release of that pollutant. These factors may be given by mass of pollutant divided by a unit mass, volume, distance or duration of the activity emitting the pollutant (e.g. kilograms of particulate emitted per megagram of coal burned). According to IPCC (Citation2006) Guidelines for National Greenhouse Gas Inventories, a simple estimate of pollutants are given by the formula
where amount of activity is measured tonnes/year whereas emission factor is generally measured in tonnes of pollutants per tonnes of raw materials (no unit). A cost-function for pollution control can generally be separated into two basic parts (i) capital costs and (ii) operating costs. Capital cost includes land price or rent, cost of constructing the physical works, including pollution control plant and equipments. These costs are generally paid once over the useful duration of production process. The second basic cost parameter is operation and maintenance (O&M) expenses for the day-to-day usage and upkeep of treatment facilities. These O&M costs are further divided into direct costs: maintenance, plant supplies, labor and supervision, utilities, chemicals and disposal of wastes; and indirect costs: depreciation, real estate taxes, insurances, interests and general overheads. For instance, indirect costs of treating scale in iron and steel rolling activities account for approximately 40% of total operating costs.
2. Literature review
Many useful modification of classical economic order quantity (EOQ) and economic production quantity (EPQ) models are available in the literature. A fraction of imperfect items in inventory system becomes obvious because of erroneous handling and production. Most of them include warehouse related damages, transportation errors, imperfect production process, natural disasters, damages, etc. Porteus (Citation1986) and Rosenblatt and Lee (Citation1986) were the pioneers to incorporate the concept of imperfect items in production process for inventory management. Both of their models considers the situation in which, beginning with in-control production state with perfect products of the production system under consideration shifts to out-of-control state at some random epoch of time and produce defective products also. In the model of Rosenblatt and Lee (Citation1986) the elapsed time until the production process shifts from in-control state to an out-of-control state was considered exponentially distributed random variable and the defective items was reworked instantaneously at a cost. It was observed in their model that the presence of defective products motivates smaller lot sizes. Zhang and Gerchak (Citation1990) considered a joint lot sizing and inspection policy where a random proportion of lot-size were defective. They assumed that defective items are not reworkable and thus assumed the concept of replacement of them by the good quality items. Salameh and Jaber (Citation2000) assumed that the defective items could be sold at a discounted price in a single batch by the end of the 100% screening process and found that the economic lot-size tends to increase as the average percentage of imperfect quality items increases. Goyal and Cardenas-Barron (Citation2002) made some modifications in the model of Salameh and Jaber (Citation2000) to calculate order quantity more accurately. In another paper Goyal, Huang, and Chen (Citation2003) developed optimal integrated vendor–buyer inventory policy for imperfect quality items to minimize the total joint annual costs incurred by the vendor and the buyer. Papachristos and Konstantaras (Citation2006) pointed out that the sufficient conditions to prevent shortages given in Salameh and Jaber (Citation2000) may not really prevent their occurrence and considering the timing of withdrawing the imperfect quality items from stock, they clarified a point not clearly stated in Salameh and Jaber (Citation2000). Wee, Yu, and Chen (Citation2007) developed an optimal inventory model for items with imperfects quantity and shortage backordering. They allow 100% screening of items at a speed which is greater than the demand rate. Maddaha and Jaber (Citation2008) in their model obtained the simple expressions for the expected profit per unit time and the optimal order quantity for the EOQ model with imperfect items. Wang, Lin, Chen, and Chen (Citation2009) investigated the situations of an imperfect production process for the joint determination of both EPQ and preventive maintenance (PM). They had considered imperfect process follows a general deterioration distribution with increasing hazard rate. A detailed survey of the recent inventory models with imperfect items are provided by Khan, Jaber, Guiffrida, and Zolfaghari (Citation2011). Along a different viewpoint, Sana (Citation2012) considered imperfect production system with allowable shortages due to regular PM for products sold with free minimal repair warranty to attract customers and determines the optimum buffer level and production run time to minimize per unit production cost. The cost minimization optimal policy was considered by Tsou, Hejazi, and Barzoki (Citation2012) when the produced item of imperfect production system obeys general distribution pattern, with its quality being either perfect, imperfect or defective. The fractions of such items were restricted to constants and they also established that their model becomes classical EPQ model in case imperfect quality percentage is zero or even close to zero. Recently, Mukhopadhyay and Goswami (Citation2014) considered EPQ model with imperfect items where imperfect items were reworked at a cost and learning is setup was considered. It was established that learning in setup saves total cost which ensures high profitability of the optimal policy.
The effects of industrial pollution in environment and their prevention has been a serious research topics among academicians and researchers. Freeman et al. (Citation1992) reviewed the field of industrial pollution prevention and reported the success achieved by various selected industries in achieving zero hazardous waste discharge. They also prefigured that pollution prevention policy in industrial systems could be used as a mechanism to strengthen the international relation and improve worldwide environment quality. In their studies, Molina and Molina (Citation2004) reported that the approach to address air pollution must consider scientific, technical, economic, social and political factors as well as existing infrastructure. They also mentioned the importance and scope of innovative emission control technologies. Letmathe and Balakrishnan (Citation2005) developed two comprehensive and environmental oriented linear programing-based models for optimal product mix and production quantities in the presence of various environmental constraints as well as production constraints. Bonney and Jaber (Citation2011) examined the importance of inventory management to the environment and discussed the various aspects of environmentally responsible inventory systems. They pioneered a simple EOQ-based environmental model in their paper. Katz (Citation2012) studied the harms by environmental, water and air pollution incurred by various production processes and transportation which includes coal base electricity, metal mining, plastics, pesticides, electronics and detergent industries. He addressed the environmental laws, their implementation and effects across the globe and predicted the brighter future of these efforts. Tsakovski, Simeonova, and Simeonov (Citation2012) provided multivariate statistical assessment to consider the environmental system with detailed complexity in a region of Austria about various pollution sources and their effect on environment and explored the scope of sustainability in ecological technological and social sense. Benjaafar, Li, and Daskin (Citation2013) considered carbon emission parameters with various decision variables to modify traditional models to consider the trade-off for optimal cost and carbon footprint. Chen, Benjaafar, and Elomri (Citation2013) developed a carbon constrained EOQ model which significantly reduces emissions without significantly increasing cost under certain conditions. Recently, van der Veen and Venugopal (Citation2014) applied multi-criteria decision-making approach to solve a variant of the EOQ model to show that including sustainability in an inventory system is profitable in the sense altruistic, legitimacy and economic perspectives.
In this paper, we address a scenario of a production-inventory system where the items produced are either perfect, or imperfect or defective. Imperfect items are of comparatively less quality than standard product which can be sold at a discounted price. The defective items are reworked to produce standard quality items and completely useless items which are scrapped. Then we discuss different cases for pollution preventive model. The paper is organized as follows: Section 1 contains introduction and Section 2 contains literature review. In Section 3 notations and assumptions are stated and mathematical models are developed in Section 4. Section 5 contains numerical examples and sensitivity analysis of various parameters of the model. This paper ends with conclusion in Section 6 after which references are provided.
3. Notations and assumptions
Notations: Following table explains the meaning of notations used in our basic model.
Further notations will be introduced when required. Assumptions:
Following assumptions are made in the development of the model:
(1) Production process is not perfect and it produces only single product.
(2) Production rate is finite, constant and greater than the demand rate.
(3) Demand rate is constant.
(4) Screening process outputs three types of products – non-reworkable imperfect items, reworkable defective items and perfect items. Perfect items are sold at full price; imperfect items are sold at reduced price and defective items are reworked which further produce perfect items and disposable scrap products.
(5) The screening process and demand proceeds simultaneously, screening rate is higher than demand rate. i.e. x: screening rate; x>D.
(6) The fraction of non-reworkable imperfect items (p1), reworkable defective items (p2) and scrap items (p3) are random variables for a lot-size. For validity of the model, we assume that
where E[pi] denotes the expectation of pi. To avoid shortages during screening period, demand during screening should be at least equal to the number of perfect items.
(7) The time horizon is infinite.
(8) The lot-size y is a decision variable in the model.
(9) To avoid lost-sales and loss of goodwill, shortages are ignored.
4. Mathematical model
4.1. Basic EPQ model for imperfect quality items with constant pollution control cost (Model P0)
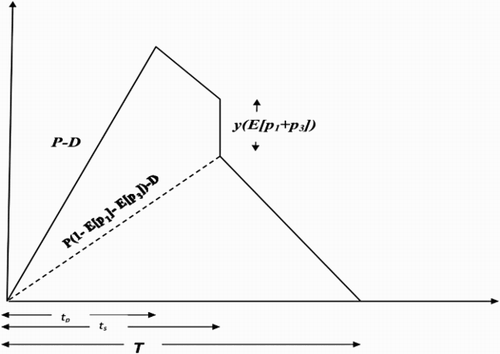
EPQ model and its variants mainly concerned about two decisions; one of them is regarding suitable amount of production quantity and another is suitable time to reorder. The optimal decision is one which either minimize total cost or maximize total profit. Suppose a manufacturer is producing a single type of item at constant production rate P in order to satisfy a constant demand rate of D such that P>D. Both production and demand cycle start at t=0 at which inventory is zero. The inventory reaches its maximum value at the end of production completion. Since the manufactured lot contain a small although detectable fraction of imperfect items, they must be screened out before delivery to the customer through a screening process. The screening process is slower than the production process. The screening process will be over after the production process stops. It separates the final products in four categories: perfectly good, reworkable, non-reworkable and scraps. The perfectly good items are kept for satisfying demand, reworkable items are subjected to rework at some cost to make them perfectly good and stored in main inventory. The items classified as non-reworkable are sold at a discounted price and the scrap type items are discarded at some disposal cost. The behavior of inventory level with time is shown in .
Figure 1. Behavior of inventory with time.
Clearly total percentage of perfect .
.
.
.
.
. For details see Appendix 1.The total cost is given by the following expression:
Differentiating with respect to y twice, we get
Special cases:
(i) When p2=p3=0 we obtain the simple EPQ with one type of imperfect item
(ii) Further when p1=0 in Equation (6), we get
which is the standard EPQ model.(iii) Finally putting P=∞ in Equation (7), we get
which is nothing but the classical EOQ formula.
4.2. Modification of previous EPQ model P0
Analogous to emission factor already discussed in Section 1, we define pollution factor as follows:
This “amount” may either be defined in terms of mass or volume or in some other measure; but the numerator and denominator must be expressed in the same units of measurement. This results in pollution factor as dimensionless quantity.
We propose two models: P1 and P2.
Let us assume following new notations:
π0: the pollution factor
Cπ: the pollution cost
Cπc: the fixed capital cost of pollution control per production run
Cπo: the operating and maintenance (O&M) cost of pollutioncontrol per unit of production quantity
4.3. Model P1: modification of (P0) with type-1 pollution costs
In this model we consider the simplest case by which pollution prevention procedure can be implemented. We assume that the pollutant disposal or treatment cost is independent of time but dependent on quantity only. Such a situation is observed in case of scraps, junks and sewage which are collected first in large amount before treatment.
Following assumptions are made to construct our model:
Constant capital (setup cost of the treatment process/machineries) cost of pollution.
Constant operating and maintenance cost of pollution per unit of production quantity (independent of time).
All the quantity of pollutants are under the control and usable for treatment process.
Then, .
Now, the total average cost including pollution prevention cost
Solving , we obtain
4.4. Model P2: modification of (P0) with type-2 pollution costs
In this model, we consider the case when partial pollution prevention procedure can be implemented. We assume that a fraction σ of the pollutant quantity automatically become less intense and disappear gradually, due to decay, evaporation, biological decomposition, chemical reactions, etc. So the remaining part of the pollutant are considered for treatment. Along with the first two assumption of previous model (P1), we include a new third assumption to develop our model, namely “Not all the quantity of pollutants are under the control and used for treatment.” A fraction σ of the pollutant quantity automatically evanesce (it becomes less intense and disappear gradually) due to decay, evaporation, biological decomposition, chemical reactions, etc.
So the rest part of the pollutant are considered for treatment.
Let Π(t) denote the amount of pollutant accumulated at time t. Then Π(t) satisfies the following differential equation:
Solution of the above differential equation is
Graph of accumulated pollutant vs. time for is shown in .
Figure 2. Accumulated pollutant vs. time.

So, the amount of pollutants produced during the whole production process is Π(TP), where TP is the duration of production process.
Now, the pollution prevention cost is given by
Now the first-order optimality condition becomes
Based on the expressions given for optimal lot-size it follows that it is observed that for optimal production quantity
Remark Our model considers all the pollutant quantity as a whole, but there might be cases when major pollutants are only gaseous pollutants. For such cases our model can be applied to Cap and Trade Policy.
4.5. Application of our model in case of “CAP AND TRADE” Policy
CAP AND TRADE: A cap-and-trade system creates an overall limit (i.e. a cap) on green house gas emissions from the emission sources covered by the program. Cap-and-trade programs can vary by the sources covered. The covered sources, also referred to as covered entities include major emitting industries, fuel producers/processors or some combination of both. The emissions cap is partitioned into emission allowances. Typically, one emission allowance represents the authority to emit one (metric) ton of carbon dioxide-equivalent (tCO2-e). Covered entities that face relatively low emission–reduction costs would have an incentive to make reductions beyond what is required, because these further reductions could be sold (i.e. traded) as emission credits to entities that face higher emission–reduction costs. At the same time, entities who face higher reduction costs could purchase allowances on the market. At the end of each established compliance period (e.g. a calendar year), covered sources would be required to surrender emission allowances to cover the number of tons emitted. If a source did not have enough allowances to cover its emissions, the source would be subject to penalties.
A mathematical model of such policy can be given by
where πˆ is the limit on the pollutant quantity.
5. Numerical example
Let us suppose the deterministic parameters values (in appropriate units) of the model developed in Section 1 as follows:
Let us consider the random variables of imperfect fraction uniformly distributed as follows:
Using the formula in Appendix 1 we obtain
.
From Equation (5), the optimum EPQ becomes y*=2796.54 and corresponding optimal cost 1327669.27 $.
Effect of changes in various parameters on lot-size and optimal cost for the basic model P0 is given in .
Table 1. Effect of new parameters on lot-size and cost for the basic model.
For Model P1
Adding the data to Model P0, we include
π0=0.03,
From Equation (10) we obtain
optimal production lot-size y*=3188.55 and
optimal cost
For changes in new parameters for the model P1 on lot-size and optimal cost we obtain .
Table 2. Effect of new parameters on lot-size and cost for the model P1.
For Model P2
Adding the data to Model P0, we include
π0=0.3,
From Equation (11) we obtain
optimal production lot
and corresponding optimal
For changes in various parameters for the model P1 on lot-size and optimal cost we obtain .
5.1. Sensitivity analysis
Here we observe the sensitivity of the optimal solution for changes in different parameter values. From , we observe the following instances of the basic model P0:
(i) As the setup cost increases lot-size increases significantly but increase in total cost is not significant.
(ii) The increment in the holding cost decreases the production lot-size and the total cost increases.
(iii) As expected, when the demand rate increases, optimal lot-size and total cost increases significantly.
(iv) The effect of increase in production rate results in significant reduction in lot-size. Consequently, the total cost increases marginally.
(v) The change on the screening rate is marginally effective in the model in the sense of its effect on lot-size as well as cost. The increase in screening rate increases the lot-size and decreases the total cost.
(vi) The changes in production cost, rework cost and screening cost does not affect in the optimal production quantity but the total cost is linearly related in the sense that total cost increases with increases of these cost and conversely.
We observe that model P1 is an extension of the basic model P0, where the position of parameters and x in the expression of lot-size and total cost are almost identical as the previous basic model P0. Thus the effect of change in aforementioned parameters in the lot-size and cost are identical. Thus, in order to analyze our modified model, we consider only those quantity which are newly considered in this model but not in the previous model P0; namely π0,Cπ c and Cπ o. We observe the following changes from :
(i) With increment in Cπ c the lot-size increases rapidly but cost increases relatively slowly.
(ii) Increment of operating cost of the pollution prevention Cπ o does not affect the lot-size (which is also obvious from lot-size formula) in this case but it indeed increase the total optimal cost.
(iii) Increment of pollution factor have positive effect for increasing the lot-size as well as cost which is also obvious from its mathematical expression. The increase in cost is much more than the increment in lot-size.
For the model P2, we observe that unlike previous models this model has a new subtractive term in the expression of EPQ which reduces the quantity of the denominator. This term is a function of production rate P and thus it becomes obvious to study the sensitivity of our model in terms of the parameters Cπ o, π0, Cπ c, P and σ. From , we observe following for the model P2.
(i) For increment in Cπ c the lot-size and total cost increases slowly. It should be mentioned that for this model total cost is very much reduced that the previous model while producing the similar lot-size.
(ii) Increment of operating cost of the pollution prevention Cπ o, pollution factor π0 and lost fraction of pollutants σ does not affect the lot-size because of the ignorably smallness of the coefficient of Cπ o. Also changes in optimal cost is also insignificant with these variations. With the increment of lost fraction of pollutants (which is a small quantity) the pollutant quantity to undergo treatment process reduces so there is slight reduction in total cost.
(iii) If the production rate increases, lot-size remains same which is evident from Equation (12). But for increase in production rate total cost increases moderately.
Table 3. Effect of new parameters on lot-size and cost for the model P2.
6. Conclusion
Sustainable manufacturing initiatives have gained considerable prominence in recent years. Some of the benefits that may be achieved by allowing sustainability in manufacturing inventory systems including reduced costs, increased market penetration and market share, increased levels of investment, improved brand reputation, new products and markets, and enhanced customer satisfaction, etc. Sometimes wastes and pollutants are under control but sometimes a small part of them are not always under control. Keeping these facts in mind, this paper investigates EPQ models with imperfect quality items for two types of pollution prevention costs. In contrast to other related articles, the presented model provides explicit formulation of pollutant quantity incorporates some kind of cost associated with the prevention of its harmful effects. More significantly, when some of the pollutants are not under the control of managers, corresponding model also developed. This article suggest the inventory manager to deal with pollution control scenarios and increase the production lot-size compared to the case when pollution costs are not considered. The conditions for the existence and uniqueness of the optimal solutions to the models are established for each cases (no pollution cost, type-1 pollution cost and type-2 pollution cost) respectively and corresponding optimal production policy is also presented. Numerical examples have been included to demonstrate its applications in real production scenarios. Then sensitivity analysis of the models are also carried out from which robustness and usefulness in production scenarios are. In addition, this article is also shown to be a generalized version of the several existing papers. Introduction of non-zero lead time and shortages will be a useful extensions of our model. Some additional practical situations, such as time varying demand, quantity discounts and inflation can also be incorporated into this article.
Highlights
An EPQ type model considering pollution costs is formulated.
Three types of imperfect items are considered to model the production-inventory environment.
Taken consideration of situation when a fraction of pollutant is lost in environment or decayed.
Optimal policies for two pollution preventive production models are obtained.
References
- Benjaafar, S., Li, Y., & Daskin, M. (2013). Carbon footprint and the management of supply chains: Insights from simple models. IEEE Transactions on Automation Science and Engineering, 10(1), 99–116. doi: 10.1109/TASE.2012.2203304
- Bonney, M., & Jaber, M. Y. (2011). Environmentally responsible inventory models: Non-classical models for a non-classical era. International Journal of Production Economics, 133, 43–53. doi: 10.1016/j.ijpe.2009.10.033
- Chen, X., Benjaafar, S., & Elomri, A. (2013). The carbon-constrained EOQ. Operations Research Letters, 41, 172–179. doi: 10.1016/j.orl.2012.12.003
- Freeman, H., Harten, T., Springer, J., Randall, P., Curran, M. A., & Stone, K. (1992). Industrial pollution prevention – A critical review. Journal of the Air & Waste Management Association, 42(5), 618–656. doi: 10.1080/10473289.1992.10467016
- Goyal, S. K., & Cardenas-Barron, L. E. (2002). Note on: Economic production quantity model for items with imperfect quality – A practical approach. International Journal of Production Economics, 77, 85–87. doi: 10.1016/S0925-5273(01)00203-1
- Goyal, S. K., Huang, C.-K., & Chen, K.-C. (2003). A simple integrated production policy of an imperfect item for vendor and buyer. Production Planning & Control: The Management of Operations, 14(7), 596–602. doi: 10.1080/09537280310001626188
- IPCC. (2006). IPCC guidelines for national greenhouse gas inventories. Retrieved April 16, 2013 from http://www.ipcc-nggip.iges.or.jp/public/2006gl
- Katz, R. S. (2012). Environmental pollution: Corporate crime and cancer mortality. Contemporary Justice Review: Issues in Criminal, Social, and Restorative Justice, 15(1), 97–125. doi: 10.1080/10282580.2011.653523
- Khan, M., Jaber, M. Y., Guiffrida, A. L., & Zolfaghari, S. (2011). A review of the extensions of a modified EOQ model for imperfect quality items. International Journal of Production Economics, 132, 1–12. doi: 10.1016/j.ijpe.2011.03.009
- Letmathe, P., & Balakrishnan, N. (2005). Environmental considerations on the optimal product mix. European Journal of Operational Research, 167, 398–412. doi: 10.1016/j.ejor.2004.04.025
- Maddaha, B., & Jaber, M. Y. (2008). Economic order quantity for items with imperfect quality: Revisited. International Journal of Production Economics, 112, 808–815. doi: 10.1016/j.ijpe.2007.07.003
- Molina, M. J., & Molina, L. T. (2004). Megacities and atmospheric pollution. Journal of the Air & Waste Management Association, 54(6), 644–680. doi: 10.1080/10473289.2004.10470936
- Mukhopadhyay, A., & Goswami, A. (2014). Economic production quantity (EPQ) model for three type imperfect items with rework and learning in setup. International Journal of Optimization & Control: Theories & Applications. doi: 10.11121/ijocta.01.2014.00170
- Papachristos, S., & Konstantaras, I. (2006). Economic ordering quantity models for items with imperfect quality. International Journal of Production Economics, 100, 148–154. doi: 10.1016/j.ijpe.2004.11.004
- Porteus, E. L. (1986). Optimal lot sizing, process quality improvement and setup cost reduction. Operations Research, 34, 137–144. doi: 10.1287/opre.34.1.137
- Rosenblatt, M. J., & Lee, H. L. (1986). Economic production cycles with imperfect production processes. IIE Transactions, 18, 48–55. doi: 10.1080/07408178608975329
- Salameh, M. K., & Jaber, M. Y. (2000). Economic production quantity model for items with imperfect quality. International Journal of Production Economics, 64, 59–64. doi: 10.1016/S0925-5273(99)00044-4
- Sana, S. S. (2012). Preventive maintenance and optimal buffer inventory for products sold with warranty in an imperfect production system. International Journal of Production Research, 50(23), 6763–6774. doi: 10.1080/00207543.2011.623838
- Tsakovski, S. L., Simeonova, P. A., & Simeonov, V. D. (2012) Statistical modeling of air pollution. Journal of Environmental Science and Health, Part A: Toxic/Hazardous Substances and Environmental Engineering, 47(1), 6763–6774. doi: 10.1080/10934529.2012.629576
- Tsou, J. C., Hejazi, S. R., & Barzoki, M. R. (2012). Economic production quantity model for items with continuous quality characteristic, rework and reject. International Journal of Systems Science, 43(12), 2261–2267. doi: 10.1080/00207721.2011.569769
- van der Veen, J. A., & Venugopal, V. (2014). Economic and environmental performance of the firm: Synergy or trade-off? Insights from the EOQ model. In T.- M. Choi (Ed.), Handbook of EOQ inventory problems (pp. 121–137). Springer.
- Wang, H. F., & Gupta, M. S. (2011) Green Supply Chain Management: Product Life Cycle Approach. New Delhi: McGraw-Hill Education.
- Wang, P.-C., Lin, Y.-H., Chen, Y.-C., & Chen, J.-M. (2009). An optimal production lot-sizing problem for an imperfect process with imperfect maintenance and inspection time length. International Journal of Systems Science, 40(10), 1051–1061. doi: 10.1080/00207720902974645
- Wee, H. M., Yu, J., & Chen, M. C. (2007). Optimal inventory model for items with imperfect quality and shortage backordering. Omega, 35, 7–11. doi: 10.1016/j.omega.2005.01.019
- World Commission on Environment and Development. (1987). Our common future. Oxford: Oxford University Press.
- Zhang, X., & Gerchak, Y. (1990). Joint lot sizing and inspection policy in an EOQ model with random yield. IIE Transactions, 22(1), 41–47. doi: 10.1080/07408179008964156
Appendix 1
A.1 Derivation of holding cost
We have screening time ts=y/x, production time tp=y/P
for
subject to initial condition, I(0)=0;
which gives I(t)=(P−D)t for .
Again, for
subject to initial condition,
.
This gives I(t)=y−Dt for .
Initial inventory at ts, .
Final inventory at ts, .
Also, for
subject to the initial condition,
.
This gives for
.
Thus
Since p1 and p3 are random variables, we have .
A.2 Derivation of E[(1−p1−p3)2]
We have .
Using the relation: ,
Thus, .