
Abstract
This paper describes an experimental analysis of 2 degree-of-freedom (DOF) quarter-car passive suspension system and hydraulic active suspension system (QC-H-ASS) for ride comfort. The passive suspension system, which models a quarter-car suspension, consists of the sprung mass, unsprung mass, a suspension spring and damper and a tyre spring. A hydraulic actuator has been considered as one of the most viable choices for an active suspension system due to its high power-to-weight ratio and low cost. Thus this model is modified to a 2 DOF QC-H-ASS by placing a hydraulic actuator, with its attendant control instrumentation, in between sprung and unsprung masses. The results show considerable improvement in ride comfort over the conventional passive system. The details of the quarter-car model development with the test set-ups for the passive and hydraulic active suspension systems, suspension elements employed, experimental analysis and results are presented.
Introduction
As with the globalized world, it is no more a wonder for a person to travel from Pune to Mumbai daily for his routine duties. This might be the reason for people are not only interested to own a car, but also dream of a “Palace on Wheels” kind of delight, as they are spending considerable time in travelling. As such, at present the research is focused on the design of semi-active and active car suspension systems. The advent of electronic instrumentation and state-of-the-art data acquisition systems with their reliability and affordability has motivated the automotive designers to focus on the development of an active suspension system capable of fulfilling the need of achieving the golden mean between two conflicting optimizing parameters, i.e. ride comfort and road handling.
The conventional passive suspension system involves the mechanical spring and damper with specific values of stiffness and damping coefficient, with limited scope for its performance improvement. Thus, passive suspension design is a compromise between vehicle handling and ride comfort, as depicted in .
Figure 1. Conflict in ride and handling (CitationSharp & Crolla, 1987).
The semi-active is the class of suspension system wherein the variable dampers of different types are employed along with a suspension spring. In the active suspension system, a controllable actuator is included between the sprung and unsprung masses. It is commonly accepted that passive suspensions have limited performance because their components can only store or dissipate energy, whereas in active suspension, actuator is able to both add and dissipate energy from the system. If a correct control strategy is applied to the actuator system, a better compromise between ride comfort and vehicle stability is possible compared with a passive suspension system (see ).
Figure 2. Strategy for betterment of ride comfort (CitationSharp & Crolla, 1987).
Present theories and practices
Automotive suspension systems have been researched exhaustively by many researchers from all over the continents since long and now have reached to a very high level of sophistication. CitationSharp and Crolla (1987) have described road surfaces, modelling vehicles and setting up performance criteria to passive, active and semi-active suspension systems. They have elaborated methods of deriving control laws for active systems. CitationCrolla (1996) has reviewed the contributions of vehicle dynamics theory to practical vehicle design. He has nicely highlighted the effect of the suspension on improving the vehicle performance and safety. The practical constraints, which are restricting the commercial development of limited bandwidth active suspension systems, have been mentioned. He has observed that electro-hydraulic technology holds the most commercial promise, but a major breakthrough in electro-hydraulic valve technology will be required, leading to reduce costs if significant further developments are to occur over the next few years. CitationKarnopp (1986) has shown using simple linear two degrees-of-freedom suspension system model that even using complete state feedback, there are limitations to suspension performance. CitationRajamani and Hedrick (1995) have developed the adaptive observer for a class of nonlinear systems, using realistic model of the suspension system incorporating the dynamics of the hydraulic actuator. CitationMache and Joshi (2007) have carried out theoretical and experimental dynamic response analysis of a road vehicle suspension system using an electromagnetic damper. A 2-degree-of-freedom (DOF) quarter-car model has been analysed for frequency response analysis. The electromagnetic damper has been developed using a combination of permanent magnet (PM) and an electromagnet (EM) keeping an air gap between them. Linearizing the magnetic damping force between PM and EM, the values of current and position stiffnesses have been obtained. It has been shown that the electromagnetic damper is effective in reducing the amplitude of vibration over a given range of excitation frequencies, in particular at resonant frequencies. CitationSenthil kumar (2008) has described the development of an active suspension system using a proportional-, integral-derivative controller. CitationSenthil kumar and Vijayarangan (2007) have shown that the active suspension system works better than a comparable passive suspension system. Further, it has been shown that, at higher frequencies, the performance of active suspension system deteriorates as force tracking at higher frequencies is difficult. CitationKoshkouei and Burnham (2008) have presented a method for controlling a quarter-car hydraulic active suspension system (QC-H-ASS) using SMC (sliding mode controller) techniques. CitationCao, Song, and Ahmadian (2011) have discussed the latest advances in road vehicle suspension design, dynamics, and control, together with the perspectives, in the context of vehicle ride, handling and stability. In this work, the experimental analysis of 2 DOF QC-PSS and QC-H-ASS for ride comfort has been carried out. The passive suspension system, which models a quarter-car suspension, consists of the sprung mass, unsprung mass, a suspension spring and damper and a tyre spring. A hydraulic actuator has been considered as one of the most viable choices for an active suspension system due to its high power-to-weight ratio and low cost. Thus the model is modified to 2 DOF QC-H-ASS by placing a hydraulic actuator, with its attendant control instrumentation, in between sprung and unsprung masses. The results show considerable improvement in ride comfort over the conventional passive system. The details of the quarter-car model development with the test set-ups for the passive and hydraulic active suspension systems, suspension elements employed, experimental analysis and results are presented. CitationTamboli and Joshi (1999) presented an optimum design methodology for the passive suspension system of a vehicle subjected to random road excitations and found that the power spectrum density (PSD) of the actual road excitation was following an approximately exponentially decreasing curve. Also, the change in vehicle velocity has a significant effect on the values of root mean square acceleration response (RMSAR). The RMSAR of a vehicle dynamic system subjected to actual random road excitations is obtained so as to account for the effect of the actual PSD of road excitation and the frequent changes in vehicle velocity. The RMSAR of the vehicle is calculated for actual field excitation using the fast Fourier transformation (FFT) technique to obtain the PSD, by recording observations at the rear wheel. Further, they have studied the effect of time lag due to wheelbase on the RMSAR of the vehicle and formulated the relationship between and the autocorrelation. In this work, from a ride comfort point of view, the values of the design variables, such as spring stiffness and viscous damping coefficient of the front and rear suspensions, have been obtained, by minimizing the RMSAR using the desired boundary values of the vertical RMSAR, as specified in the chart of ISO 2631, 1985(E).
CitationKulkarni and Joshi (2005) have carried out the optimization of a five-DOF road vehicle suspension and the hump for the comfortable ride and speed control. In this research, the maximum acceleration of the driver at speeds greater than the hump designed speed is minimized to obtain optimum damping ratio of the suspension system. Further the maximum acceleration of the driver at the hump designed speed is minimized to obtain optimum hump dimensions. This process is repeated alternately, under adequate constraints. They have taken a five-DOF half car model of a typical road vehicle for alternate optimization of the hump dimensions and damping ratios of the suspension system. The results of optimization show that there is a certain safe speed range for comfortable ride while passing over the hump and if the driver does not keep the speed of the vehicle in this range, then excessive uncomfortable maximum acceleration was experienced. CitationKarnopp (1986) describes the theoretical limitations in active suspensions. He shows, using simple linear two degrees-of-freedom suspension system model, that even using complete state feedback, there still are limitations to suspension performance, in the fully active case. The mathematical model of vehicle and suspension is presented in detail. He concluded that many new possibilities exist when a passive suspension is replaced by a feedback-controlled force generator. CitationNagai (1993) has described the limitations of the passive suspension systems and discussed the solution to overcome the basic problem. The problem of invariant properties of the passive suspension has been described and it has been shown that if the tyre has some damping force, these invariant points do not exist. The merits and limitations of active suspension using hydraulic actuators have been discussed. The optimal control of the active suspension using linear quadratic regulator optimal control theory has been described. It has been pointed out that the active or semi-active suspensions replacing conventional passive elements with controlled actuators can theoretically and practically improve the vibration isolation properties and better handling and stability. CitationBassam, Ahmad, and Mohamed (1997) investigated preview control for active suspension systems. Two preview concepts are used: (a) look-ahead preview, where the information relating to roadway disturbances about to be encountered by the moving vehicle is assumed to be sensed and (b) wheelbase preview, where knowledge of the front wheel states is used to improve performance at the rear of the vehicle. An optimal preview control method is developed for the application to half car suspension systems having full and slow-active vibration control elements. The slow-active system used consists of an actuator of limited bandwidth in series with a passive spring, the combination being in parallel with a passive damper. Integral constraints are included in the performance index to achieve better body attitude control. The effect of preview control on vehicle performance characteristics in terms of ride comfort, suspension deflections and road-holding ability is investigated. CitationWagner and Liu (2000) have described nonlinear modelling and control of vibration isolation of suspension systems, to minimize the transmission of road surface disturbances to the vehicle occupants. Three such systems have been investigated, i.e. passive, semi-active and active. For this semi-active and active actuator configurations such as semi-active hydraulic damper and active electro-mechanical hydraulic actuator have been discussed in detail. Controller design schemes such as, sky hook type, proportional plus integral and variable structure control have also been presented. The experimental investigation has shown that the active actuator achieves better overall vibration isolation performance in comparison to the semi-active actuator. CitationZhang and Alleyne (2005) have introduced a novel reformulation of the active suspension problem, based on prescribing a given displacement between the sprung and unsprung masses presents a hybrid control approach to circumvent the basic trade-off between performance and robustness from an individual controller. This hybrid control strategy utilizes a robust controller for guaranteed robustness when the plant model is not well known and employs an adaptive controller for high performance after sufficient plant information has been collected. CitationSong, Ahmadian, and Southward (2003), provides an overview of the latest advances in road vehicle suspension design, dynamics and control, together with the authors’ perspectives, in the context of vehicle ride, handling and stability. The general aspects of road vehicle suspension dynamics and design are discussed, followed by descriptions of road-roughness excitations with a particular emphasis on road potholes. Passive suspension system designs and their effects on road vehicle dynamics and stability are presented in terms of in-plane and full-vehicle arrangements. CitationAnakwa, Thomas, and Jones (2002) describe prototype pneumatic active suspension systems and its mathematical model using MATLAB and Simulink. They described a prototype pneumatic active suspension system, which was designed and built over a number of years as a sequence of student projects. The physical plant, which models a quarter-car suspension, consists of a wheel, coil springs, a pneumatic actuator for active damping, position and velocity sensors, and an alternating current (AC) motor for simulating road disturbance input signal. CitationYucheng (2008) has reviewed briefly of some of the recent patents (since 2000) in designing advanced suspension systems. He has described different types of suspension systems, properties and important auxiliary components. Also, some future trends of research in the suspension system design have been discussed. He has stated that compared to the mechanical linkages, in addition to providing better reliability, the hydraulic and electronic control systems can react to road conditions or short-term vehicle acceleration instantly and perform appropriate adjustments automatically.
With this survey of recent publications in the area of road vehicle suspension system, it is quite obvious that the incorporation of hydraulic actuation system in the suspension system is a future trend of research in this area. Therefore, in this paper, a passive suspension system presented in CitationTamboli and Joshi (1999) and CitationKulkarni and Joshi (2005) is modified to a 2 DOF QC-H-ASS by placing a hydraulic actuator, with its attendant control instrumentation, in between sprung and unsprung masses. The experimental results show considerable improvement in ride comfort over the conventional passive system.
2 DOF QC-PSS model
shows the 2 DOF QC-PSS model.
Figure 3. 2 DOF QC-PSS model. Ms, sprung mass; Mus, unsprung mass; Ks, suspension spring stiffness; Kt, tyre spring stiffness; Cs, damping coefficient; xs(t), sprung mass displacement; xus(t), unsprung mass displacement; r, road disturbance input.
The development of the components of a 2 DOF QC-PSS (as shown in ) is made by constructing the test set-up, as shown in . In the experimental set-up, a variable speed DC motor is connected to a cam and follower mechanism to provide harmonic base excitation at desired amplitude and frequency. It is mounted on a rigid cast iron base fixed on a firm concrete foundation. Necessary instrumentation for obtaining time-based data for sprung mass displacement and base excitation and converting the same in graphical form, using FFT interfacing system has been developed. show the subsystems developed for the experimental test set-up.
Plate 1. Test cam with 30 mm stroke.
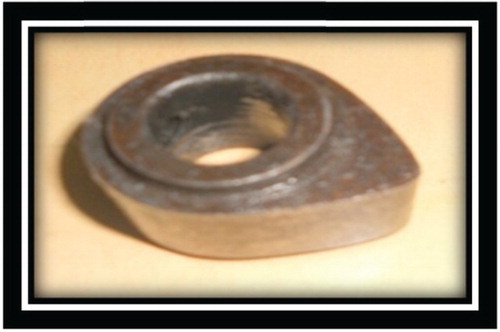
Plate 2. Round edge follower.
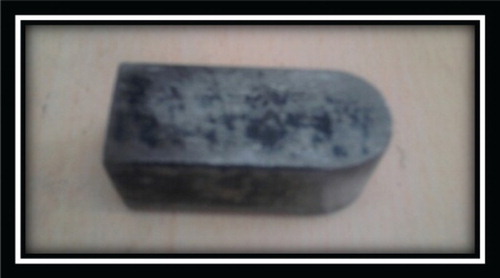
Plate 3. Views of exciter system using the cam and follower mechanism and fixture with electric drive.
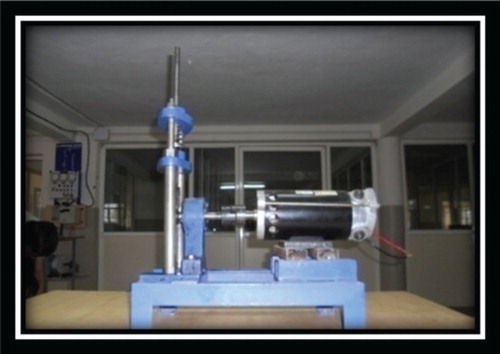
Plate 4. Views of exciter system using the cam and follower mechanism and fixture with electric drive.
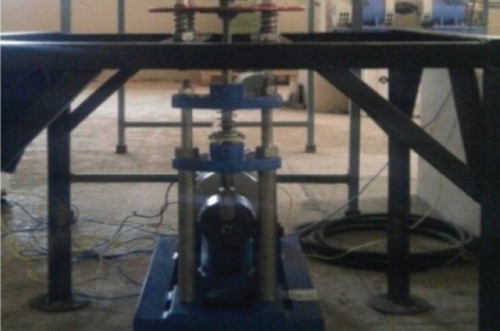
Plate 5. Suspension spring and viscous damper assembly.
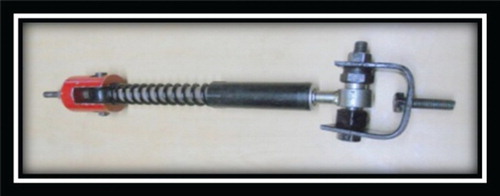
Plate 6. 2 DOF QC-PSS experimental model.
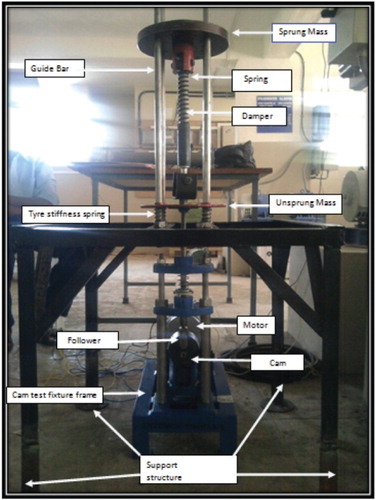
Plate 7. 2 DOF QC-PSS experimental test set-up. 1: Sprung mass plate; 2: unsprung mass plate with tyre springs; 3: shock absorber with spring and damper; 4: accelerometer 1 mounted on sprung mass; 5: accelerometer 2 mounted on unsprung mass; 6: cam and follower arrangement; 7: exciter mounting fixture.
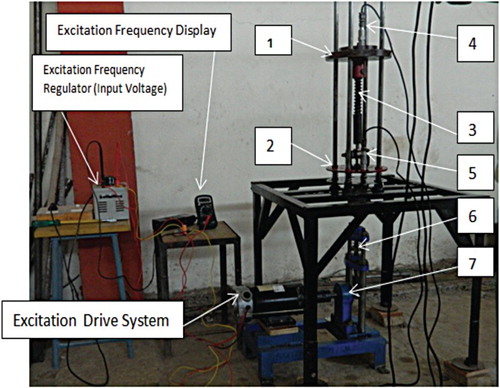
Plate 8. Hydraulic power pack.
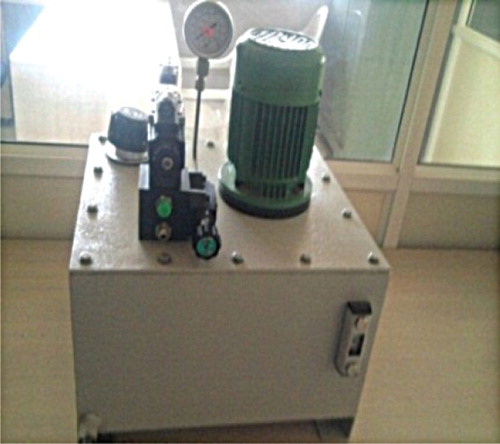
Plate 9. Hydraulic cylinder.
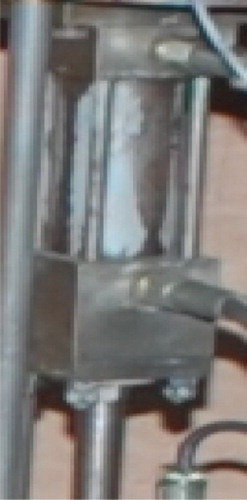
Plate 10. Hydraulic actuator added in QC-PSS to get QC-H-ASS.
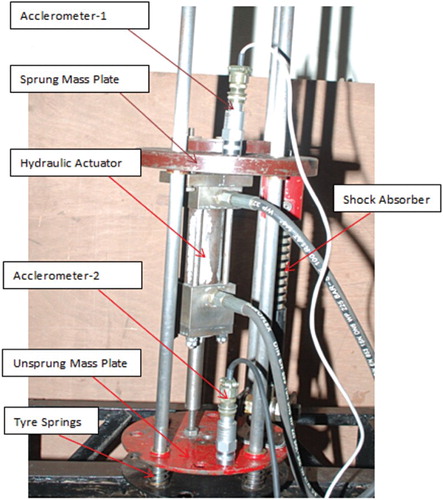
Plate 11. 2 DOF QC-H-ASS experimental model.
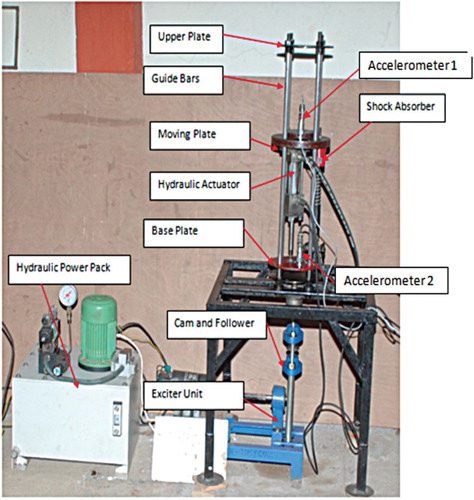
Plate 12. 2 DOF QC-H-ASS experimental test set-up. 1: Sprung mass plate; 2: hydraulic actuator; 3: accelerometer-1 mounted on sprung mass; 4: shock absorber with spring and damper; 5: accelerometer-2 mounted on unsprung mass; 6: unsprung mass plate with tyre springs; 7: exciter mounting fixture; 8: power pack with control instrumentation; 9: speed controlled DC motor drive; 10: cam and follower; 11: electric drive with gauges; 12: micro-controller; 13: computing system with DDS 2011 software; 14: software key lock; 15: ADASH 4 Channel FFT analyzer; 16: oscilloscope with instrumentation.
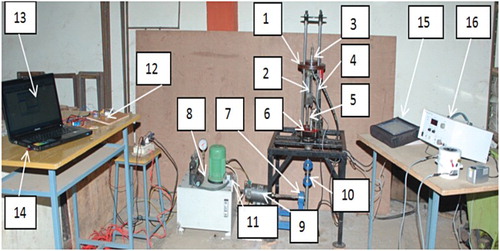
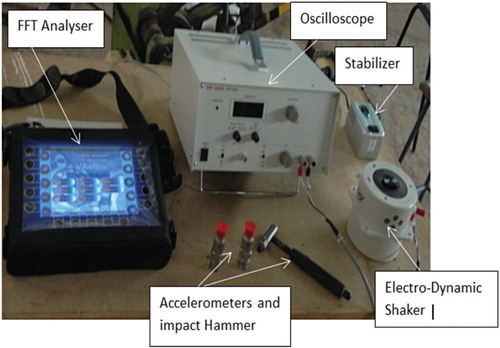
Plate 13. Instrumentation employed for experimental analysis of 2 DOF QC-PSS and 2 DOF QC-H-ASS.
With sprung mass ms=8 kg and suspension spring stiffness Ks=13, 900 N/m, the fundamental natural frequency wn, of the suspension system is obtained as Hz.
Considering the attachment details of sprung and unsprung masses, exciter system, for the sprung mass plate of 8.0 kg, the diameter of plate was taken as 215 mm with a thickness of 20 mm. Cold-drawn MS plate with circular cross section was selected. For the unsprung mass plate of 1.5 kg, with the diameter of 180 mm and a thickness of 5 mm, was selected. The base plate of 1.6 kg with 180 mm diameter and 5 mm thickness was used. Suspension spring of spring stiffness (Ks) 13,900 N/m and mean coil diameter of 23.5 mm was used.
To produce a good approximation for sinusoidal waveform by the exciter, a circular cam with an offset bore was selected. As such, an exciter system using the cam and follower, capable of generating the expected range of amplitude and frequency of excitation, has been developed.
To generate an excitation , a cam with 0.03 m peak to peak stroke is developed, as shown in . The round edge yoked cam follower, as shown in Plate 7, is selected. Plates 8 and 9 show, respectively, the exciter using the cam and follower system fixture with electric drive and view of exciter using the cam and follower system.
shows the suspension spring and viscous damper assembly. The value of the coefficient of viscous damping Cs was experimentally obtained as 518 Ns/m.
Thus the final experimental test set-up for 2 DOF QC-PSS has been developed as shown in with the parameter values given in .
Table 1. 2 DOF QC-PSS model parameters.
Experimental test set-up for 2 DOF QC-PSS
The physical prototype system of 2 DOF QC-PSS is developed, as shown in . This prototype is an assembly of a sprung mass, two linear springs, passive damper and motion sensors. The signals from the accelerometers on sprung and unsprung masses were acquired and processed by FFT analyzer.
shows, a typical 2 DOF QC-PSS model. The 2 DOF modelling strategy is selected as it is capable of capturing all the important dynamic response characteristics of the quarter-car model. The mechanism for road disturbance input was developed with the goal of driving the suspension system in the vertical direction. A cam–follower system is driven by a variable speed DC motor with control panel.
It was found that a circular cam with an offset bore would produce a very good approximation of a sinusoidal waveform when driving a load placed upon its surface. The cam had 0.03 m peak to peak stroke and it generated a waveform modelled as . The system ensures that the follower will always be in contact with the cam during the working of the set-up. A mounting plate along with the guide bars provides an arrangement for setting (i) a 2 DOF QC-PSS configuration or (ii) a 2DOF QC-H-ASS configuration.
Accelerometer 1 has been mounted on the sprung mass plate to measure the responses xs(t), ,
and the accelerometer 2 has been mounted on the unsprung mass plate to measure the responses
,
,
.
In the experimental set-up, a variable speed DC motor is connected to a cam and follower mechanism to provide harmonic base excitation at desired amplitude and frequency. It is mounted on a rigid cast iron base fixed on a firm concrete foundation.
shows the experimental test set-up developed to carry out the experimental analysis for 2 DOF QC-PSS.
Necessary instrumentation for obtaining time-based data for sprung mass displacement and base excitation and converting the same in graphical form, using FFT interfacing system has been developed and vertical displacement (xs(t) and , velocity (
and
and acceleration responses (
and
have been carried out respectively, for sprung and unsprung masses when excitation frequency was set at 41.63 rad/s, which is near the first natural frequency of the system and the curves of xs(t),
and
have been obtained using the state-of-the-art FFT analyzer.
Experimental results of 2 DOF QC-PSS
The peak value of xs(t) is 0.250 μm and that of is 0.5294 μm (see and (a) and 4(b)). The peak value of
is
mm/s and that of
is
mm/s (see and (a) and 5(b)). Similarly, peak value of
is
m/s2 and that of
is
m/s2 (see and (a) and 6(b)).
Figure 4. (a) xs(t) vs. time (the peak amplitude of vertical displacement of sprung mass is 0.25 μm). (b) xus(t) vs. time (the peak amplitude of vertical displacement of unsprung mass is 0.5294 μm).
Figure 5. (a) ẋs (t) vs. time (the peak amplitude of RMS velocity of sprung mass is 9.0×10⁻⁴ mm/s). (b) ẋus (t) vs. time (the peak amplitude of RMS velocity of unsprung mass is 31.0×10⁻⁴ mm/s).
Figure 6. (a) ߳xs (t) vs. time (the peak amplitude of RMS acceleration of sprung mass is 6.1×10⁻⁶ m/s2). (b) ߳xus (t) vs. time (the peak amplitude of RMS acceleration of sprung mass is 14.1×10⁻⁵ m/s2).
Table 2. Peak values of xs(t) and xus(t).
Table 3. Peak values of ẋs (t) and ẋus (t).
Table 4. Peak values of ߳xs (t) and ߳xus (t).
Using the values of xs(t) and from , the motion transmissibility ξm is obtained as 0.472. Second, using the values of
and
from , the velocity transmissibility ξv is obtained as 0.290. Similarly, using the values of
and
from , acceleration transmissibility ξa is obtained as 0.0432. To improve the response characteristics of 2DOF QC-PSS, an active element in the form of hydraulic actuator with its attendant instrumentation has been introduced between the sprung and unsprung masses to convert 2 DOF QC-PSS model to a 2 DOF QC-H-ASS model.
The QC-PSS model of has been modified to QC-H-ASS by adding a hydraulic actuator in parallel to passive suspension elements. Plates 10 and 11 show the 2 DOF QC-H-ASS model.
2 DOF QC-H-ASS model
shows the 2 DOF QC-H-ASS model.
Figure 7. 2 DOF QC-H-ASS model.
The construction of the QC-H-ASS model is similar to that of QC-PSS model except that the hydraulic actuator with its attendant control system is added in parallel to the spring and damper system in between the sprung and unsprung masses.
The hydraulic power pack along with all the connections and instrumentation is shown in . The power pack provides necessary pressure to a double-acting hydraulic cylinder, as per the requirement of the servo valve control signal. The specifications of the actuator are: internal diameter (di): 40 mm; stroke of the cylinder (L): 40 mm and piston rod diameter (dR): 22 mm.
The time derivative of the actuating force of the cylinder is given following CitationTamboli and Joshi (1999),
where Ap is the piston area, Cd1 is the discharge coefficient, Ctm is the leakage coefficient, Pl is pressure induced by load, Ps is supply pressure, u1 is the spool valve position, u2 is the bypass valve area, w is spool valve width,
is vertical velocity of sprung mass plate,
is vertical velocity of unsprung mass plate,
is the hydraulic coefficient and ρ is the specific gravity of the fluid.
Plates 10–12 show the details of the 2 DOF QC-H-ASS test set-up. gives the parameter values used for the experimental test set-up of 2 DOF QC-H-ASS.
Table 5. 2 DOF QC-H-ASS model parameters.
shows the detailed experimental test set-up for the analysis of 2 DOF QC-H-ASS.
Experimental test set-up for 2 DOF QC-H-ASS
shows the placement of the hydraulic cylinder with its flexible pipe connections.
In this case, a hydraulic actuator with all necessary hydraulic circuit elements, such as hydraulic power pack, valve and microcontroller system, etc. is added in parallel to the spring and damper in between the sprung and unsprung masses to improve the sprung mass response characteristics. The dimensions of the power pack are () mm3. The signals from the sensors were processed by a microcontroller, which controls the hydraulic actuator force.
The responses of the sprung mass ms and the unsprung mass mus, captured with two dedicated state-of-the-art accelerometers have been recorded, processed and analysed in a sophisticated four-channel ADASH FFT VA 4 Pro Analyzer, as shown in . (The data thus obtained have been further exported to the data acquisition software DDS 2011 for storage).
The experimental determination of the vertical displacement (xs(t) and ), velocity (
and
) and acceleration responses (
and
has been carried out, respectively, for sprung and unsprung masses when excitation frequency was set at 41.63 rad/s, which is near the first natural frequency of the system. And the curves of xs(t),
and
have been obtained using the state-of-the-art FFT analyzer.
Experimental results of 2 DOF QC-H-ASS
The peak value of xs(t) is 0.1609 μm and that of is 0.5294 μm (see and (a) and 8(b)). Also, the peak value of
is
mm/s and that of
is
mm/s (see and (a) and 9(b)). Similarly peak value of
is
m/s2 and that of
is
m/s2 (see and (a) and 10(b)).
Figure 8. (a) xs(t) vs. time (the peak amplitude of sprung mass is 0.1609 μm). (b) xus(t) vs. time (the peak amplitude of unsprung mass is 0.5294 μm).
Figure 9. (a) ẋs (t) vs. time (the peak value of velocity of sprung mass is 5.4×10⁻⁴ mm/s). (b) ẋus (t) vs. time (the peak value of velocity of unsprung mass is 8.0×10⁻⁴ mm/s).

Figure 10. (a) ߳xs (t) vs. time (the peak value of acceleration of sprung mass is 4.0×10⁻⁶ m/s2). (b) ߳xus (t) vs. time (the peak value of acceleration of unsprung mass is 14.1×10⁻⁵ m/s2).
Table 6. Peak values of xs(t) and xus(t).
Table 7. Peak values of ẋs (t) and ẋus (t).
Table 8. Experimental peak values of ߳xs (t) and ߳xus (t).
Discussion of results
(i) For the passive suspension system, using the values of xs(t) and
from , the motion transmissibility ξm is obtained as 0.472. Secondly, using the values of
(ii) Using the values of xs(t) and
From the values of sprung mass motion and acceleration transmissibilities as given in , ξm, and ξa, for 2 DOF QC-H-ASS are less than that for 2DOF QC-PSS showing the improvement in the suspension characteristics. Only the velocity transmissibility, ξv, has increased due to the added actuator dynamics.
Figure 11. Comparative displacement trends for 2 DOF QC-PSS.
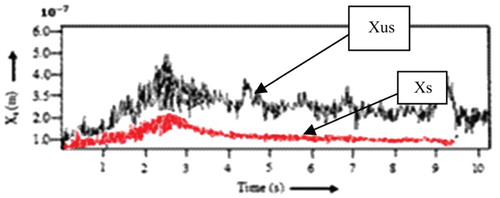
Figure 12. Comparative velocity trends for 2 DOF QC-PSS.
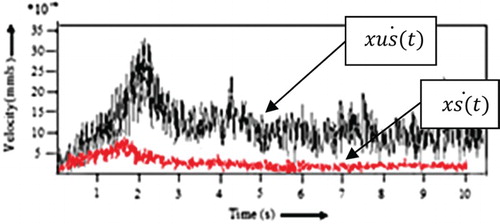
Figure 13. Comparative acceleration trends for 2 DOF QC-PSS.
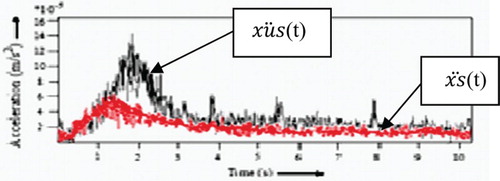
Figure 14. Comparative displacement trends for 2 DOF QC-H-ASS.
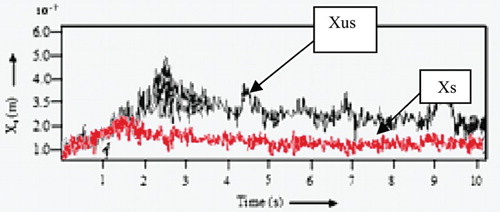
Figure 15. Comparative velocity trends for 2 DOF QC-H-ASS.
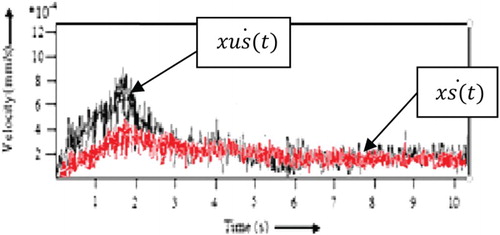
Figure 16. Comparative acceleration trends for 2 DOF QC-H-ASS.
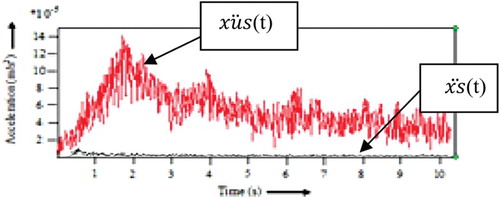
Table 9. Experimental analysis results.
Conclusions
In recent years, it is observed that the automotive designers are engaged in research and development of a state-of-the-art suspension system for road vehicles, such as cars, sedans, luxury buses, etc. The focus of their work is on the development of an active suspension system for such vehicles to provide maximum ride comfort to the occupants of the vehicle and ensure reliable operation by incorporating design features for better road holding, stability and manoeuvrability.
In the light of the above-mentioned objective, the experimental test set-ups for dynamic response analysis of (i) 2DOF QC-PSS and (ii) 2 DOF QC-H-ASS have been developed and the results for displacement, velocity and acceleration transmissibilities have been obtained (see ). The experimental determination of the vertical displacement (xs(t) and , velocity (
and
and acceleration responses (
and
have been carried out, respectively, for sprung and unsprung masses when excitation frequency was set at 41.63 rad/s and the curves of xs(t),
and
have been obtained using the state-of-the-art FFT analyzer.
From the values of sprung mass transmissibilities for displacement, velocity and acceleration, it is seen that the transmissibilities for displacement, velocity and the acceleration of sprung mass have marginally reduced when the suspension is passive. To improve the response characteristics of 2DOF QC-PSS, an active element in the form of hydraulic actuator with its attendant instrumentation has been introduced between the sprung and unsprung masses to convert 2 DOF QC-PSS model to 2 DOF QC-H-ASS. Thus the experimentation analysis for 2 DOF QC-H-ASS is also carried out and it is seen that the values of sprung mass transmissibilities ξm, ξv and ξa, for 2 DOF QC-H-ASS are less than that for 2DOF QC-PSS showing improvement in the suspension characteristics.
It is observed that the ride performance characteristics have improved considerably with the induction of active element in the form of hydraulic actuator in the 2 DOF QC-PSS. A hydraulic actuator has been used to provide the active force to the suspension system along with the electronic controller. It is seen that with this arrangement, sprung mass motion transmissibility has been reduced considerably, leading to increased ride comfort level. However, to improve the ride performance characteristics further, an active control strategy in the form of an electro-hydraulic servo valve with suitable controller can be set to obtain improved suspension behaviour. This work is being carried out by developing an experimental test set-up for a 2 DOF quarter-car electro-hydraulic active suspension system with backstepping control strategy.
References
- Anakwa, W. K. N., Thomas, D. R., & Jones, S. C. (2002). Development and control of a prototype pneumatic active suspension systems. IEEE Transactions on Education, 45, 43–49. doi: 10.1109/13.983220
- Bassam, A., Ahmad, A. F., & Mohamed, E. (1997). Optimal linear preview control of slow-active suspension systems. Proceedings of the 7th Saudi Engineering Conference(SEC7), Riyadh, pp. 1–11.
- Cao, D., Song, X., & Ahmadian, M. (2011, January–February). Editors’ perspectives: Road vehicle suspension design, dynamics, and control. Vehicle System Dynamics, 49(1–2), 3–28. doi: 10.1080/00423114.2010.532223
- Crolla, D. A. (1996). Vehicle dynamics – theory into practice. Proceedings of Institution of Engineers, 210, 83–94. doi: 10.1243/PIME_PROC_1996_210_250_02
- Karnopp, D. (1986). Theoretical limitations in active vehicle suspensions. Vehicle System Dynamics, 15, 41–54. doi: 10.1080/00423118608968839
- Koshkouei, A. J., & Burnham, K. J. (2008, July 6–11). Sliding mode controllers for active suspensions. The International Federation of Automatic Control, Seoul, Korea, pp. 3416–3421.
- Kulkarni, N. S., & Joshi, S. G. (2005, July). Optimization of a five-DOF road vehicle suspension and the hump for the comfortable ride and speed control. Journal of the Institution of Engineers (India): Mechanical Engineering Division, 86, 84–90.
- Mache, A. R., & Joshi, S. G. (2007). Theoretical and experimental dynamic response analysis of a road vehicle suspension system using electromagnetic damper. Proceedings of the International Conference on Advances in Machine Design and Industrial Automation, College of Engineering, Pune, pp. 144–149.
- Nagai, M. (1993). Recent researches on active suspensions for ground vehicles. JSME International Journal, Series C, 36(2), 161–170.
- Rajamani, R., & Hedrick, K. (1995). Adaptive observers for active automotive suspensions: Theory and experiment. IEEE Transactions on Control Systems Technology, 3(1), 86–93. doi: 10.1109/87.370713
- Senthil kumar, M. (2008). Development of active suspension system for automobiles using PID controllers. Proceedings of the World Congress on Engineering, II, London.
- Senthil kumar, M., & Vijayarangan, S. (2007). Analytical and experimental studies on active suspension system of light passenger vehicle to improve ride comfort. Mechanika, 3(65), 34–41.
- Sharp, R. S., & Crolla, D. A. (1987). Road vehicle suspension system design – a review. Vehicle System Dynamics, 16(3), 167–192. doi: 10.1080/00423118708968877
- Song, X., Ahmadian, M., & Southward, S. (2003). An adaptive semi-active control algorithm for vehicle suspension systems. Proceedings of ASME IMECE 2003: International Mechanical Engineers Conference, Washington, DC, pp. 1–9.
- Tamboli, J. A., & Joshi, S. G. (1999). Optimum design of a passive suspension system of a vehicle subjected to actual random road excitations. Journal of Sound and Vibration, 219(2), 193–205. doi: 10.1006/jsvi.1998.1882
- Wagner, J., & Liu, X. (2000). Nonlinear modeling and control of automotive vibration isolation systems. Proceedings of the American Control Conference, pp. 564–568.
- Yucheng, L. (2008). Recent innovations in vehicle suspension systems. Recent Patents on Mechanical Engineering, 1(3), 206–210. doi: 10.2174/2212797610801030206
- Zhang, Y., & Alleyne, A. (2005). A practical and effective approach to active suspension control. Vehicle System Dynamics, 43(5), 305–330. doi: 10.1080/00423110412331282869