
ABSTRACT
To develop accurate diagnostic techniques, this study examines the dynamic responses of spur gear transmission system with including frictional effects on a tooth mesh process. An 8-degree-of-freedom model is developed to include the effects of supporting bearings, a driving motor and a loading system. Moreover, it takes into account not only the time-varying stiffness, but also the time-varying forces and moments due to the frictional effect. The latter causes additional vibration responses in the direction of the off-line-of-action (OLOA). To show the quantitative effect of the friction, vibration responses are simulated under different friction coefficients. It shows that an increase in friction coefficient value causes a nearly linear increase in the vibration features of diagnostics. However, features from torsional responses and the principal responses in the line-of-action show less changes in the vibration level, whereas the most significant increasing is in the OLOA direction. Furthermore, the spectral peaks at the rotational and sideband frequencies are influenced significantly by small breakage defects, especially when the friction effect is taken into account. In addition, the second and third harmonics of the mesh frequency are more influenced than the first harmonic component for all motions, which can be effective features for both indicating lubrication deterioration and improving conventional diagnostic features.
Introduction
In order to achieve accurate diagnostics, a significant number of studies have been carried out on the modelling and simulation of gear dynamics. They have resulted in a wide variety of dynamic models available to predict the response of gear vibration in order to improve the current techniques of diagnosis and monitoring (Randall, Citation1982). Simulation can be very valuable for getting a better understanding of complex interaction between transmission components in a dynamic environment and hence improving machine diagnostics and prognostics. It helps to develop effective signal processing methods for characterizing complicated weak fault signatures contaminated by different noises (Jardine, Lin, & Banjevic, Citation2006). Therefore, different dynamic models for various gearbox systems were presented by Bartelmus (Citation2001), Bartelmus, Chaari, Zimroz, and Haddar (Citation2010), Begg, Byington, and Maynard (Citation2000), Begg, Merdes, Byington, and Maynard (Citation1999), Bliznyuk, Dadon, Klein, and Bortman (Citation2014), Bruns (Citation2011), and Van Khang, Cau, and Dien (Citation2004), in which both torsional and translational vibration responses of gears were studied as a tool for aiding gearbox diagnostic inferences.
Moreover, vibration relating to gear spalling or tooth breakage (TB) (Begg et al., Citation2000; Chaari, Baccar, Abbes, & Haddar, Citation2008; Jia & Howard, Citation2006; Lu, Gong, & Qiao, Citation2012), tooth crack (Chen & Shao, Citation2011; Mohammed, Rantatalo, & Aidanpää, Citation2015; Tian, Zuo, & Wu, Citation2012; Wu, Zuo, & Parey, Citation2008), tooth surface pitting and wear (Choy, Polyshchuk, Zakrajsek, Handschuh, & Townsend, Citation1994; Ding, Citation2007a, Citation2007b; Flodin, Citation2000) have been used to study these faults in terms of gear fault detection. In general, these models included both translation and rotational motions to show the fault effects on the gear dynamic characteristics. They stated that the gear mesh frequency and its harmonics with the presence of sidebands issued are sensitive to the fault degree and have been proved to be useful for tooth fault detection and localization (Gui, Han, Li, & Chu, Citation2014). However, most of the presented models ignored the time-varying friction effect because of more complicated model is needed (Bartelmus, Citation2001). Moreover, some researches reported that the friction between gear tooth contacts has a slight influnce on the gear fault detection (Mohammed et al., Citation2015), whereas ignoring frictional excitation may lead to less accuracy of diagnostic results.
In the meantime, sliding friction between the tooth surfaces has been reported to be one of the main sources of power loss in geared transmissions as well as a potential source of undesired vibration and noise (Diab, Ville, & Velex, Citation2006; Jiang, Shao, & Mechefske, Citation2014; Vaishya & Singh, Citation2001). A 6-degree-of-freedom (DOF) dynamic model of a spur gear pair influenced by friction was proposed in He, Cho, and Singh (Citation2008) and Kahraman, Lim, and Ding (Citation2007), which examined gear design modifications on the gear dynamic responses. Cheng-Zhong and Lie (Citation2010) and Howard, Jia, and Wang (Citation2001) presented a gear dynamic model to study the frictional effect on vibration characteristics of the gears, but they did not signify the friction effects precisely, especially on gear diagnostics.
This study develops a comprehensive model coupling with tooth friction and necessary transmission components, in order to increase the capability of providing accurate diagnostic determinations. Then a series of simulation studies are carried out to investigate the characteristics of vibration features when a gearbox is influenced by different frictional cases and different TBs. In particular, mesh components and their associated modulations will be examined in order to define effective and accurate vibration features for monitoring tooth surface defects and lubrication conditions. Moreover, the paper examines the influence of including frictional effects on the detection and diagnosis different TB severities.
Meshing model
Gear tooth meshing process
The relative contact motions between two compressed elastic bodies (gear teeth) are the origin of internal excitations of vibration in gearing. They result in contacting forces that act on both bodies with the same intensity but in opposite directions. Especially, these forces cause impacts at transitions of gear tooth meshing events within a mesh cycle. As shown in Figure , the transition can be determined from the un-deformed gear pair geometry. The line AB represents the line-of-action (LOA) between the tangential points of the base circle of the gears. There are four regions along AB due to the change of tooth pairs in contact. The actual zone of the LOA (LOA = CF) is represented as the line between the intersection of the addendum circle of pinion and gear with the line AB (points C and F). D and E are two points on the line AB such that CE = DF = pb, where pb is the base pitch of the gear tooth curve. Sections DP and PE are the single-tooth contact regions, while sections CD and EF are the double-tooth contact regions. The main geometric relations to describe the gear meshing process and simulating these regions in the gear dynamic model are given by:
(1)
(2)
(3)
Figure 1. Meshing process of spur gear pairs.
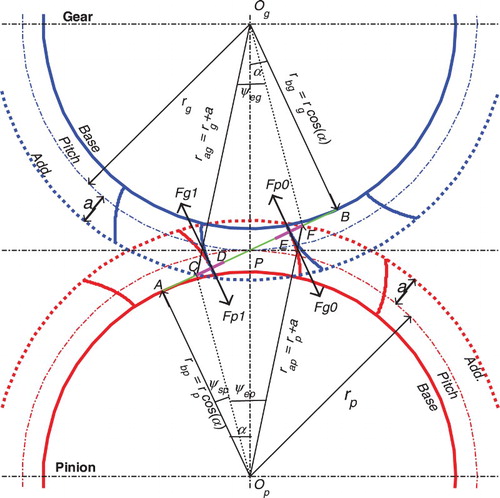
where α is the pressure angle and the ratio of the length of contact path to the base pitch is recognized as the contact ratio of a gear pair. The start angle of mesh cycle is named by ψsp while the end angle of LOA is ψep as illustrated in Figure . In addition, the time-varying moment arms ρp (t) and ρg (t) for the ith meshing pair can be found by:
(4)
(5)
where
(6)
(7)
mod(x, y) = x–y·floor(x/y) is the modulus function, if y ≠ 0, ωp and ωg are the nominal speeds in (rad/s). The sliding friction forces on each contact pair are denoted by Fp1, Fg1, Fp0, and Fg0, respectively. These forces affect gear rotations by frictional torques about the gear centres and excite the off-line-of-action (OLOA) gear translations significantly as it will be explained later in form of Ffi (t).
Varying meshing stiffness
The major variations in gear stiffness are caused by changes in meshing pair number. Spur gears have single-tooth and double-tooth meshing appearing alternately during the process of mesh (Shing, Citation1994). Since normal spur gears have a contact ratio of (1 < < 2) (Radzevich & Dudley, Citation1994), the meshing pair number is usually in the range between 1.0 and 2.0 (Cheng-Zhong & Lie, Citation2010; Kokare & Patil, Citation2014). In existing literature, the tooth meshing stiffness is simplified as a rectangular wave (Lin & Parker, Citation2002) based on the equal load sharing formulation, which proposed by Vaishya and Singh (Citation2001a, Citation2001b, Citation2003). The existing model considered the sudden changing in the meshing stiffness value by a periodic square wave function at every stage. It makes the single-tooth meshing and the double-tooth meshing appears alternately and changes suddenly during the mesh transitions.
Figure (a) explains the various positions of gear tooth meshing events for identical spur gears. The dynamic model considers the pair of spur gears as two rigid disks coupled along the LOA through a time-varying mesh stiffness Km (t) and damping Cm (t) (Kokare & Patil, Citation2014). The mesh contact cycle starts from the angle ψsp at point C, denotes as the starting point of contact, where the addendum circle diameter of the gear intersects the LOA. The mesh period of double pair tooth contact (Mdouble) begins when pair 1 contact at point C, whereas pair 0 is already in contact at point E, which is denoted as the ending point of single-tooth contact. As the gears rotate, within the angle ψep, the points of contact move along the LOA CF. When the pair 1 reaches the point D (the starting point of single-tooth contact), pair 0 disengages at point F (the finishing point of the mesh cycle) and leaves only the pair 1 in the single contact zone (Msingle). In addition, while pair 1 reaches to point E, the next tooth pair engages at point C which starts another mesh cycle. Finally, when pair 1 rotates to point F, one meshing cycle is completed.
Figure 2. Mesh stiffness regions of meshing gear pair in one period.
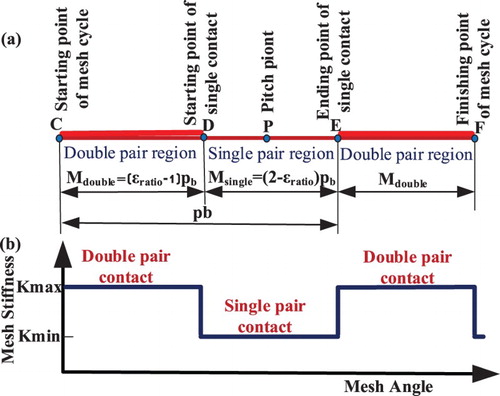
Therefore, the meshing process leads to mesh stiffness that vary with time as illustrated in Figure (b). The typical variation of gear mesh stiffness Km (t) depends on the mesh position of the teeth engagement to separation, in which the mesh stiffness of one tooth pair in mesh is calculated based on (Chen & Shao, Citation2011; Mohammed, Rantatalo, & Aidanpää, Citation2013; Wang et al., Citation2015)
(8)
where kb, ks, ka, are the bending, shear, axial stiffness of the gear tooth, respectively. Moreover, kh is the Hertzian contact stiffness and kf is the tooth root fillet stiffness. The subscripts 1, 2 mean the pinion and gear, respectively.
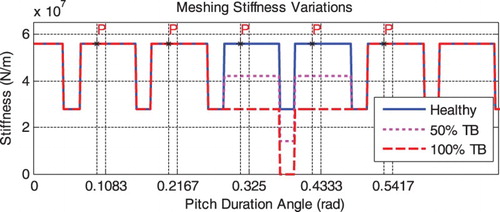
However, loss of tooth is reflected by a qualitative proportional reduction of tooth’s stiffness, relating to its damage (Chaari et al., Citation2006, Citation2008; Walha, Louati, Fakhfakh, & Haddar, Citation2005). TB is a common tooth fault, which is simulated by taking into account the geometric changes due to the fracture severity. The width of contact changes at the defect location, which causes a decrease of the contact zone between teeth in contact and an increase in deflection (Chaari et al., Citation2008). Figure shows the time varying of meshing stiffness with different TB severities. The gear meshing stiffness is interrupted by the faulty tooth, which can cause additional impacts between the driven and driving gears.
Figure 3. Time-varying mesh stiffness variations with different TB severities.
Varying friction excitations between tooth surfaces
Friction forces and the nonlinearity excitation between tooth contact surfaces are another considerable sources of vibration (Kahraman et al., Citation2007). Due to the velocity reversion at pitch point, friction can be associated with a large oscillatory component due to high forces in the sliding direction. The sliding velocity for each tooth pair in contact can be derived from meshing kinematics and oscillating torsional motion of the gear and pinion. This dependency upon the implicit nonlinearity of vibrating velocity in the gear dynamic system (Vaishya & Singh, Citation2001).
The normal contact force and the friction force between pair of gears can be calculated according to Jia, Howard, and Wang (Citation2003), which is modelled as the combination of linear elastic and damping forces as shown in Figure (a),
(9)
where i = 0, 1 denoting meshing tooth pair 0 and pair 1, respectively. The contact force acts along the LOA, which connects the base circles of the pinion and gear The surface friction generated between the meshing tooth surfaces is proportional to the contact force, which acts on the OLOA and thus can be obtained by:
(10)
Figure 4. Variation of normal contact forces, friction forces and frictional torque with the pitch period.
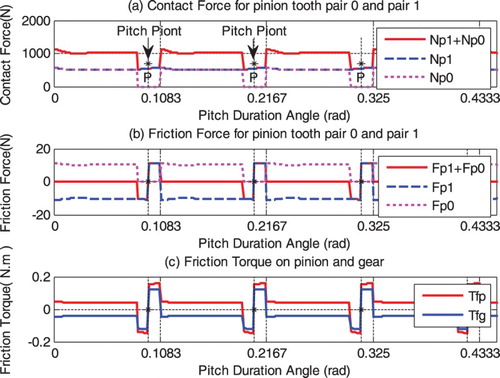
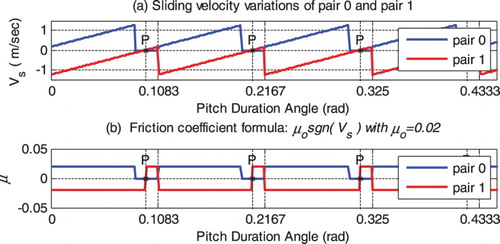
The dynamic friction formulation is modelled as a time-varying parameter; as shown in Figure (b). The friction coefficient (μ) formula of tooth surface is assumed to be constant; however it changes its sign with the direction of the relative sliding velocity, that is
(11)
where, Vs refers to the sliding velocity at the contact point of interest. The sliding velocity is considered as the difference between surface velocities at each contact point. For ith gear pair, its sliding velocity is:
(12)
For individual gear and pinion, ρ (t) and ω are the radius of curvature of the corresponding contact point and the angular velocity of precise gear, respectively. Hence, the friction moment of the pinion and gear is produced by the tooth friction forces Ffi (t) and friction arms ρi (t):
(13)
The direction of friction torque is dependent on the instantaneous sliding velocity and the contact point location as illustrated in Figure (c). In general, both the friction force and torque exhibit significant changes around the pitch points and hence would cause considerable influences on overall vibration responses.
Friction coefficient
Many aspects affect friction coefficient μ because of complex lubricating mechanisms in gearing. Different empirical formulae were proposed to estimate the friction coefficient (Xu, Citation2005). However, these empirical formulae for μ valid within certain range of key system parameters. They are not general and often represent certain lubricants, operating temperatures, speed and load ranges, and surface roughness conditions of roller specimens that might differ from those of the actual gear pair of interest (Xu, Citation2005).
In general, the theoretical friction coefficient is derived from elasto-hydrodynamic lubrication and tribology theory, however several experimental works show that a constant friction coefficient is acceptable for dynamic analysis as indicated in (Liu, Citation2007; Rebbechi, Oswald, & Townsend, Citation1996; Velex & Cahouet, Citation2000). Benedict and Kelley’s empirical equation shows that the coefficient of friction can vary between 0.03 and 0.1 (He, Gunda, & Singh, Citation2007). Furthermore the value of 0.1 or even values as high as 0.2 are commonly used in several gear dynamic models as explained by (Liu, Citation2007). To get meaningful values of μo, the variation from 0.0 to 0.2 have been used in this study to simulate the Coulomb friction effect.
The friction coefficient function is determined by the direction of the sliding velocity as represented in Equation (11). The variation in sliding velocity (Equation (12)) can be shown in Figure (a), which exhibit a saw-tooth profile during the mesh period. The straight line variations are due to the linearly varying distances of the radius of curvature ρp (t) and ρg (t). The direction of Vs govern the friction at the tooth surface, which act in opposite directions on the two pairs and reverses their directions when the zone of contact passes through the pitch point (Vaishya & Singh, Citation2003). A constant friction coefficient (μo = 0.02) is represented in Figure (b). It can be seen that μ varies significantly with gear rotation due to the constant changing of lubrication conditions between the contact teeth (He et al., Citation2007), which gives an effective simulation to the friction coefficient during the meshing process.
Figure 5. Sliding velocity and friction coefficient signals of pair0 and pair1 during the mesh process.
Dynamic model and solution method
Gear dynamic model
The baseline model adopted in this research is based on the one developed and subsequently modified by (Kahraman et al., Citation2007) and (He et al., Citation2008). They presented their models in terms of studying the influence of tooth modifications on gear dynamic behaviour.
However, to represent gear transmission more accurately, the model is improved to take into account the effects of speed-torque characteristics of motor driving systems. As shown in Figure , the model is an 8-DOF nonlinear model. The pinion and gear, denoted with subscripts 1 and 2, respectively, have translational motions and rotational motions. As shown by the geometric specification in Table , the gear system is a speed increaser, which is the same configuration as wind turbine applications.
Figure 6. Schematic diagram of gear dynamic model with friction.
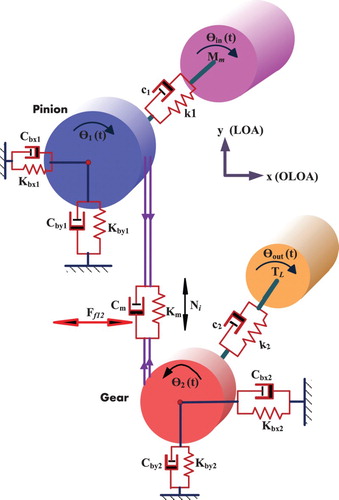
Table 1. Geometric property of the meshing gears.
The pinion and gear are coupled by a spring having time-varying mesh stiffness Km (t) and a varying mesh damping Cm (t). The model includes four inertias, namely load, motor, pinion and gear. The torsional compliances of shafts and the transverse compliances of bearings combined with those of shafts are included in the model. The resilient elements of supports are described by stiffness and damping coefficients Kx1, Kx2, Cx1 and Cx2 for the pinion and gear, respectively, in the OLOA direction, besides Ky1, Ky2, Cy1 and Cy2 in the LOA direction. The shafts between the input motor, output loading motor and the gears are represented by torsional stiffness and torsional damping components k1, k2, c1 and c2. Moreover, the model takes into account the influence of torque Tm and TL as the driving torque and load torque, respectively. The transverse vibrations of the gears are considered along LOA and OLOA. The equations of motions are arranged into the state space formulation based on vibration analysis and then with MATLAB operation supported by ODE solver. The governing equations of motion of the model depicted in Figure are written with following key assumptions:
Pinion and gear are modelled as rigid disks;
Applying input torque and applied load to the system;
Shaft mass and inertia are lumped at the gears;
Coulomb friction is assumed with a constant coefficient of friction μo;
Manufacturing and assembly errors are ignored;
Static transmission error effects are neglected;
Backlash is not considered in this model.
According to the Newtonian law the equations of the motion are for the motor rotor, pinion rotation, gear rotation, Y-direction of pinion and gear translations, X-direction of pinion and gear translations and load rotor, respectively:
(14)
(15)
(16)
(17)
(18)
(19)
(20)
(21)
(22)
Equation (22) is used to adjust the motor input torque to maintain its speed as constant as possible. Especially, additional static torque is needed in order to balance the torque due to friction effects. This toque adaptation is to simulate the speed-torque characteristics for a common induction motor used widely. So that, a slight change in the motor parameters will be predicted as it will explain later.
Solution procedure
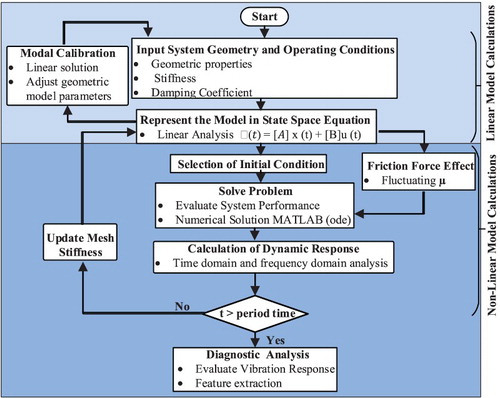
A numerical simulation study was performed to obtain the solution of the nonlinear equations. However, to ensure the correctness of parameters used and model structures, linear solutions were obtained when an average meshing stiffness value is used in the model without fiction influences, which allows the adjustment of the model parameters so that major resonances agree with the real system which is a commercial industrial gearbox that is based on to simulate the vibration systems. Subsequently, the nonlinear effects of varying friction and mesh stiffness have been applied to the model and numerical integration method is used to solve the model. The variations of the gear vibration responses are examined for different friction coefficient values. More details of the simulation procedure used in this study are summarized in a flowchart shown in Figure .
Figure 7. A simulation procedure used in this study.
Modal calibration
Liner solution
A simplified linear version of this model is developed by using the average mesh stiffness value in Equations (15)–(19). It allows modal parameters including resonance frequencies and damping ratios to be found conveniently using the standard eigen method. By considering linear factors of the system, the vibration differential equation is expressed as:
(23)
(24)
where, q is the vibration response vector consisting of displacements, velocity and acceleration of the system. f(t) is the system excitation load. [M] is the mass matrix, [C] is the damping matrix and [K] is the stiffness matrix, which can be extracted as:
(25)
(26)
(27)
Using standard method for linear system analysis, the frequency response can be obtained conveniently under different parameter settings. Figure shows the system responses with refined parameters, in which the pinion velocity is excited to extract all modes of the system. It can be seen that the 1st mode is at 128 Hz which is 4 times away from the shaft frequency at about 25 Hz. The third and fourth modes are close to the second harmonic ().
Figure 8. Frequency responses of gear system excited with impulsive inputs at the pinion and gear.
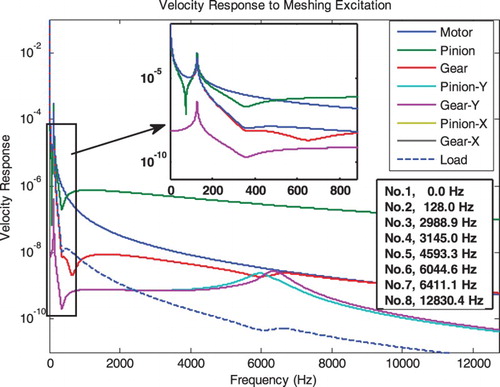
To maintain the solution stability in the case of solving the nonlinear equations, these modes are applied with high damping ratios so that the frequency responses around these frequency ranges are relatively flat. Also note that there is no response in X-directions as there is no friction effect included in the linear mode. Moreover the frequency responses are similar to that of measurements from the gearbox installed in the lab. It shows that the key parameters such as tooth stiffness values and damping ratios are used appropriately and numerical solutions can be proceeded to obtain the nonlinear responses.
Nonlinear solution
The time domain behaviour of the nonlinear system is obtained by integrating the set of governing differential equations numerically using an ode15s Runge–Kutta algorithm with a fixed time step size. This solver is suitable for solving differential algebraic stiff problems with a mass matrix and when, whereas high fluctuations and large noises are in the solution with ode45. Moreover, ode45 is very slow and the results take a significant amount of time. An appropriate set of initial conditions was applied to integrate the problem. The operating conditions of the system observed convergent responses corresponding to the constant speed of interest.
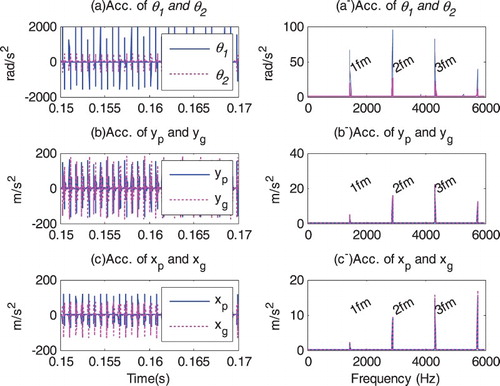
Figure presents acceleration responses in the time domain and frequency domain for a case with friction included. In the time domain, all the responses including pinion and gears in rotations (θ1, θ2), translations in the LOA (yp, yg) and OLOA (xp, xg) directions exhibit periodic profiles following stiffness changes, which is confirmed in the frequency domain in which the spectral peaks are observed at the gear mesh frequency and its higher order harmonics. This spectral pattern is of typical for gear vibrations. However, because of the effect of resonances, the amplitudes at the higher order harmonics are higher than the fundamental one. For the same reasons, the rotational response of the pinion is higher than that of the gear, which is also seen in the frequency response characteristics.
Figure 9. Vibration responses in the time domain and frequency domain.
Simulation results and discussion
Speed and transmission power
Having confirmed that the general solution of the system is close to reality, simulation studies were performed under a successive increment of friction coefficients µo from 0 and 0.2 which is the range explored in previous studies. The operating conditions were kept exactly the same for different values of the coefficients. The load torque is TL = 29.2 Nm, which corresponds an input motor torque Mm = 36 Nm at the speed of 1485 rpm.
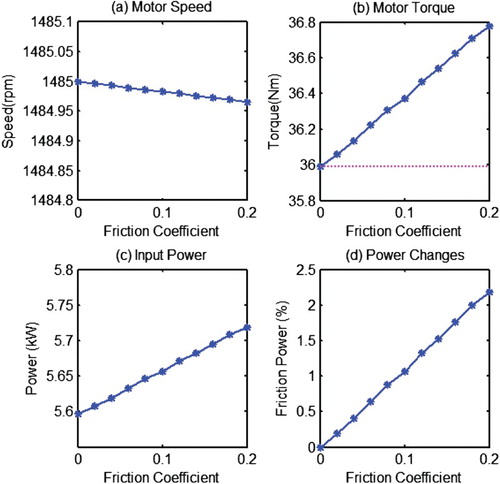
For realistic model solution, an adaptation toque (Equation (22)) is employing to determine the speed-torque characteristics over a range of operational conditions. Figure shows the change of employing operating parameters with friction coefficient. It can be seen that there is a slight drop in the speed but a significant increase in the input torque. It means that with more friction effect, more input power is required to maintain the speed as close as to the setting point. However, because of the torque adaptation of Equation (22) used, the speed has such a slight dropping. Moreover, it is observed that there is a nearly linear increase in the motor power and the maximum change is 2.18%. It is clear that power measurement can be used for indicating lubrication degradation. These changes in operating conditions show that the model prediction is consistent with real operations and hence the vibration responses can be examined realistically.
Figure 10. Effect of friction on motor operating parameters.
Vibration responses
Commonly, accelerations are measured for monitoring machine vibration characteristics. So the numerical solutions are converted into accelerations by differentiating the velocity responses. In addition to calculating the root mean squared (RMS) values for examining changes in overall vibration levels, spectral amplitudes at meshing frequencies are also extracted from the spectra of the acceleration responses in order to obtain a quantities assessment of frictional effect on default diagnostic features. As shown in Figure , RMS values for nearly all vibration signals show a monotonous increase, which is consistent with that of previous studies for noise excitation. However, because of the effect of nonlinearity, the response of the gear rotation exhibit quadratic nonlinear increase. In general, the vibration response increases with friction. Therefore, higher vibration levels may indicate that the lubrication condition is poorer.
Figure 11. RMS of acceleration signals in rotation and translation transverse for pinion and gear.

Vibration at mesh frequency
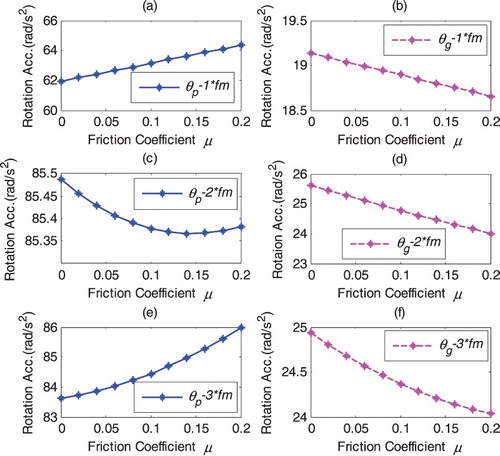
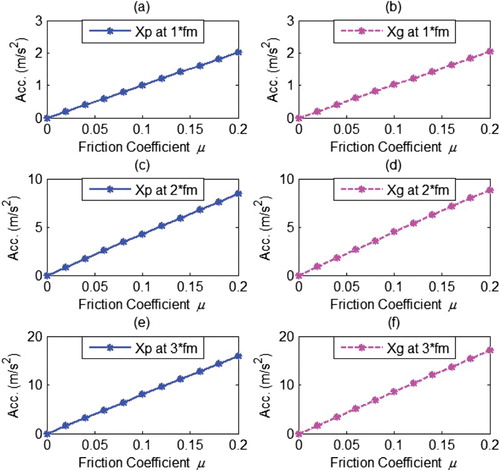
For more detailed and accurate friction diagnosis, the change of spectral amplitudes usually indicates the gearbox conditions. Figure presents the first three harmonic components of rotational responses for the meshing frequency. It can be seen that they behave diversely. The first and the third harmonics on the pinion show a nearly linear increase trend with friction, which can be based on the friction effect indicator. However, due to the nonlinear responses, the three components of the gear show inverse change and may not be so direct to be taken as good indicator for frictional influences.
Figure 12. Rotation responses at mesh frequency with friction.
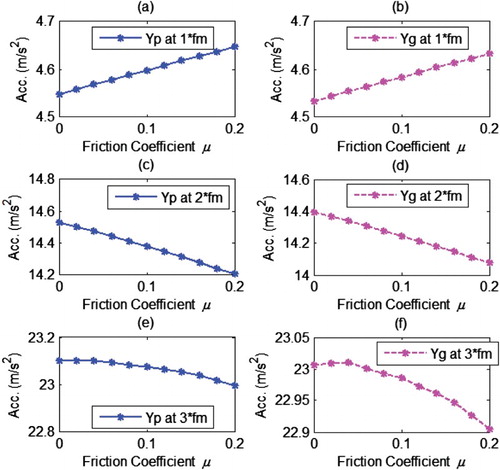
In the same way the nonlinear response also causes the second and the third harmonic components of the translational responses in Y-direction to decrease with increasing in friction, as showing in Figure . However, the first harmonic increases with the friction coefficient and hence can be based on to indicate the change of friction due to lubricant degradation.
Figure 13. Spectral peaks of translation responses in Y-direction (LOA).
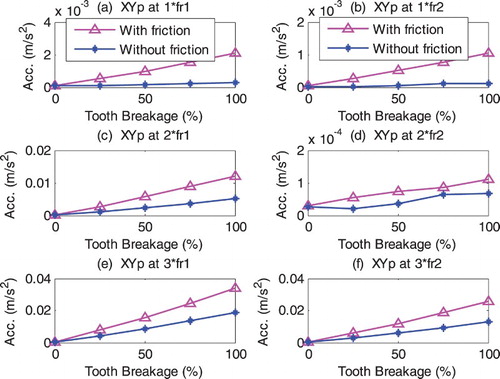
From Figures and , the effect of friction on the rotational and LOA components seems to be complex and a small change can be identified, which is consistant with (Mohammed et al., Citation2015). As a consequence, many researches have been ignored the frictional effects. However, For the translation responses in X-direction, all harmonic components exhibit significant increase trend as showing in Figure , that is proportional to the friction coefficient. Therefore, any of them can be used for lubrication condition monitoring.
Figure 14. Spectral peaks of translation responses in X-direction (OLOA).
Moreover, the amplitude of increase is more significant, compared with the changes in the Y-direction. Therefore, the combination of the responses in two directions could result in an overall increase trend, which represents the real measurement values perceived by a sensor on the housing of a gearbox. Figure is the combined responses obtained by , providing that the frequency response of housing is in the linear range. It can be seen that the entire three component exhibit as a monotonous increase with friction and it can be effective indictors for the friction. Additionally, as the change is tiny for the small friction coefficients, it means that vibration responses measured on the housing are relatively stable for good lubrication conditions. In other words, diagnostic features for other fault such as TBs are also stable for obtaining a reliable severity diagnostic result. In the meanwhile, the diagnostic features will be further enlarged by poor lubrications, which is helpful to detect incipient tooth problems.
In addition, the combined responses also show that the difference of the responses between the pinion and gear is very close, which means that the measurement at a position near either to the pinion or the gear will produce the same results.
Figure 15. Spectral peaks of combined translation responses.
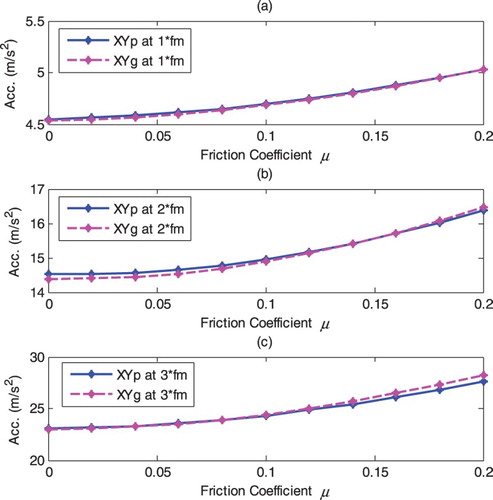
Figure 16. Translation spectrum responses of healthy and one TB with and without frictional effect.
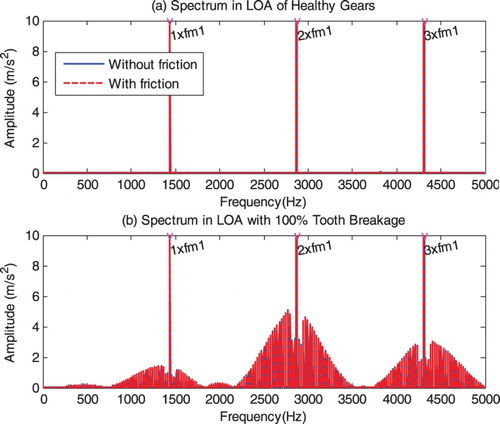
Figure 17. Spectral peaks at the sideband frequencies of the meshing frequency harmonics.
Effect of friction on the diagnostics of TB fault
As the TB is one of the common failures in the gears, the main objective of this section is to evaluate the effect friction on the fault diagnostic features in an early stage of its development. Different degrees of the TB: 0%, 25%, 50%, 75% and 100% of a tooth width are simulated with and without influence of friction. The coefficient of friction is assumed to be constant with a value of 0.1, which is the mean value to that considered by Howard et al. (Citation2001) and Parey and Tandon (Citation2003).
Figure shows the spectrum compassion of translational responses for the health and 100% breakage cases between friction-free and friction inclusion. The effect of friction on TBs gives higher amplitude responses during the rotation of the gears whereas sideband frequencies around the meshing frequency components are the most sensitive to the fault degree. In addition, higher amplitudes in the spectrum can be observed when the frictional effect is included in the model, which can provide useful information for an early diagnosis of tooth damage.
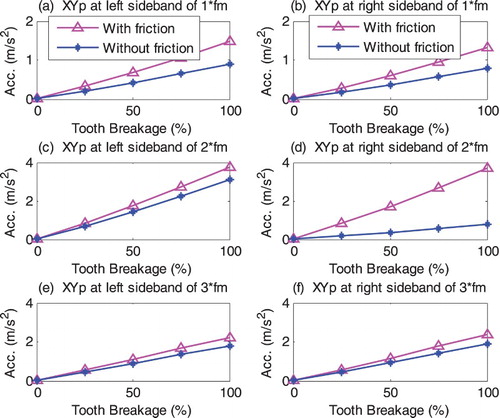
The dynamic response computed with the analytical stiffness shows that the dominance of the gear mesh frequency and its harmonics with the presence of sidebands issued from the amplitude modulation caused by the stiffness fall (Chaari et al., Citation2008). The spectral peaks of the combined translational responses at the lower and higher sidebands () around the first three harmonics of the meshing frequencies are shown in Figure . It can be seen that the sideband peaks are generally increased with the TB severity. However, the most significant increase is identified when the friction effect is involved in the model. There is more than 1% difference between the two models in each developing degree of the tooth damage. The vibration response at the sideband frequencies shows more influential increase by the TB when the friction effect is simulated, which can give more effective features for the diagnostics of TB.
The amplitude of vibration signal at the rotation frequencies is also used to evaluate the effect of TB on the gear transmission responses. It can be seen that a general increase in the amplitudes of the vibration responses for each increment, especially when friction is considered in the model. In the same way, the amplitudes of the combined translational responses are extracted from the spectra of the dynamic model with and without friction effect as shown in Figure . There is about 3% more increase in the amplitudes between the two models, whereas the vibration response at the rotation frequency with friction effect is more influential than without friction. As a result, the rotation frequency is also influenced by friction, which can give a good indication if it is used for diagnostics TB fault.
Figure 18. Spectral peaks at the rotation frequencies.
Conclusion
The dynamic model coupling with tooth friction produces consistent vibration responses to the change in friction due to lubrication degradation. The linear response is used to calibrate the model parameters, by including resonance frequencies and damping ratios to be convenient with an industrial gearbox. The model shows that there is an increase up to 2.18% in power consumption due to friction coefficient change, which leads to additional resistive frictional torque. However, the maximum increase of vibration responses in the spectral peaks can be more than 100%. These show that it is much easier to use vibration responses to monitor the power consumption directly. Both rotational responses and translational responses of vibration can be effective indicators for lubrication conditions, but the translational one is more sensitive even though the rotational responses are generally more nonlinear.
The spectral peaks of vibration response at the characteristic rotational and sideband frequencies are considered to diagnose different TB severities in the light of the impulsive sources from frictional excitations. The results show more influential increase in spectral peaks at these features when the friction effect is included. In addition, these features are also significantly increased with different TB severities when friction is considered in the model. Therefore, frictional effects should be taken into account of vibration analysis if it is to be an accurate method for the detection and diagnosis.
Disclosure statement
No potential conflict of interest was reported by the authors.
Additional information
Funding
References
- Bartelmus, W. (2001). Mathematical modelling and computer simulations as an aid to gearbox diagnostics. Mechanical Systems and Signal Processing, 15(5), 855–871. doi: 10.1006/mssp.2001.1411
- Bartelmus, W., Chaari, F., Zimroz, R., & Haddar, M. (2010). Modelling of gearbox dynamics under time-varying nonstationary load for distributed fault detection and diagnosis. European Journal of Mechanics-A/Solids, 29(4), 637–646. doi: 10.1016/j.euromechsol.2010.03.002
- Begg, C. D., Byington, C. S., & Maynard, K. P. (2000). Dynamic simulation of mechanical fault transition. Proceedings of the 54th meeting of the society for machinery failure prevention technology, Virginia Beach, VA.
- Begg, C. D., Merdes, T., Byington, C., & Maynard, K. (1999). Dynamics modeling for mechanical fault diagnostics and prognostics. Conference proceeding on Maintenance and Reliability (MARCON 99), Gatlinburg, Tennessee, May 10–12, 1999.
- Bliznyuk, A., Dadon, I., Klein, R., & Bortman, J. (2014). Gear diagnostics–fault type characteristics. Annual conference of the prognostics and health management society.
- Bruns, C. J. (2011). Dynamic gearbox simulation for fault diagnostics using a torque transducer. West Lafayette, IN: Master of Science in Mechanical Engineering, Purdue University.
- Chaari, F., Baccar, W., Abbes, M. S., & Haddar, M. (2008). Effect of Spalling or tooth breakage on gearmesh stiffness and dynamic response of a one-stage spur gear transmission. European Journal of Mechanics-A/Solids, 27(4), 691–705. doi: 10.1016/j.euromechsol.2007.11.005
- Chaari, F., Fakhfakh, T., & Haddar, M. (2006). Dynamic analysis of a planetary gear failure caused by tooth pitting and cracking. Journal of Failure Analysis and Prevention, 6(2), 73–78. doi: 10.1361/154770206X99343
- Chen, Z., & Shao, Y. (2011). Dynamic simulation of spur gear with tooth root crack propagating along tooth width and crack depth. Engineering Failure Analysis, 18(8), 2149–2164. doi: 10.1016/j.engfailanal.2011.07.006
- Cheng-Zhong, G., & Lie, C. (2010). Effects of teeth surface friction on the vibration of gear transmission. 2nd international conference on, IEEE, Mechanical and Electronics Engineering (ICMEE), TBD, Kyoto, Japan, August 01–03, 2010.
- Choy, F., Polyshchuk, V., Zakrajsek, J., Handschuh R., & Townsend, D. (1994). Analysis of the effects of surface pitting and wear on the vibrations of a gear transmission system. DTIC Document.
- Diab, Y., Ville, F., & Velex, P. (2006). Investigations on power losses in high-speed gears. Proceedings of the Institution of Mechanical Engineers, Part J: Journal of Engineering Tribology, 220(3), 191–198. doi: 10.1243/13506501JET136
- Ding, H. (2007a). Dynamic wear models for gear systems (PhD thesis). The Ohio State University, Ohio.
- Ding, H. (2007b). A study of interactions between dynamic behavior of gear systems and surface wear (PhD thesis). The Ohio State University, Ohio.
- Flodin, A. (2000). Wear of spur and helical gears (Doctoral thesis). Royal Institute of Technology, Stockholm.
- Gui, Y., Han, Q., Li, Z., & Chu, F. (2014). Detection and localization of tooth breakage fault on wind turbine planetary gear system considering gear manufacturing errors. Shock and Vibration, 2014, 13. doi: 10.1155/2014/692347.
- He, S., Cho, S., & Singh, R. (2008). Prediction of dynamic friction forces in spur gears using alternate sliding friction formulations. Journal of Sound and Vibration, 309(3), 843–851. doi: 10.1016/j.jsv.2007.06.077
- He, S., Gunda, R., & Singh, R. (2007). Effect of sliding friction on the dynamics of spur gear pair with realistic time-varying stiffness. Journal of Sound and Vibration, 301(3), 927–949. doi: 10.1016/j.jsv.2006.10.043
- Howard, I., Jia, S., & Wang, J. (2001). The dynamic modelling of a spur gear in mesh including friction and a crack. Mechanical Systems and Signal Processing, 15(5), 831–853. doi: 10.1006/mssp.2001.1414
- Jardine, A. K., Lin, D., & Banjevic, D. (2006). A review on machinery diagnostics and prognostics implementing condition-based maintenance. Mechanical Systems and Signal Processing, 20(7), 1483–1510. doi: 10.1016/j.ymssp.2005.09.012
- Jia, S., & Howard, I. (2006). Comparison of localised spalling and crack damage from dynamic modelling of spur gear vibrations. Mechanical Systems and Signal Processing, 20(2), 332–349. doi: 10.1016/j.ymssp.2005.02.009
- Jia, S., Howard, I., & Wang, J. (2003). The dynamic modeling of multiple pairs of spur gears in mesh, including friction and geometrical errors. International Journal of Rotating Machinery, 9(6), 437–442. doi: 10.1155/S1023621X03000423
- Jiang, H., Shao, Y., & Mechefske, C. K. (2014). Dynamic characteristics of helical gears under sliding friction with spalling defect. Engineering Failure Analysis, 39, 92–107. doi: 10.1016/j.engfailanal.2014.01.008
- Kahraman, A., Lim, J., & Ding, H. (2007). A dynamic model of a spur gear pair with friction. Proceedings of the 12th IFToMM World congress, Besançon, France, June 18–21, 2007.
- Kokare, D., & Patil, S. (2014). Numerical analysis of variation in mesh stiffness for spur gear pair with method of phasing. International Journal of Current Engineering and Technology, 156–159. Retrieved from http://inpressco.com/wp-content/uploads/2014/04/Paper32156-159.pdf
- Lin, J., & Parker, R. G. (2002). Mesh stiffness variation instabilities in two-stage gear systems. Journal of Vibration and Acoustics, 124(1), 68–76. doi: 10.1115/1.1424889
- Liu, G. (2007). Nonlinear dynamics of multi-mesh gear systems (PhD thesis). The Ohio State University, Ohio.
- Lu, D., Gong, X., & Qiao, W. (2012). Current-based diagnosis for gear tooth breaks in wind turbine gearboxes. Energy Conversion Congress and Exposition (ECCE), 2012 IEEE. Lincoln, NE: University of Nebraska-Lincoln.
- Mohammed, O. D., Rantatalo, M., & Aidanpää, J.-O. (2013). Improving mesh stiffness calculation of cracked gears for the purpose of vibration-based fault analysis. Engineering Failure Analysis, 34, 235–251. doi: 10.1016/j.engfailanal.2013.08.008
- Mohammed, O. D., Rantatalo, M., & Aidanpää, J.-O. (2015). Dynamic modelling of a one-stage spur gear system and vibration-based tooth crack detection analysis. Mechanical Systems and Signal Processing, 54, 293–305. doi: 10.1016/j.ymssp.2014.09.001
- Parey, A., & Tandon, N. (2003). Spur gear dynamic models including defects: A review. The Shock and Vibration Digest, 35(6), 465–478. doi: 10.1177/05831024030356002
- Radzevich, S. P., & Dudley, D. W. (1994). Handbook of practical gear design. Boca Raton, FL: CRC Press.
- Randall, R. (1982). A new method of modeling gear faults. Journal of Mechanical Design, 104(2), 259–267. doi: 10.1115/1.3256334
- Rebbechi, B., Oswald, F. B., & Townsend, D. P. (1996). Measurement of gear tooth dynamic friction. NASA Technical Memorandum 107279, Seventh International Power Transmission and Gearing Conference, San Diego, California, October 6–9, 1996.
- Shing, T.-K. (1994). Dynamics and control of geared servomechanisms with backlash and friction consideration (PhD thesis). University of Maryland, College Park, MD.
- Tian, Z., Zuo, M. J., & Wu, S. (2012). Crack propagation assessment for spur gears using model-based analysis and simulation. Journal of Intelligent Manufacturing, 23(2), 239–253. doi: 10.1007/s10845-009-0357-8
- Vaishya, M., & Singh, R. (2001a). Analysis of periodically varying gear mesh systems with coulomb friction using floquet theory. Journal of Sound and Vibration, 243(3), 525–545. doi: 10.1006/jsvi.2000.3419
- Vaishya, M., & Singh, R. (2001b). Sliding friction-induced non-linearity and parametric effects in gear dynamics. Journal of Sound and Vibration, 248(4), 671–694. doi: 10.1006/jsvi.2001.3818
- Vaishya, M., & Singh, R. (2003). Strategies for modeling friction in gear dynamics. Journal of Mechanical Design, 125(2), 383–393. doi: 10.1115/1.1564063
- Van Khang, N., Cau, T. M., & Dien, N. P. (2004). Modelling parametric vibration of gear-pair systems as a tool for aiding gear fault diagnosis. Technische Mechanik, 24, 3–4.
- Velex, P., & Cahouet, V. (2000). Experimental and numerical investigations on the influence of tooth friction in spur and helical gear dynamics. Journal of Mechanical Design, 122(4), 515–522. doi: 10.1115/1.1320821
- Walha, L., Louati, J., Fakhfakh, T., & Haddar, M. (2005). Dynamic response of two-stage gear system damaged by teeth defects. Machine Dynamics Problems, 29(3), 107–124.
- Wang, Q., Hu, P., Zhang, Y., Wang, Y., Pang, X., & Tong, C. (2015). A model to determine mesh characteristics in a gear pair with tooth profile error. Advances in Mechanical Engineering, 6, 751476–751476. doi: 10.1155/2014/751476
- Wu, S., Zuo, M. J., & Parey, A. (2008). Simulation of spur gear dynamics and estimation of fault growth. Journal of Sound and Vibration, 317(3), 608–624. doi: 10.1016/j.jsv.2008.03.038
- Xu, H. (2005). Development of a generalized mechanical efficiency prediction methodology for gear pairs (PhD thesis). The Ohio State University, Ohio.