
ABSTRACT
In this paper, we have considered a dynamical model of diseases that spread by droplet infection and also through direct contact with varying total population size and discrete time delay to become infectious. It is assumed that there is a latent period of the disease and an immune period of the recovered individuals. Pulse vaccination is an effective and important strategy for the elimination of infectious diseases and so we have analysed this model with pulse vaccination and saturation incidence rate. It is also assumed that the time lag due to lose of immunity of recovered individuals is equal to the interval between two pulses. We have defined two positive numbers and
. It is proved that there exists an infection-free periodic solution which is globally attractive if
and the disease is permanent if
The important mathematical findings for the dynamical behaviour of the model are also numerically verified using MATLAB. Finally epidemiological implications of our analytical findings are addressed critically.
1. Introduction
Infectious diseases have tremendous influence on human life and are usually caused by pathogenic microorganisms, such as bacteria, viruses, parasites or fungi. The diseases can be spread directly or indirectly. In recent years, the spread of contagious diseases has been encountered largely by measures calculated to limit the more or less direct passage or carriage of infectious materials from the sick to others. Germs are transmitted primarily through direct or indirect contact, airborne or droplet secretion. Once transmitted, germs can survive for hours, even days in the environment, increasing the risk for infection significantly. Droplet infection is an infection transmitted from an infected person to an un-infected person through droplet secretions. We all produce these droplets after coughing or sneezing without covering our mouth and nose. The droplets travel through the air, and can either be breathed in, or land in a person's nose, mouth or eyes, which can cause an infection. The common cold is a viral infection of the upper respiratory tract and the virus (causing it) is typically transmitted through airborne droplets (aerosols), direct contact with infected nasal secretions or contaminated objects. Influenza can be spread in three main ways: (i) by direct transmission (when an infectious person sneezes mucus directly into the mouth, nose or eyes of another person); (ii) the airborne route (when someone inhales the aerosols produced by an infectious person coughing, sneezing or spitting) and (iii) through hand-to-mouth, hand-to-nose or hand-to-eye transmission (either from contaminated surfaces or from direct personal contact such as a hand-shake). Chickenpox is an airborne disease which spreads easily through coughing or sneezing of infectious individuals or through direct contact with secretions from the rash of an infectious person. A person having chickenpox is infectious 1–2 days before the rash appears and it remains contagious until all lesions have crusted over (this takes approximately 6 days). Mumps is a contagious disease that is spread from person to person through respiratory secretions, such as saliva from an infectious person. When an infectious person coughs or sneezes, the droplets aerosolize and can enter the mouth, nose or eyes of another person. Mumps can also be spread by sharing drinks and food. The virus causing it can also survive on surfaces and then be spread after contact in a similar manner. A person infected with mumps is contagious from approximately 6 days before the onset of symptoms until about 9 days after symptoms start and the incubation period (time until symptoms begin) is typically 16–18 days. Measles is a highly contagious viral disease and the virus causing it is spread by coughing and sneezing via close personal contact or direct contact with secretions.
Vaccination is a highly effective means of preventing these infections, one dose of vaccine does not protect all receivers because vaccine-induced immunity is lost after some period of time (Garly & Abay, Citation2003; Hethcote, Citation2000; Park, Citation2005; “Taber's Cyclopedic Medical Dictionary”, Citation1997). The waning for the vaccine-induced immunity suggested to specialists to implement booster course and it was seen that the booster programme enhanced the prevention rate from the disease. As for example, a clinical study on measles vaccination efficiency during an epidemic in Poland exhibits that the prevention caused by the first dose of vaccine was more than 90 and the prevention caused by the second dose of vaccine is more than 99
(Janaszek, Gay, & Gut, Citation2003).
Kribs-Zaleta and Martcheva (Citation2002), Kribs-Zaleta and Velasco-Harnandez (Citation2000), Moghadas (Citation2004), Moghadas and Gumel (Citation2003) and Hethcote (Citation2000) analysed the effect of single dose vaccine programme applied to infectious individuals using mathematical modellings. Alexander, Moghadas, Rohani, and Summers (Citation2006), Anderson and Grenfell (Citation1986), Dietz (Citation1981), Misra and Mishra (Citation2009) and Paulo, Gomes, Casinhas, and Horta (Citation2000) studied the impact of multiple dose vaccination programme on the dynamics of infectious diseases. Recently, Samanta (Citation2011) has proposed and analysed a nonautonomous dynamical model of diseases that spread by droplet infection and also through direct contact with varying total population size and distributed time delay to become infectious.
The pulse vaccination strategy (PVS) consists of repeated application of vaccine at discrete time with equal interval in a population in contrast to the traditional constant vaccination (Gakkhar & Negi, Citation2008; Zhou & Liu, Citation2003). Compared to the proportional vaccination models, the study of pulse vaccination models is in its infancy (Zhou & Liu, Citation2003). At each vaccination time a constant fraction of the susceptible population is vaccinated successfully. Since 1993, attempts have been made to develop mathematical theory to control infectious diseases using pulse vaccination (Agur, Cojocaru, Mazor, Anderson, & Danon, Citation1993; Gakkhar & Negi, Citation2008). Nokes and Swinton (Citation1995) discussed the control of childhood viral infections by PVS. Stone, Shulgin, and Agur (Citation2000) presented a theoretical examination of the PVS in the SIR epidemic model and d'Onofrio (Citation2002a, Citation2002b) analysed the use of pulse vaccination policy to eradicate infectious disease for SIR and SEIR epidemic models. Different types of vaccination policies and strategies combining pulse vaccination policy, treatment, pre-outbreak vaccination or isolation have already been introduced by several researchers (Babiuk, Babiuk, & Baca-Estrada, Citation2002; d'Onofrio, Citation2005; Gao, Chen, Nieto, & Torres, Citation2006; Gao, Chen, & Teng, Citation2007; Gjorrgjieva et al., Citation2005; Tang, Xiao, & Clancy, Citation2005; Wei & Chen, Citation2008; Zhang & Teng, Citation2008).
Epidemic models through ordinary differential equations were analysed by a number of scientists (Anderson & May, Citation1992; Brauer & Castillo-Chavez, Citation2001; Cai, Li, Ghosh, & Guo, Citation2009; Capasso, Citation1993; Diekmann & Heesterbeek, Citation2000; Kermack & Mckendrick, Citation1927; Ma, Song, & Takeuchi, Citation2004; Mena-Lorca & Hethcote, Citation1992; Meng, Chen, & Cheng, Citation2007; Naresh, Tripathi, & Omar, Citation2006; Takeuchi, Cui, Rinko, & Saito, Citation2006a, Citation2006b; Thieme, Citation2003; Zhang, Li, & Jin, Citation2015) to find the existence of the threshold values which distinguish whether the infectious disease will be going to die out, the local and global stability of the disease-free equilibrium and the endemic equilibrium, the existence of periodic solutions and the persistence of the disease.
In this paper we have considered a dynamical model of diseases that spread by droplet infection and also through direct contact with pulse vaccination and saturation incidence rate. It is assumed that the infection spreads through pathogens (bacteria and/or viruses) produced by droplets as well as by direct contact of individuals from infectious people. Also, it is assumed that there is a time lag due to incubation period of pathogens, i.e. the development of an infection from the time the pathogen enters the body until signs or symptoms first appear. It is also assumed that there is a time lag due to lose of immunity of recovered individuals which is equal to the interval between two pulses. However, the diseases incubate inside the host for a period of time before the host becomes infectious. Using a compartmental approach, it may be assumed that a susceptible individual first goes through a latent period (and is said to become exposed or in the class E) after infected. Because some successfully vaccinated susceptible individuals gradually lose their immunity after the bacterin (a suspension of killed or weakened bacteria used as a vaccine) is expired. We have introduced two threshold values and
and further obtained that the disease will be going to extinct when
and the disease will be permanent when
. The important mathematical findings for the dynamical behaviour of the model are numerically verified using MATLAB and also epidemiological implications of our analytical findings are addressed critically in Section 5. The aim of the analysis of this model is to trace the parameters of interest for further study with a view to informing and assisting policy-maker in targeting prevention and treatment resources for maximum effectiveness.
2. Model derivation and preliminaries
In the following, we consider a dynamical model of diseases that spread by droplet infection and also through direct contact with discrete time delays and PVS which satisfies the following assumptions:
The underlying human population is split up into four classes (compartments), namely susceptible (S), exposed (infected but not yet infectious) (E), infectious (showing symptoms of disease) (I) and recovered (infectious people who have cleared (or recovered from) infection) (R). The compartment of pathogens (bacteria and/or viruses) which are produced by droplets of infectious individuals is denoted by P.
The susceptible population increases through birth and recovered hosts and decreases due to droplet infection, direct contact with infectious individuals, natural death and PVS.
Standard epidemiological models use a bilinear incidence rate based on the law of mass action (Anderson & May, Citation1979, Citation1992) and it is reasonable when the mixing of susceptible with infective (in infectious compartment) is considered to be homogeneous. If the population is saturated with infectious individuals, there are three types of incidence forms used in epidemiological model: the proportionate mixing incidence
(Anderson & May, Citation1992; Cooke & van Den Driessche, Citation1996; Wang, Citation2002), nonlinear incidence
(Hethcote & van Den Driessche, Citation1991; Hui & Chen, Citation2004) and saturation incidence
(Anderson & May, Citation1992; May & Anderson, Citation1978) or
(Ruan & Wang, Citation2003). Here incidence rates
and
have been considered.
The infectious class is increased by infection of susceptible. It is assumed that there is a time lag due to incubation period of pathogens, i.e. the development of an infection from the time the pathogen enters the body until signs or symptoms first appear. The infectious class is decreased through recovery from infection, by disease-related death and by natural death. Also, it is assumed that there is a time lag due to lose of immunity of recovered individuals which is equal to the interval between two pulses.
The infection spreads through pathogens produced by droplets from infectious people and also by direct contact with infectious individuals. Therefore, it is also assumed that the pathogen population has been generated through droplets of infectious people and is diminished due to natural death.
Thus, the following dynamical model of diseases that spread by droplet infection and direct contact with discrete time delays, saturation incidence and PVS is formulated:
(1) where all coefficients are nonnegative constants. Here
denotes the number of susceptible,
denotes the number of exposed,
denotes the number of infectious individuals,
denotes the number of recovered and
denotes the number of bacteria and/or viruses (pathogens) which are produced by droplets of infectious individuals. The pulse vaccination does not give life-long immunity, there is an immunity waning for the vaccination with the per capita immunity waning rate α, where
implies that the recovered individuals would lose the immunity and
implies that the recovered individuals is with the permanent immunity. Here, τ represents the latent period of the disease and
in the term ‘
’ denotes the immune period of recovered individuals. It is assumed that the immune period is equal to the interval between two pulses because some successfully vaccinated susceptible individuals gradually lose their immunity after the bacterin (a suspension of killed or weakened bacteria used as a vaccine) is expired (i.e. the period
). So,
is also explained as the best time of losing immunity. Thus at time t, the proportion of the susceptible comes from the recovered compartment should be taken as
. The probability that an individual in the immune period has survived is given by
, where μ is the coefficient of natural death rate of all human classes. The influx of susceptible comes from two sources: a constant recruitment Λ and recovered hosts. The parameters
are:
: The coefficient of transmission rate from pathogens (bacteria and/or viruses) to susceptible humans through droplets due to droplet secretion and the rate of transmission of infection is of the form
μ: The coefficient of natural death rate of all human classes.
d: The coefficient of disease-related death rate of infective in infectious compartment.
r: The coefficient of recovery rate of the individuals of the infectious class.
τ: The constant latency period from the time of being infected (exposed) to the time of being infectious (capable of infecting others). The probability that an individual remains in the latency period (exposed class) at least t time units before becoming infectious is given by a step function with value 1 for
η: The rate at which pathogens are produced by droplets of infectious individuals. Here we assume that
δ: The natural death rate for pathogens that are produced by droplets of infectious individuals.
The total human population size can be determined by the following differential equation:
(2) which is derived by adding first four equations of system (Equation1
(1) ). Therefore,
(3)
Adding first five equations of system (Equation1(1) ) we get,
(4)
Let us simplify the model (Equation1(1) ) as follows:
(5) with initial conditions
(6) where
are nonnegative continuous functions on
For a biological meaning, we further assume that
The solution of system (Equation5
(5) ) and (Equation6
(6) ) is a piecewise continuous function
is continuous on
and
exists. There exists a unique solution of (Equation5
(5) ) with initial conditions (Equation6
(6) ) since the right hand sides of Equation (Equation5
(5) ) and the pulse are smooth functions (Bainov & Simeonov, Citation1993, Citation1995; Lakshmikantham, Bainov, & Simeonov, Citation1989).
From biological considerations, we analyse systems (Equation5(5) ) and (Equation6
(6) ) in the closed set
(7) where
represents the nonnegative cone of
including its lower dimensional faces and
It can be verified that G is positively invariant with respect to Equations (Equation5
(5) ) and (Equation6
(6) ).
Before starting our main results, we give the following four lemmas which will be essential for study.
Lemma 2.1
Kuang, Citation1993; Song & Chen, Citation2001
Consider the following equation:
where
for
We have
Lemma 2.2
Kuang, Citation1993
Consider the following equation:
where
for
We have
Lemma 2.3.
Consider the following impulsive differential equation:
(8) where
Then there exists a unique positive periodic solution of system (Equation8
(8) )
and
is globally asymptotically stable.
Proof.
From the first equation of system (Equation8(8) ) we get
where
is the initial value at time kT. Using the second equation of system (Equation8
(8) ) we have the following stroboscopic map:
(9) where
. Solving the following equation:
Since as 0<p<1 and b>0, the system (Equation9
(9) ) has a unique positive equilibrium
which is globally asymptotically stable. Hence the corresponding periodic solution of system (Equation8
(8) )
is globally asymptotically stable. This completes the proof.
Lemma 2.4
Zhang & Teng, Citation2008
Consider the following impulsive differential equation:
(10) where
Then there exists a unique positive periodic solution
with period
of system (Equation10
(10) ) which is globally asymptotically stable.
3. Global stability of the disease-free periodic solution
In this section, we discuss the existence of the disease-free periodic solution of system (Equation5(5) ), in which infectious individuals and pathogens are completely absent, that is,
and
Under this circumstances, system (Equation5
(5) ) reduces to the following impulsive system:
(11)
From the third and sixth equations of system (Equation11(11) ), we have
.
Further, from the second and seventh equations of system (Equation1(1) ) it follows that:
In the following, we shall show that the susceptible population and recovered population
oscillate with period
, in synchronization with the periodic impulsive vaccination strategy under some condition. Consider the following limit system of system (Equation11
(11) ) as per the previous discussions
(12)
Using Lemma 2.4, the system (Equation12(12) ) has a unique positive periodic solution with period
if
, which is globally asymptotically stable. Let us denote this periodic solution by
.
(13)
Theorem 3.1.
If and
then the disease-free periodic solution
of system (Equation5
(5) ) with initial conditions (Equation6
(6) ) is globally asymptotically stable.
Proof.
Since , we can choose
small enough such that
(14)
From the first and sixth equations of Equation (Equation5(5) ), it follows that:
So, we consider the following comparison impulsive differential system:
(15)
By Lemma 2.3, we know that the periodic solution of system (Equation15(15) )
(16) is globally asymptotically stable. Let
be the solution of system (Equation5
(5) ) with initial conditions (Equation6
(6) ) and
. If
be the solution of system (Equation16
(16) ) with initial value
, then by the comparison theorem for impulsive differential equation (Lakshmikantham et al., Citation1989) there exists an integer
such that
(17)
Further, from the second and fifth equations of system (Equation5(5) ), we have
and
(18)
Consider the following comparison equation:
(19)
From Equation (Equation14(14) ), we have
(20)
Set be the solution of system (Equation5
(5) ) with initial conditions (Equation6
(6) ) and
be the solution of Equation (Equation19
(19) ) with initial condition
By the comparison theorem of differential equation and the positivity of solution (with
), we have
(21)
Hence for any (sufficiently small), there exists a positive integer
, where
, such that
Using the fourth equation of system (Equation5
(5) ), we get
(22) Now,
So, by the comparison theorem, there exists an integer such that
(23)
It follows from Equations (Equation21(21) ) and (Equation23
(23) ) that there exists an integer
such that
(24)
Therefore, from the second equation of system (Equation1(1) ), we have
(25)
It is clear that there exists an integer such that
(26)
Let . Therefore, using Equations (Equation12
(12) ), (Equation24
(24) ), (Equation26
(26) ) and the first equation of Equation (Equation5
(5) ), there exists an integer
such that between two pulses
(27)
Let us consider the following delayed differential equation:
(28)
Using Equations (Equation27(27) ), (Equation28
(28) ) and Lemma 2.2, we get (
)
where
is the solution of Equation (Equation28
(28) ) with initial condition
for
. Hence, there exists an integer
such that
(29)
As can be arbitrarily small, it follows from Equations (Equation26
(26) ) and (Equation29
(29) ) that
(30)
Finally, it follows from Equations (Equation21(21) ), (Equation23
(23) ) and (Equation30
(30) ) that if
and
, then the disease-free periodic solution
of system (Equation5
(5) ) with initial conditions (Equation6
(6) ) is globally asymptotically stable. This completes the proof.
4. Permanence of the disease
In this section, we wish to discuss the permanence of the disease of system (Equation5(5) ), this means that the long-term survival (i.e. will not vanish in time) of the sum of the numbers of infectious population and pathogen population (
) of system (Equation5
(5) ) with initial conditions (Equation6
(6) ). It demonstrates how the disease will be permanent (i.e. will not vanish in time) under some conditions.
Definition 1.
The disease in system (Equation5(5) ) is said to be permanent, i.e. the long-term survival (will not vanish in time) of the sum of the numbers of infectious population and pathogen population (
) of system (Equation5
(5) ) with initial conditions (Equation6
(6) ), if there exists a positive constant m such that
hold for any solution
of Equation (Equation5
(5) ) with initial conditions (Equation6
(6) ).
Theorem 4.1.
If then there exists a positive constant m such that each positive solution
of system (Equation5
(5) ) with initial conditions (Equation6
(6) ) satisfies
for sufficiently large time t, where
(31)
Proof.
From the second and fifth equations of system (Equation5(5) ), we have
(32) where
.
Define,
(33) Define,
(34) for a sufficiently small
Let us claim that there exists a such that
. Otherwise, there exists a
such that
. It follows from the first and sixth equations of Equation (Equation5
(5) )
(35)
Let us consider the following comparison impulsive differential system :
(36)
By Lemma 2.3, we know that the periodic solution of system (36) is
(37) which is globally asymptotically stable.
By the comparison theorem for impulsive differential equation (Lakshmikantham et al., Citation1989), there exists such that the following holds:
(38)
(39)
Otherwise, there exists a such that
, where
and
However, from Equations (32), (34) and (38), we get
(40)
So, we have got a contradiction and hence As a consequence of Equations (33), (34), (38) and (39), we get
(41)
This is a contradiction because
(42)
Therefore, we conclude for any , the inequality
cannot hold for all
Thus we are left to consider the following two cases:
It is clear that if for sufficiently large t, then our desired result is obtained. So, we only need to consider the case (ii). Let
(43)
Now, we will show that for sufficiently large t. Let
and
satisfy
and
for
, where
is sufficiently large such that
for
. It is clear that
is uniformly continuous since the positive solution of Equation (Equation5
(5) ) is ultimately bounded and
is not affected by impulsive effects. Hence there exists a constants
, where
and
is independent of
, such that
for
If
, the required result is obtained. If
since
and
, it follows that
for
. If
; we have
for
and by using the same arguments we can obtain
for
as the interval
can be chosen arbitrarily. So, we can conclude that
for sufficiently large t. On the basis of the previous discussions, the choice of m is independent of the positive solution of Equation (Equation5
(5) ) and hence any positive solution of Equation (Equation5
(5) ) satisfies
for t large enough. This completes the proof.
Remark 1.
Unfortunately, we cannot establish the comparison of and
. When
, the dynamical behaviour of model (Equation5
(5) ) and (Equation6
(6) ) has not been clear. These works will be left as a part of our future consideration.
5. Numerical simulations and biological interpretations
Here we have done some numerical simulations using MATLAB. We first consider the case when using the parameter values given in Table . Using these parameter values, the movement paths of
and
are presented in Figure (a). This figure shows that the disease dies out when
which supports our analytical result given in Theorem 3.1. Its epidemiological implication is that the infectious population vanishes, i.e. the disease dies out when
(see Figure (a)). In Figure (b), the effects of pulse vaccination
on the threshold value
is presented using the parameter values given in Table . It shows that the threshold values
gradually decrease when the pulse vaccination rate
increases. This implies that the strategy of pulse vaccination is very effective to eradicate the diseases spread by droplet infection and also through direct contact.
Figure 1. (a) Movement paths of and
for
(b) the effects of pulse vaccination
on the threshold value
with parameter values given in Table .
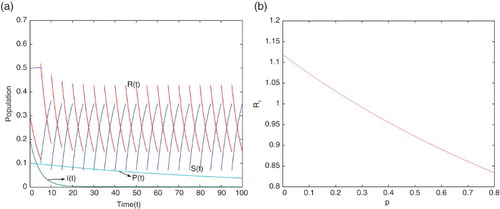
Table 1. Parameter values for figures 1(a), 1(b), 4(a) & 4(b).
Next, we consider the case when using the parameter values given in Table . Using these parameter values, the movement paths of
and
are presented in Figure (a). This figure shows that the disease will be permanent when
which supports our analytical result given in Theorem 4.1. In Figure (b), the effects of pulse vaccination
on the threshold value
is presented using the parameter values given in Table . It shows that the threshold values
gradually decrease when the pulse vaccination rate
increases. This also implies that the strategy of pulse vaccination is very effective to eradicate the diseases.
Figure 2. (a) Movement paths of and
for
(b) the effects of pulse vaccination
on the threshold value
with parameter values given in Table .
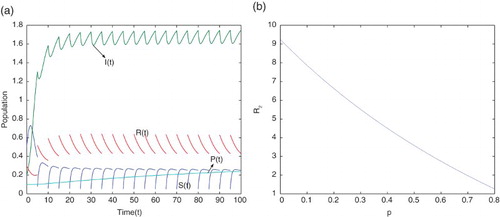
Table 2. Parameter values for figures 2(a), 2(b), 3(a), 3(b), 5(a) & 5(b).
We also consider the case when and
with
,
,
and other parameter values are values given in Table . Using these parameter values, the movement paths of
and
are presented in Figure (a). This figure shows that the disease dies out. For
and
where
,
and other parameter values are given in Table , the movement paths of
and
are presented in Figure (b). This figure shows that the disease is still permanent.
Figure 3. Movement paths of and
(a) for
and
with
and other parameter values are values given in Table , (b) for
and
where
,
and other parameter values are given in Table .
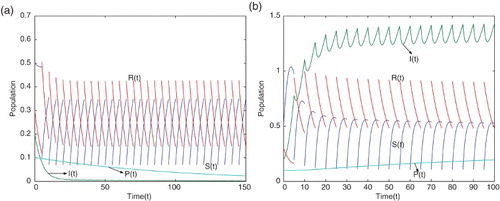
From the figures it is observed that a large pulse vaccination rate will lead to eradication of the diseases.
In Figure , the effects of pulse vaccination on the threshold value
is presented using the parameter values given in Table . The effects of pulse vaccination
on the threshold value
is presented in Figure , using the parameter values given in Table . Figures and show that the threshold values
and
gradually decrease when the pulse vaccination rate
increases. This implies that the strategy of pulse vaccination is very effective to eradicate the diseases.
Figure 4. The effects of pulse vaccination on the threshold value
with parameter values given in Table for (a) with delay
and (b) without delay
.
Figure 5. The effects of pulse vaccination on the threshold value
with parameter values given in Table for (a) with delay
and (b) without delay
.
From the figures it is observed that to eliminate the disease, the PVS and the time delay of disease should be considered at the same time.
Remark 2.
It is noticed that and
. When
, the dynamical behaviour of the epidemic model (Equation5
(5) ) and (Equation6
(6) ) has not been clear. This indicates that
and
cannot be unified as one parameter.
6. Conclusions
In this paper we have considered a dynamical model of diseases that spread by droplet infection due to droplet secretion and also through direct contact with discrete time delays, PVS and saturation incidence rate. The underlying human population is split up into four classes (compartments), namely susceptible (S), exposed (infected but not yet infectious) (E), infectious (showing symptoms of disease) (I) and recovered (infectious people who have cleared (or recovered from) infection) (R). The compartment of pathogens (bacteria and/or viruses) which are produced by droplet secretion of infectious individuals is denoted by P. The susceptible population increases through birth and recovered hosts and decreases due to droplet infection, direct contact with infectious individuals, natural death and PVS. The infected class is increased by infection of susceptible. It is assumed that there is a time lag due to incubation period of pathogens, i.e. the development of an infection from the time the pathogen enters the body until signs or symptoms first appear. The infected class is decreased through recovery from infection, by disease-related death and by natural death. The infection spreads through pathogens produced by droplets from infectious people and also by direct contact with infectious individuals. Therefore, it is assumed that the pathogen population has been generated through droplets of infectious people and is diminished due to natural death. It is also assumed that there is a time lag due to lose of immunity of recovered individuals which is identical to the interval between two pulses. Because some successfully vaccinated susceptible individuals gradually lose their immunity after the bacterin (a suspension of killed or weakened bacteria used as a vaccine) is expired. The most basic and important questions to ask for the systems in the theory of mathematical epidemiology are the persistence, extinctions, the existence of periodic solutions, global stability, etc. Here, we have established some sufficient conditions on the permanence and extinction of the disease by using inequality analytical technique. We have introduced two threshold values and
and further obtained that the disease will be going to extinct when
and the disease will be permanent when
. The important mathematical findings for the dynamical behaviour of the diseases spread by droplet infection and also through direct contact are also numerically verified using MATLAB. It is observed that a large pulse vaccination rate will lead to eradication of the disease and when
, the dynamical behaviour is not clear. The aim of the analysis of this model is to trace the parameters of interest for further study, with a view to informing and assisting policy-maker in targeting prevention and treatment resources for maximum effectiveness.
Acknowledgments
The authors are grateful to the anonymous referees and Professor Zidong Wang (Executive Editor) for their careful reading, valuable comments and helpful suggestions, which have helped them to improve the presentation of this work significantly. The first author is grateful to Prof. Javier Bracho Carpizo, Prof. Marcelo Aguilar and Prof. Ricardo Gomez Aiza, Institute of Mathematics, National Autonomous University of Mexico for their helps and encouragements.
Disclosure statement
No potential conflict of interest was reported by the authors.
Additional information
Funding
References
- Agur, Z., Cojocaru, L., Mazor, G., Anderson, R. M., & Danon, Y. L. (1993). Pulse mass measles vaccination across age cohorts. Proceedings of the National Academy of Sciences of the United States of America, 90, 11698–11702.
- Alexander, M. E., Moghadas, S. M., Rohani, P., & Summers, A. R. (2006). Modelling the effect of a booster vaccination on disease epidemiology. Journal of Mathematical Biology, 52, 290–306.
- Anderson, R. M., & Grenfell, B. T. (1986). Quantitative investigations of different vaccination policies for the control of congenital rubella syndrome (CRS) in the United Kingdom. Journal of Hygiene, 96, 305–333.
- Anderson, R. M., & May, R. M. (1979). Population biology of infectious diseases. Part I. Nature, 280, 361–367.
- Anderson, R. M., & May, R. M. (1992). Infectious disease of humans, dynamical and control. Oxford: Oxford University Press.
- Babiuk, L. A., Babiuk, S. L., & Baca-Estrada, M. E. (2002). Novel vaccine strategies. Advances in Virus Research, 58, 29–80.
- Bainov, D. D., & Simeonov, P. S. (1993). Impulsive differential equations: Periodic solutions and applications. New York, NY: Longman Scientific and Technical.
- Bainov, D. D., & Simeonov, P. S. (1995). The stability theory of impulsive differential equations: Asymptotic properties of the solutions. Singapore: World Scientific.
- Brauer, F., & Castillo-Chavez, C. (2001). Mathematical models in population biology and epidemiology. Berlin: Springer.
- Cai, L., Li, X., Ghosh, M., & Guo, B. (2009). Stability analysis of an HIV/AIDS epidemic model with treatment. Journal of Computational and Applied Mathematics, 229, 313–323.
- Capasso, V. (1993). Mathematical structures of epidemic systems. Lectures Notes in Biomathematics, Vol. 97. Berlin: Springer-Verlag.
- Cooke, K. L., & van Den Driessche, P. (1996). Analysis of an SEIRS epidemic model with two delays. Journal of Mathematical Biology, 35, 240–260.
- Diekmann, O., & Heesterbeek, J. A. P. (2000). Mathematical epidemiology of infectious diseases: Model building analysis, and interpretation. Chichester: John Wiley and Sons Ltd.
- Dietz, K. (1981). The evaluation of rubella vaccine strategies. In R. W. Hiorns & D. Cooke (Eds.), The mathematical theory of the dynamics of biological population II (pp. 81–87). London: Academic Press.
- d'Onofrio, A. (2002a). Pulse vaccination strategy in the SIR epidemic model: Global asymptotic stable eradication in presence of vaccine failures. Mathematical and Computer Modelling, 36, 473–489.
- d'Onofrio, A. (2002b). Stability properties of pulse vaccination strategy in SEIR epidemic model. Mathematical Biosciences, 179, 57–72.
- d'Onofrio, A. (2005). Vaccination policies and nonlinear force of infection. Applied Mathematics and Computation, 168, 613–622.
- Gakkhar, S., & Negi, K. (2008). Pulse vaccination in SIRS epidemic model with non-monotonic incidence rate. Chaos, Solitons & Fractals, 35, 626–638.
- Gao, S., Chen, L., Nieto, J. J., & Torres, A. (2006). Analysis of a delayed epidemic model with pulse vaccination and saturation incidence. Vaccine, 24, 6037–6045.
- Gao, S., Chen, L., & Teng, Z. (2007). Impulsive vaccination of an SEIRS model with time delay and varying total population size. Bulletin of Mathematical Biology, 69, 731–745.
- Garly, M. L ., & Abay, P. (2003). The challenge of improving the efficiency of measles vaccine. Acta Tropica, 85, 1–17.
- Gjorrgjieva, J., Smith, K., Chowell, G., Sanchez, F., Synder, J., & Castillo-Chavez, C. (2005). The role of vaccination in the control of SARS. Mathematical Biosciences and Engineering, 2, 1–17.
- Hethcote, H. W. (2000). The mathematics of infectious diseases. SIAM Review, 42, 599–653.
- Hethcote, H. W., & van Den Driessche, P. (1991). Some epidemiological models with nonlinear incidence. Journal of Mathematical Biology, 29, 271–287.
- Hui, J., & Chen, L. (2004). Impulsive vaccination of SIR epidemic models with nonlinear incidence rates. Discrete and Continuous Dynamical Systems: Series B, 4, 595–605.
- Janaszek, W., Gay, N. J., & Gut, W. (2003). Measles vaccine efficacy during an epidemic in 1998 in the highly vaccinated population in Poland. Vaccine, 21, 473–478.
- Kermack, W. O., & Mckendrick, A. G. (1927). Contributions to the mathematical theory of epidemics. Part I. Proceedings of the Royal Society A: Mathematical, Physical and Engineering Sciences, 115(5), 700–721.
- Kribs-Zaleta, C. M., & Martcheva, M. (2002). Vaccination strategies and backward bifurcation in an age-since-infection structured model. Mathematical Biosciences, 177–178, 317–332.
- Kribs-Zaleta, C. M., & Velasco-Harnández, J. X. (2000). A simple vaccination model with multiple endemic states. Mathematical Biosciences, 164, 183–201.
- Kuang, Y. (1993). Delay differential equations with applications in population dynamics. New York, NY: Academic Press.
- Lakshmikantham, V., Bainov, D. D., & Simeonov, P. S. (1989). Theory of impulsive differential equations. Singapore: World Scientific.
- Ma, W., Song, M., & Takeuchi, Y. (2004). Global stability of an SIR epidemic model with time delay. Applied Mathematics Letters, 17, 1141–1145.
- May, R. M., & Anderson, R. M. (1978). Regulation and stability of host–parasite population interactions II: Destabilizing process. Journal of Animal Ecology, 47, 219–267.
- Mena-Lorca, J., & Hethcote, H. W. (1992). Dynamic models of infectious disease as regulators of population sizes. Journal of Mathematical Biology, 30, 693–716.
- Meng, X., Chen, L., & Cheng, H. (2007). Two profitless delays for the SEIRS epidemic disease model with nonlinear incidence and pulse vaccination. Applied Mathematics and Computation, 186, 516–529.
- Misra, O. P., & Mishra, D. K. (2009). Modelling the effect of booster vaccination on the transmission dynamics of diseases that spread by droplet infection. Nonlinear Analysis: Hybrid Systems, 3, 657–665. doi: 10.1016/j.nahs.2009.06.001
- Moghadas, S. M. (2004). Modelling the effect of imperfect vaccines on disease epidemiology. Discrete and Continuous Dynamical Systems – Series B, 4, 999–1012.
- Moghadas, S. M., & Gumel, A. B. (2003). A mathematical study of a model for childhood diseases with non-permanent immunity. Journal of Computational and Applied Mathematics, 157, 347–363.
- Naresh, R., Tripathi, A., & Omar, S. (2006). Modelling of the spread of AIDS epidemic with vertical transmission. Applied Mathematics and Computation, 178, 262–272.
- Nokes, D. J., & Swinton, J. (1995). The control of childhood viral infections by pulse vaccination. IMA Journal of Mathematics Applied in Medicine and Biology, 12, 29–53.
- Park, K. (2005). Preventive and social medicine. Jabalpur: M/S Banarsi Das Bhanot Publishers.
- Paulo, A. C., Gomes, M. C., Casinhas, A. C., Horta, A., & Domingos, T. (2000). Multiple dose vaccination against childhood diseases: High coverage with the first dose remains crucial for eradication. IMA Journal of Mathematics Applied in Medicine and Biology, 17, 201–212.
- Ruan, S., & Wang, W. (2003). Dynamical behavior of an epidemic model with a nonlinear incidence rate. Journal of Differential Equations, 188, 135–163.
- Samanta, G. P. (2011). Analysis of a nonautonomous dynamical model of diseases through droplet infection and direct contact. Applied Mathematics and Computation, 217, 5870–5888.
- Song, X. Y., & Chen, L. S. (2001). Optimal harvesting and stability for a two-species competitive system with stage structure. Mathematical Biosciences, 170, 173–186.
- Stone, L., Shulgin, B., & Agur, Z. (2000). Theoretical examination of the pulse vaccination policy in the SIR epidemic model. Mathematical and Computer Modelling, 31, 207–215.
- Taber's cyclopedic medical dictionary. (1997). Philadelphia, PA: F.A. Davis Company.
- Takeuchi, Y., Cui, J., Rinko, M., & Saito, Y. (2006a). Permanence of delayed population model with dispersal loss. Mathematical Biosciences, 201, 143–156.
- Takeuchi, Y., Cui, J., Rinko, M., & Saito, Y. (2006b). Permanence of dispersal population model with time delays. Journal of Computational and Applied Mathematics, 192, 417–430.
- Tang, S., Xiao, Y., & Clancy, D. (2005). New modelling approach concerning integrated disease control and cost-effectivity. Nonlinear Analysis: Theory, Methods & Applications, 63, 439–471.
- Thieme, H. R. (2003). Mathematics in population biology. Princeton, NJ: Princeton University Press.
- Wang, W. (2002). Global behavior of an SEIRS epidemic model with time delays. Applied Mathematics Letters, 15, 423–428.
- Wei, C., & Chen, L. (2008). A delayed epidemic model with pulse vaccination. Discrete Dynamics in Nature and Society, 2008, Article ID 746951, 12 pages. doi: 10.1155/2008/746951
- Zhang, R., Li, D., & Jin, Z. (2015). Dynamic analysis of a delayed model for vector-borne diseases on bipartite networks. Applied Mathematics and Computation, 263, 342–352.
- Zhang, T., & Teng, Z. (2008). An impulsive delayed SEIRS epidemic model with saturation incidence. Journal of Biological Dynamics, 2(1), 64–84.
- Zhou, Y., & Liu, H. (2003). Stability of periodic solutions for an SIS model with pulse vaccination. Mathematical and Computer Modelling, 38, 299–308.