
ABSTRACT
It is intended that the pavements need to be designed to accomplish better performance due to the continuous increases of traffic volumes, vehicle loads and tyre pressure, especially for the channelized traffic. To achieve this objective, the method of accelerated pavement testing is used to directly optimize the asphalt pavement design. Therefore, the quality of the accelerated pavement testing facility plays an important role in optimizing the pavement design. In order to improve the success rate of the facility, the mechanical analysis of the accelerated pavement loading facility based on multi-rigid-body dynamics is carried out before the design and fabrication, so as to establish the virtual prototype of loading carriage; the multi-body dynamic equations are obtained according to the Newton–Euler formula; the force and displacement of each joint are simulated by using the MSC ADAMS software, and the results of stimulation meet the requirement; a full-scale accelerated loading testing (ALT) system with independent intellectual property right is developed. The ALT can be operated in single-axle or dual-axle loading mode, which is better than the existing facilities. The experiment indicates that the quality of the ALT, which is analysed based on multi-body dynamic, is excellent.
1. Introduction
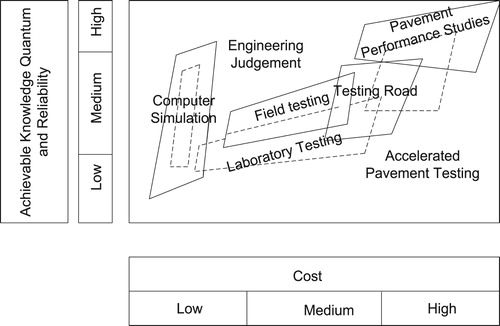
With the accelerating growth of the expressway traffic volumes, the vehicle loads and tyres pressure, especially for the channelized traffic, the pavements often deteriorate more quickly in early periods such as rutting and cracking in the expressway since it was open to traffic (Guan, Zhuang, & Lin, Citation2012; Liu & Cao, Citation2009; Tian, Ali, & John, Citation2014). The early damages affect the properties and the service life of the pavement, which will cause huge economic loss and negative social influence. Thus in order to improve the quality of expressway pavement, the pavement structure, construction techniques, material mixture ratio and other parameters shall be considered in the pre-construction stage. However, it is very difficult to obtain the parameters by using traditional methods, and also the accuracy of the obtained data is likely to be low. Despite years of systematic research, the design and analysis of the asphalt pavements still can be carried out by using some traditional methods (Eyal, Rebecca, & Jan, Citation2009; Guan, Lin, Wang, & Zhang, Citation2011), such as empirical components, field experimental data in pavement service life and experimental data in the laboratory. The disadvantages of traditional methods include (1) the mechanical behaviour of pavement materials and subgrade is not well understood and cannot always be sufficiently controlled in the empirical components; (2) the data are often affected by the continuously changing material properties during the pavement service life due to natural processes such as oxidation and age hardening in the field experimental, and it takes many years to collect data, and (3) the data have low accuracy and bad real-time capability because the method cannot simulate the real condition of the pavement. As a consequence, the available traditional methods are heavily based on past experience and low accuracy data, which cannot be used reliably and aided in optimizing pavement designs. So, in a condensed amount of time, one option to collect performance data is to construct and operate a test track loaded with an actual carriage. Accelerated pavement testing (APT) is one of the most powerful tools to close the gap between laboratory testing and in situ tests under real traffic loads (Jansen, Wacker, & Pinkofsky, Citation2018). Accelerated pavement testing is defined as the controlled application of wheel loading to pavement structures for the purpose of simulating the affects of long-term in-service loading conditions in a compressed time period (Mariely, Jesse, & John, Citation2014; Martin, Andrés, Manfred, & Fernando, Citation2014). Figure shows the potential costs and benefits from this range of activities, indicating that APT provides medium to high gains in knowledge at medium to high cost (Brown & Feng, Citation2004).
Figure 1. Relative costs against knowledge gained for different techniques.
Most of the APT programmes are focused on the pavement structural performance, and it is difficult to find the reported studies on the mechanical analysis of accelerated pavement loading facility. The use of APT is mainly in the field of pavement engineering. For many years APT provided pavement engineers with the knowledge that improved their understanding of pavement materials and structures, as well as their behaviour under typical traffic and environmental loading (Kozel, Kyselica, Mikolaj, & Herda, Citation2016). However, users are interested in asphalt pavement response rather than the facility. In fact, the quality of the facility determines the accuracy of the data collection and authenticity. Most of the APT programmes are focused on the pavement structural performance, and it is difficult to find reported studies on the mechanical analysis of accelerated pavement loading facility. Thus in order to improve the success rate, the mechanical analysis of the accelerated pavement loading facility based on a virtual prototype shall be carried out before the design and fabrication. The carriage of the accelerated pavement loading facility is a complex multi-body system, so it is difficult to establish the dynamic equation. In the paper, the carriage is assumed as a multi-rigid-body system, and then the dynamic model is established and analysed by using Solidworks and MSC ADAMS.
2. Virtual prototype of loading carriage
A wide variety of APT programmes are operational in the world today (Fred, Louisye, & Martin, Citation2014). The class of devices includes heavy vehicle simulator (HVS), accelerated loading facility (ALF) and mobile load simulator (MSL) (Sivaranjan, Citation2005; Tanmay & Ghassan, Citation2014). But currently there are six full-scale APT facilities in China, which are all imported and very expensive. They have a common disadvantage that they can only apply the single-axle wheel load to the pavement (Füssl, Kluger, & Blab, Citation2015; Ji, Zheng, Hou, & Niu, Citation2013), which cannot reflect the real conditions of pavement because most vehicles have dual-axle or more. At the same time, they have some other features as follows (Ahmed & Erlingsson, Citation2012; Bttacharjee & Mallick, Citation2012; Thorbjog, Sigurdur, & Håkan, Citation2015; Wu & Ye, Citation2015):
HVS: (1) starting and braking frequently and (2) low velocity.
ALF: (1) weight loading and (2) high inertia.
MLS: (1) complex structure and high failure rate and (2) high-energy consumption.
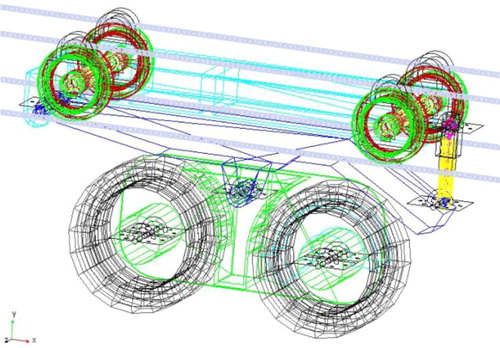
The design of the accelerated loading testing facility (ALT) represent a challenge with no precedents for the partners involved since it is the first time to design a two-loading-mode APT. So, in order to improve the success rate and save the cost, the virtual prototype of the loading carriage shall be established. Because it is very difficult to simulate an actual APT loading varying with different velocities and tyre pressures, it is supposed that each part of the carriage is rigid and is connected by joints, e.g. revolute, translational, cylindrical or spherical joints. According to the design theory and scheme of the ALT, the joints of the virtual prototype are added in Figure . The virtual prototype model is designed by using Solidworks software in a single-axle loading or a dual-axle loading mode. Then the model is imported to the MSC ADAMS software.
Figure 2. Loading carriage.
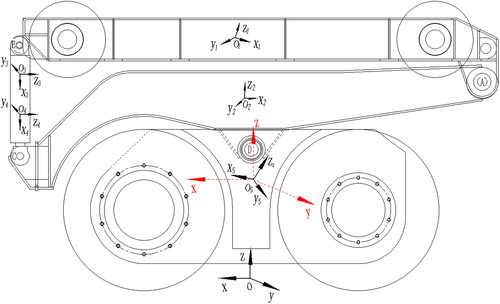
The loading of the wheels, which applies to the pavement, is caused by the hydraulic system and can be calculated by differential equations. In the multi-body system, six independent coordinates (three coordinates
describing the location and the others
describing the orientation) completely describe the configuration of the system. There are five rigid bodies in the carriage. So in the model of the ALT, the coordinate system is shown in Figure .
Figure 3. Loading carriage coordinate system.
Assumed: is the rigid body mass (
),
is the body coordinate system (
) whose origin is the same as the centre of the mass of the rigid body,
is the fixed coordinate system,
is the joint force applied on the rigid body,
is the external force applied on the rigid body,
is the torque produced by joint force relative to the origin,
is the torque produced by external force relative to the origin, and
is the inertial tensor relative to
.
So, the Newton–Euler equation of the bodies relative to the body coordinate system is described by the following equation:
(1) where
is the centre of mass displacement of the rigid body,
is the angle velocity of the rigid body in
,
is the inertia moment of the rigid body, and
is the product of inertia.
According to Equation (1), the Newton–Euler equation of the ALT is obtained by the following equation:
(2)
Define
is the third-order unit matrix.
Since,
(3) where
is the translational Jacobian matrix,
is the rotational jacobian matrix, and
is the coordinate vector of the rigid body.
Equation (3) is substituted into Equation (2) to obtain
(4) At the same time, the joint force applying on the rigid body of ALT
is expressed:
(5) where
is the generalized ideal joint constraint force,
is its transfer matrix.
According to the virtual work principle, the work by all the joint forces in the virtual displacement direction is zero, so
(6) So, Equation (4) is pre-multiplied by
, Equation (7) is obtained as
(7) In the ALT hydraulic system, assuming that the diameter of the hydraulic cylinder piston is D, the diameter of the hydraulic cylinder piston rod is d, hydraulic cylinder flow is Q, the efficiency of force and speed is
and
, respectively, so, the force
, velocity
and angular velocity
will be obtained as following equations:
(8)
(9)
(10)
If the initial condition, loading of the hydraulic system and driven force are known, the dynamic response of each rigid body will be calculated.
3. Simulation
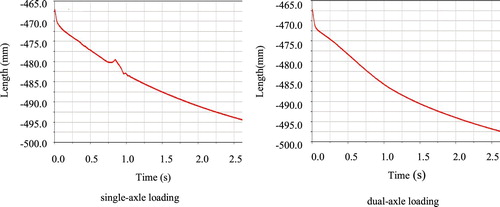
As the virtual prototype model is imported to MSC ADAMS software, the mechanical analysis of ALT is carried out in single-axle or dual-axle loading mode. The force figure and displacement figure of each joint are obtained by using MSC ADAMS software, which are shown in Figures – respectively.
Figure 4. Force of joint A.
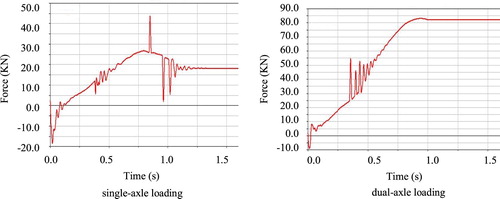
Figure 5. Displacement of joint A.
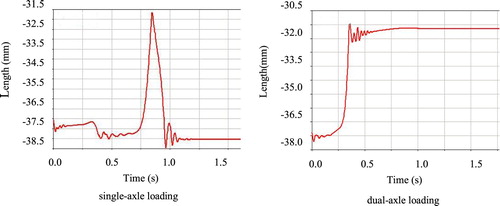
Figure 6. Force of joint B.
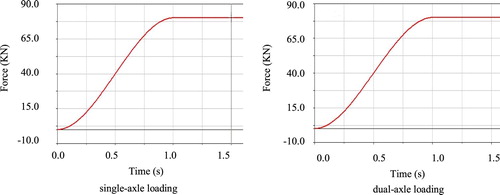
Figure 7. Displacement of joint B.
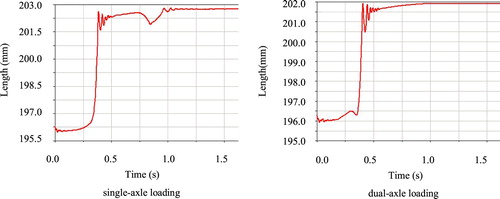
Figure 8. Force of joint C.
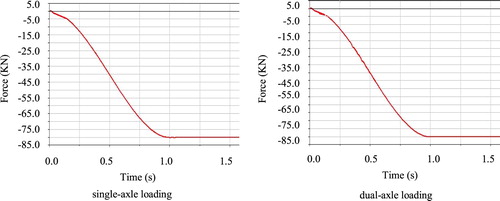
Figure 9. Displacement of joint C.
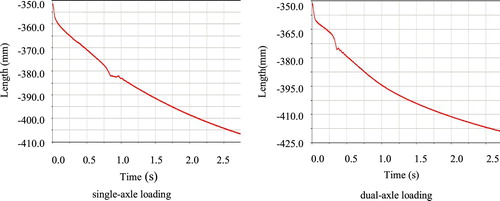
Figure 10. Force of joint D.
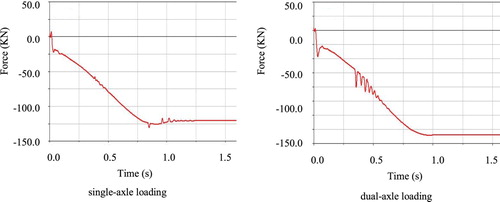
Figure 11. Displacement of joint D.
From the above figures, some conclusions are obtained:
The displacement of joint A is larger in single-axle loading mode than that in dual-axle loading mode, because only the front wheel touches the pavement in single-axle loading mode;
The force of joint B increases to a certain value with time. Before this time, the displacement of joint B is zero. After this time, the upper part of the loading carriage begins to move upward and then will touch the upper rail. During the process, both the displacement and the force of joint B increase with the time and then maintain a constant;
The direction of the force of joint C is opposite to joint B, and the displacement also increases with the time until the load applies to the pavement completely, because as the hydraulic system works, the upper part of the carriage will rise;
The velocity direction of the joint D is opposite to the initial velocity within a small period. During this time, the tyres begin to touch the pavement;
The force of joint B has almost no difference in single-axle loading mode and dual-axle loading mode. Joint C is the same as joint B. The forces of the two joints are all produced by a hydraulic system without transformation from other parts.
4. Full-scale ALT
From the simulation, the results of each joint are satisfied with the original assumption. Therefore, according to the virtual prototype of loading carriage, a full-scale ALT system with independent intellectual property right is developed, which is shown in Figure . Now the ALT is located at Shandong Jiaotong University in Jinan, Shandong province, China. The ALT system is designed to apply up to a 200 KN load in single-axle mode on a dual wheel assembly or 400 KN load in dual-axle mode on four wheels assembly as it runs across a test pavement of 10 m long at maximum velocity 28 km/h. The facility uses a mechanical and hydraulic control to maintain a constant force.
Figure 12. Full-scale ALT system.
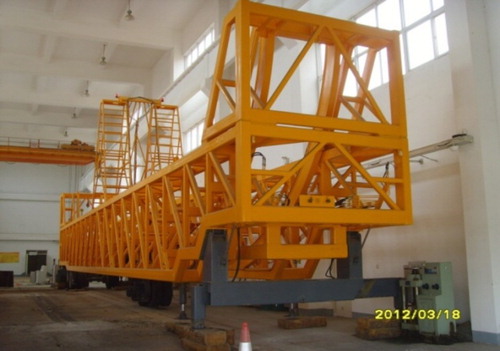
Energy requirements for the ALT system are much less than a system using a mass for the load. Reaction forces generated by the constant loading system are transmitted to the pavement by using a special carriage, which moves along the upper rails of the ALT frame when the load is applied to the test pavement or along the lower rails as the wheels are apart from the test pavement. The carriage is driven by a three-phase asynchronous motor (30 kW). The motor is connected with the gear reducer, which is located on the hub. Compared with other facilities, the main technical parameters are shown in Table . From Table , we can find that the main technical parameters of ALT are superior to those of the existing facilities.
Table 1. Main technical parameters of ALF, HVS, MLS and ALT.
Up to now, the number of passes is about 4,700,000 at different loads, velocities and tyre pressures, which are shown in Table . The energy consumption is about 10 kWh. Figure is the experiment spot in 2017 in Rizhao City, Shandong Province. Figure is another experiment spot in 2018 in Jiqing expressway, Shandong Province. During these experiments, some mechanical failures occurred are shown in Figure (a,b), but the failures don’t affect the facility operations.
Figure 13. Experiment in Rizhao.
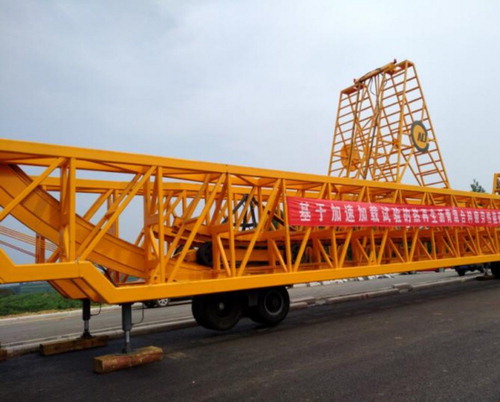
Figure 14. Experiment in Jiqing expressway.
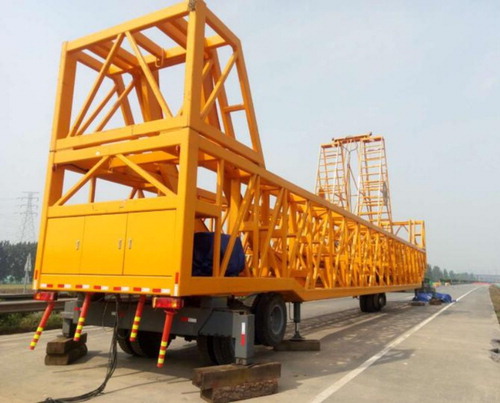
Figure 15. Mechanical failures.
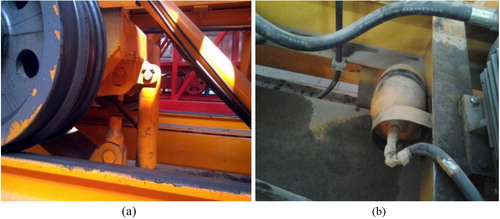
Table 2. Experiment of ALT at different cases.
5. Conclusions
In the paper, the mechanical analysis of accelerated pavement loading facility based on multi-body dynamics is carried out. The force and displacement of each joint for the loading carriage are obtained by using the Newton–Euler equation. The results of the simulation and the experiment are shown as follows:
The design of the virtual prototype is satisfied with the requirement. According to the result of the experiment, the ALT design is reasonable;
During the working of the ALT, the loading applied to the pavement needs a transition time. According to the transition time and the velocity, the affective loading length can be calculated, which is an important parameter to evaluate the performance of the ALT;
The transition time in single-axle loading is larger than in dual-axle loading, so, the efficiency is higher in dual-axle loading than in single-axle loading, which can provide a reference for the user.
Disclosure statement
No potential conflict of interest was reported by the authors.
Additional information
Funding
References
- Ahmed, A.-W., & Erlingsson, S. (2012). Modeling of flexible pavement structure behavior – Comparisons with heavy vehicle simulator measurements. Advances in pavement design through full-scale accelerated pavement testing – Proceedings of the 4th International Conference on Accelerated Pavement Testing, California, USA (pp. 493–503).
- Brown, S.-F., & Feng, F. (2004). Accelerated pavement testing in highway engineering. Proceedings of the Institution of Civil Engineers – Transport, 157(3), 173–180. doi: 10.1680/tran.2004.157.3.173
- Bttacharjee, S., & Mallick, R.-B. (2012). Effect of temperature on fatigue performance of hot mix asphalt tested under model mobile load simulator. International Journal of Pavement Engineering, 13(2), 166–180. doi: 10.1080/10298436.2011.653565
- Eyal, L., Rebecca, S.-M., & Jan, O. (2009). Validation of NCAT structural test track experiment using INDOT APT facility. West Lafayette, IN: Purdue University.
- Fred, H., Louisye, A., & Martin, E. (2014). Significant findings from full-scale accelerated pavement testing. National Cooperative Highway Research Program: Transportation Research Board.
- Füssl, J., Kluger, E.-W., & Blab, R. (2015). Mechanical performance of pavement structures with paving slabs – part I: Full-scale accelerated tests as validation for a numerical simulation tool. Engineering Structures, 98, 212–220. doi: 10.1016/j.engstruct.2014.10.054
- Guan, Z. G., Lin, M.-X., Wang, X.-G., & Zhang, J.-W. (2011). Research on control system and test of full-scale highway accelerated loading testing. Journal of Shandong University (Engineering Science), 41(5), 121–126.
- Guan, Z.-G., Zhuang, C.-Y., & Lin, M.-X. (2012). Accelerated loading dynamic response of full-scale asphalt concrete pavement. Journal of Traffic and Transportation Engineering, 12(2), 24–31.
- Jansen, D., Wacker, B., & Pinkofsky, L. (2018). Full-scale accelerated pavement testing with the MLS30 on innovative testing infrastructures. International Journal of Pavement Engineering, 19, 456–465. doi: 10.1080/10298436.2017.1408274
- Ji, X.-P., Zheng, N.-X., Hou, Y.-Q., & Niu, S.-S. (2013). Application of asphalt mixture shear strength to evaluate pavement rutting with accelerated loading facility (ALF). Construction and Building Materials, 41, 1–8. doi: 10.1016/j.conbuildmat.2012.11.111
- Kozel, M., Kyselica, M., Mikolaj, J., & Herda, M. (2016). Accelerated pavement testing in Slovakia. Procedia Engineering, 153, 310–316. doi: 10.1016/j.proeng.2016.08.121
- Liu, Q.-Q., & Cao, D.-W. (2009). Research on material composition and performance of porous asphalt pavement. Journal of Materials in Civil Engineering, 21(4), 135–140. doi: 10.1061/(ASCE)0899-1561(2009)21:4(135)
- Mariely, M.-S., Jesse, D.-D., & John, F.-R. (2014). Accelerated pavement testing of warm-Mix asphalt for heavy-traffic airfields. Transportation Research Record: Journal of the Transportation Research Board, 2456, 11–20. doi: 10.3141/2456-02
- Martin, A., Andrés, P., Manfred, N.-P., & Fernando, M. (2014). Effect of full-size and down-scaled accelerated traffic loading on pavement behavior. Materials and Structures, 47(8), 1409–1424. doi: 10.1617/s11527-014-0319-2
- Sivaranjan, S. (2005). Validation of superpave mixture design and analysis procedures using the NCAT test track. West Lafayette, IN: Purdue University.
- Tanmay, K., & Ghassan, R.-C. (2014). Methodology for relating accelerated trafficking to field trafficking for pavement evaluation. KSCE Journal of Civil Engineering, 18(2), 505–513. doi: 10.1007/s12205-014-0456-8
- Thorbjog, S., Sigurdur, E., & Håkan, C. (2015). Instrumentation and performance modeling of heavy vehicle simulator tests. International Journal of Pavement Engineering, 17(2), 148–165.
- Tian, Y., Ali, H., & John, E. H. (2014). Comparison of rutting performance between the PURWheel and the NCAT test track. In Y. Richard Kim (Ed.), Asphalt pavements (pp. 1469–1478). Florida: CRC Press.
- Wu, J.-T., & Ye, F. (2015). Modulus evolution of asphalt pavement based on full-scale accelerated pavement testing with mobile load simulator 66. International Journal of Pavement Engineering, 16(7), 609–619. doi: 10.1080/10298436.2014.943213