
 ?Mathematical formulae have been encoded as MathML and are displayed in this HTML version using MathJax in order to improve their display. Uncheck the box to turn MathJax off. This feature requires Javascript. Click on a formula to zoom.
Abstract
According to the characteristics of cruise ship supply logistics, using a mixed-integer linear programming model (MILP), we describe the location-distribution and time utility requirements, in which the capacity constraints of the distribution centres and time window are considered, in order to minimize the sum of fixed cost, variable cost, distribution cost between nodes and time penalty cost. Further, a ‘two-stage’ method is suggested to solve the MILP problem. In the first stage, the Benders decomposition algorithm is adopted to determine the location of the distribution centres, flow allocation and shipment sizes on each link. Then IBM ILOG CPLEX optimization studio software is used to get the optimal value of the distribution schedule of ship suppliers in the second stage. Finally, the proposed method is verified by a study simulation.
1. Introduction
In recent years, with the transfer of global cruise industry in Asia, China cruise market has gradually become the focus of attention in the world, and the number and density of shipping routes are growing rapidly in China coastal home ports. Cruise industry is also gradually developing from simple tourism to diversified industry chain. In the cruise industry chain, a large part is cruise ship supplies procurement and distribution. The procurement chain of international cruise line corporations is gradually extended to the local market, and further increase the local procurement of hotel supplies, food and beverage material and spare parts. If a cruise ship supply distribution centre with the function of ‘global procurement and global distribution’ is built, the supplies purchase quantity in the port area and surrounding areas will increase exponentially. However, international cruise lines have limited supplies in China cruise ports, which is due to the restrictions of cruise ship supply supervision mode and policy, as well as the lack of professional logistics network. Cruise ship supply logistics network is a typical complex network, in which logistics nodes include manufacturers, logistics distribution centres, processing plants and ports, logistics channel is a transport channel composed of a transportation network and means of transport. Since the replenishment time of cruise ships is only 6–8 h each time, it is necessary to complete baggage loading and unloading, replenishment loading, waste and recycled goods unloading, and fuel and drinking water replenishment in a short time. As an important part of the cruise ship supply logistics system, the location-distribution of the logistics distribution centres play an important role as the final hub of ship supplies. A well-coordinated supply chain is required to ensure that needs of passengers onboard are well satisfied. Food production onboard, which is complex and has strict timetables, cannot be disrupted by out-of-stock (OOS) events or other causes without serious consequences [Citation10].
This paper aims to construct a mixed-integer linear programming model for the location-distribution of cruise ship supply logistics distribution centres, considering capacity constraints and time window, which combine the characteristics of cruise ship supply chain. The rest of this paper is organized as follows. Section 2 examines the existing literature and methodologies. Section 3 outlines the problem and model. Section 4 presents the solution method. A case study is examined in Section 5. Finally, Section 6 provides concluding remarks and suggests future research directions.
2. Literature review
2.1. Location and distribution
In recent years, scholars have made some achievements in the research of joint decision on location and distribution. For example, non-linear continuous programming was used to solve the problem of location and flow distribution for the distribution centres in logistics network [Citation6]. A mixed-integer convex model is constructed to optimize the location and distribution of distribution centres without capacity constraints in logistics network, and establish a heuristic method based on a hybridization of Tabu Search and Simulated Annealing [Citation4]. Using a location-distribution model with the objective of optimizing both total logistics and distribution costs, in which the distribution centre capacity and transportation capacity were considered in a B2C (business-to-consumer) model and a genetic algorithm was applied to solve it [Citation11]. The location-distribution problem in two-stage distribution network was proposed, and a mixed-integer linear programming model was constructed under the limitation of capacity, the total cost which included fixed location cost and delivery cost was minimized, then a combined 0–1 and priority-based encoding genetic algorithm was designed (Li & Zhao, Citation2012).
2.2. Cruise supply chain
In terms of cruise logistics replenishment, the study abroad is relatively mature. According to Boyd tactical cycle theory, replenishment lead time should be shorter than cruise length to maintain the responsiveness within a certain period. Shortening the delivery time was the main solution to provide more flexibility and this was further transferred to the pull supply system [Citation8]. On the other hand, a cruise supply chain planning process was proposed, in which, as a short-term strategy, orders should be fulfilled within a limited and compact timetable to ensure that a cruise could continue to receive supplies globally and the main load schedule (MLS) should be used as the main adjustment tool to determine the loading and unloading frequency and port [Citation9]. In order to analyse the characteristics of cruise supply point movement, which caused the distance between the port of call and the raw material supply point, thereby leading to an increase in the lead time [Citation7]. Domestic research is lagging behind international research and is mainly focused on macro aspects, such as cruise tourism, cruise industry supply chain, and so on. For example, it was considered that cruise ship supply chain had the characteristics of complexity, global, timeliness, irreparable and supply point variability, thus it was necessary to plan and integrate the entity flow and information flow of each link to improve the efficiency of cruise ship supply chain management. Cruise line corporations should reduce the cost from the procurement and transportation links, so as to promote the development of cruise material supply chain [Citation2]. It was proposed that if a comprehensive cruise logistics service was available, such as complete port facilities, transport buildings, supplies services and integrate related industries were satisfy for international cruise lines, that should promote the port as the cruise logistics service hub (Chen, Citation2016).
At present, the research on location-distribution of cruise supply logistics distribution centre is limited to the form of summary. Cruise supplies are mostly consumables for people on board, the supply volume is huge in a short time, and most of them belong to refrigerated and fresh-keeping food. Therefore, it requires high timeliness, and the time window constraints should take into account. In addition, although there are some studies on the Location Routing Problem (LRP) at home and abroad. But some of them only focused on a single logistics centre location and distribution routing, or there were no capacity and time window constraints, and most of models were solved by heuristic algorithms in some special cases. The heuristic method has a short computing time, but it cannot guarantee the optimal solution. There are still few research results on more practical models and algorithms, such as the point-to-point transportation problem considering time constraints, capacity constraints and distribution costs.
The innovation of this paper is based on previous studies, based on the characteristics of global cruise ship supply chain, a three-level programming model of cruise ship supply distribution network is established, and a mixed-integer linear programming model (MILP) of location-distribution is constructed considering capacity constraints and time window, the advantage of the model is concise and compact, and integrates three decisions: distribution centres location, flow allocation and shipment sizes on each link. The objective function is to minimize the sum of fixed cost, variable cost, distribution cost between nodes and time penalty cost. The two-stage method is proposed to solve the model, the first stage we adopt Benders decomposition algorithm, and CPLEX studio software is used in the second stage. The findings of this study have reference significance for improving cruise supply chain management of China cruise industry.
3. Problem description and modelling
3.1. Problem description
The location and number of cruise ship suppliers and berthing ports are known. In the candidate logistics distribution centres, it is necessary to determine the appropriate cruise ship supply logistics distribution centre as a centralized hub, which can check the supplies quality and safety. Then flow allocation of each node is determined, so as to ensure supplies arrive on the cruise ship as expected. Consequently, the logistics distribution centres must complete the turnover processing of cruise ship supplies within schedule time and deliver them to the cruise ports in time. The objective of optimization is to minimize the total logistics costs, including the distribution cost of each node, the fixed cost and variable cost of distribution centre, taking the capacity constraint and time window of the logistics distribution centre into account.
3.1.1. Characteristics of cruise supply chain
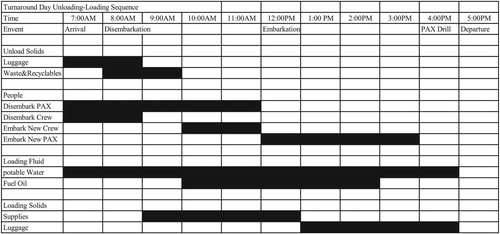
The focus of the cruise ship operation plan is the replenishment of ship supplies. The cruise supply chain has the characteristics of global and supply point mobility, and the short time window constraint is a major challenge to cruise supply chain management systems in the ship supply process, so it is very important that continuous replenish maintain at the optimum speed. It must commit to a certain level of supply a few weeks before cruise departure, considering the lead time of replenishment. Therefore, the standard operating procedures and clear objectives of cruise line become more significant in order to ensure smooth and stable supply operations, at this moment timeliness is even more critical. Véronneau and Roy [Citation9] integrated the cargo flow of cruise ships on a typical turnaround day based on observations of average time at the dock, as shown in Figure . It can be seen that the loading sequence of a cruise ship at the port is both rigorous and efficient, especially the replenishment time, which requires a short time window.
Figure 1. Typical turnaround day at a port.
3.1.2. Cruise ship supply logistics distribution network
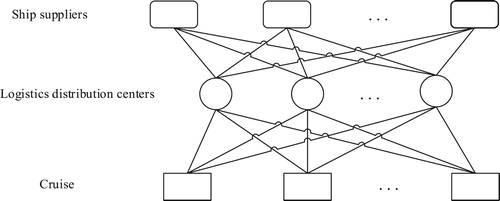
As an important supporting industry of cruise port, cruise logistics distribution centres can provide professional and comprehensive logistics and distribution services of production and livelihood for berthing cruise ships, including a series of functions such as warehousing and distribution. From the ship suppliers to cruise ships, the supplies passing through cruise logistics distribution centres, which have to go through the logistics links of loading and unloading, transportation, warehousing, allocation, packaging and distribution. A three-layer programming model of ‘ship suppliers–logistics distribution centres–cruise ships’ is typically used for location-distribution optimization model of cruise ship logistics distribution centres, as shown in Figure .
Figure 2. Network diagram of cruise ship supply distribution.
3.2. Modelling
3.2.1. Assumptions
According to the characteristics and modelling purposes of cruise ship logistics distribution network, the following assumptions are considered in our model:
Ship supplier capacity and cruise demand are known.
Distribution costs from ship supplier production bases to the candidate logistics distribution centres are known, and the distribution costs and times from candidate logistics distribution centres to cruise ports are known.
The fixed costs of the location of the logistics distribution centres are known.
The capacity of the logistics distribution centre is known.
Definitions of the parameters and variables in our study are shown in Table .
Table 1. Symbols and definitions of various parameters and variables.
3.2.2. Optimization objective
The objective of the location-distribution of cruise ship supply logistics distribution centres is to minimize the total logistics cost. Thus, an optimization objective model is constructed based on the sum of fixed costs, turnover costs, distribution costs on each link and penalty costs caused by a soft time window. On the premise of ensuring the safe and reliable distribution of cruise supplies, the total logistics cost is minimized.
3.2.3. Penalty function
From the typical cruise port turnover day above, it can be seen that the arrival time of cruise ships supply distribution must be within a certain time range so as not to conflict with the loading time flow of the cruise ships. Therefore, we consider the distribution time requirement of cruise ship supplies as the constraints, and introduce the penalty function of distribution into the optimization objective function, study the location-distribution problem of multiple logistics distribution centres for cruise ship supplies under soft time window constraints.
denotes the time required to complete delivery of cruise ship supplies for logistics distribution centre. The optimal arrival time of the supplies to the cruise ships needs to be within a certain time range
, where
is the earliest arrival time required for distribution, and LT is the latest time required for distribution. If supplies arrive too early, they need to occupy the port yard waiting for loading time, resulting in additional storage penalty costs. On the contrary, if the distribution cannot be completed within the required time period, the cruise ship loading plan will be delayed and a certain operating penalty cost will be paid, and further penalties will be imposed. Thus, the penalty function of cruise ship supply distribution is as Equation (1):
(1)
(1)
Cruise ship supplies are delivered from ship suppliers to logistics distribution centres after cruise company places purchase demand order, then go through a series of processes, such as storage, pack, encasement, customs declaration, and distribution, and are finally delivered to the cruise port of call.
3.2.4. Objective function
The objective function is constructed as follows:
(2)
(2)
(3)
(3)
(4)
(4)
(5)
(5)
(6)
(6)
(7)
(7)
(8)
(8)
(9)
(9)
In the optimization model above, Equation (2) is the objective function and consists of five parts, which is the sum of the distribution cost from ship suppliers to logistics distribution centres, the distribution cost from logistics distribution centres to cruise home ports, the fixed cost of location selection of logistics distribution centres, the turnover cost of logistics distribution centres and the penalty cost under the constraints of time windows of cruise home ports. Equations (3)–(9) are constraints, in which Inequality (3) indicates that the total delivery volume cannot exceed the capacity constraints of logistics distribution centres. Inequality (4) represents the supply capacity constraints of ship suppliers. Equation (5) indicates the equilibrium constraints of inflow and outflow in logistics distribution centres. Similarly, Equation (6) means that the requirements of cruise ships meet constraints. Inequality (7) represents the distribution time constraints of logistics distribution centres. Formula (8) denotes non-negative constraints on distribution quantities, and Formula (9) is binary constrains of logistics distribution centres location.
4. Solution method
At present, most researches adopt genetic algorithm, particle swarm optimization or relevant improved heuristic algorithm to solve the problem of location problem. According to the basic idea of the heuristic algorithm, we propose a ‘two-stage’ method for the large-scale mixed-integer programming model location-distribution of cruise ship supply logistics distribution centre in this paper. In the first stage, the location of the logistics distribution centres are selected according to the unit distribution cost from the candidate points to the cruise ship replenishment port, the fixed and turnover costs of the candidate points, the distribution time window and the capacity constraint of the candidate points, furthermore, flow allocation and shipment sizes on each link are determined. In the second stage, we calculate the total distribution amount of each logistics distribution centre according to the supply capacity of ship suppliers and their distribution costs to the determined logistics distribution centres. Since there is no existing function solution for mixed programming, it often relies on the third-party toolbox.
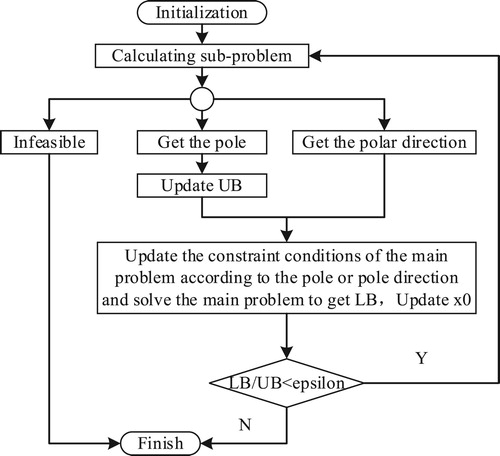
4.1. Benders decomposition algorithm
Benders decomposition algorithm was first proposed by Benders in 1962, in order to solve the mixed-integer programming problem, which is the extreme value problem that continuous variable and integer variable appear simultaneously. However, its practical effect is not limited to this. The generalized Benders decomposition was further established, which can be used to solve non-linear problems with the basic form of the Benders decomposition, and the method of solving sub-problems does not have to be linear [Citation3]. Benders decomposition algorithm is a very common algorithm, which is used to calculate difficult problems such as the minimum integer non-linear programming problem and stochastic programming problems, and it is an effective solution to large-scale mixed-integer optimization problems. In 1976, Florian used the Benders decomposition algorithm to solve the railway locomotive scheduling problem, Richardson applied this algorithm to air route planning. In 1984, Geoffrion and Graves used it to the design of industrial distribution systems. Since 1978, Fisher and Jaikumar have been studying and discussing the advantages of this algorithm to programme the motor vehicles route. Therefore, the first stage we proposed that Benders decomposition algorithm is adopted to solve the optimization problems such as follows:
(10)
(10)
In the formula (10), is the matrix for
,
is the matrix for
,
,
,
are the row (column) vectors with the length of
,
,
, respectively.
The main steps of Benders decomposition algorithm are as follows:
Step 1: Initialization.
; %
is
with vectors of 0.
; %Lower bound, the initial value is −10^10.
; %
, upper bound, initial value is infinite.
; % Initial number of poles.
; % Initial number of polar directions.
; %The set of poles, initialized with 0.
; %The set of polar directions, initialized with 0.
; %Threshold value for
, when
is greater than the threshold, Benders Decomposition stops.
Step 2: Solving sub-problem.
Step 3: Solving the main problem.
The flow chart of Benders decomposition algorithm is shown in Figure .
Figure 3. Flow chart of Benders decomposition algorithm.
4.2. CPLEX studio
Currently, the research on transportation mainly focuses on modelling and solving algorithms. For the linear programming model of transportation dispatch, the existing research mostly adopts the heuristic algorithm. Although the heuristic algorithm has high computational efficiency, it cannot guarantee to get the optimal solution. IBM ILOG CPLEX optimization studio (CPLEX Studio) software is one of the basic optimization component series developed by ILOG, which is consists of CPLEX interface and CPLEX algorithm, and CPLEX interface includes component library and interaction optimizer. CPLEX is not an algorithm itself, but it contains a set of configurable algorithms, known as optimization, and includes single optimizer, bound optimizer, and mixed-integer optimizer.
CPLEX Studio combines the advantages of multiple algorithms to solve multivariate and complex mixed-integer programming problems in a short time. In particular, it is effective for solving many practical mixed-integer programming problems. In addition, CPLEX Studio has the characteristics of fast execution speed, simple and easy to understand for its language, and it is compatible with many optimization software languages, which can accelerate the development and deployed of optimization model, combined with the leading solution engine and tightly integrated IDE and modelling language, so it is not widely used. Therefore, this paper uses CPLEX Studio software package for transportation problems to solve the optimal value of the second stage distribution problem. As the location-distribution planning problem, which belongs to strategic decision-making, affects the economic benefits of cruise line corporations directly, the optimization of calculation results is much higher than the timeliness.
5. Case study
Due to the vigorous development of Asian cruise tourism market, many international cruise groups have the intention to expand their market share in China. After investigation, an international cruise line enterprise intends to conduct pilot operation of cruise supply logistics distribution centres by leasing idle sites and equipment in Tianjin, Dalian, and Qingdao. There are four ship suppliers around the three regions that can meet the soda water requirements of cruise line corporation, which are S1, S2, S3, and S4. The cruise line corporation has identified five candidate logistics distribution centres D1, D2, D3, D4 and D5 through qualitative and quantitative methods, and intends to select 1 or 2 to provide supporting services for cruise ships, which supply soda water for cruise ships berthing in Tianjin (K1), Qingdao (K2), and Dalian (K3) cruise home ports.
5.1. Parameter settings
Considering the time window constraint of cruise replenishment and the replenishment lead time, the cruise line corporation requires that optimal distribution time of the logistics distribution centre should be 8–12 h after the purchase order is issued and the supplies arrive at the logistics distribution centre, not more than 14 h. In order to match the arrival time of cruise ships at the port, the distribution time of logistics distribution centres should be coordinated with the operation plan of cruise ships. Because that if the delivery is earlier to the time required, it will result in extra storage cost in the storage yard, the penalty cost is 2 yuan per ton per hour according to the storage cost, if the delivery is later to the time required, the cruise operation plan will be affected, the penalty cost of 10 yuan per ton per hour.
In addition, the data of ship supplier supply capacity, cruise ships demand, unit freight, delivery time, logistics distribution centres capacity, leasing cost, management cost, and unit turnover cost are shown in Tables .
Table 2. Unit delivery freight of ship suppliers to candidate logistics distribution centre (Unit: yuan).
Table 3. Unit distribution freight/time from candidate logistics distribution centres to cruise ports (Unit: yuan per Hour).
Table 4. Data of candidate logistics distribution centres.
Table 5. Supply ability of ship suppliers (Unit: tons).
Table 6. Cruise ships demand (Unit: tons).
5.2. Results analysis
5.2.1. The first stage
The optimal solutions are got by the Benders decomposition algorithm as shown in Tables and .
Table 7. Distribution quantities of candidate logistics distribution centres to cruise home ports (Unit:tons).
Table 8. Values of candidate logistics distribution centres.
5.2.2. The second stage
Using CPLEX Studio software, the result is calculated as Table .
Table 9. Distribution quantity from ship suppliers to logistics distribution centres (Unit: tons).
According to Table , the distribution quantity from ship supplier S1 and S2 to logistics distribution centre D1 is 2000 and 1000 tons, and the distribution quantity from ship supplier S4 to logistics distribution centre D4 is 2400 tons. The minimum distribution cost is 256,000 yuan, and the calculation time is 32 s. At the same time, the improved fast particle swarm optimization (APSO) algorithm [Citation1] is used to solve the distribution problem from ship suppliers to logistics distribution centres. In this algorithm, we set the parameters as follows:
The particle population size is 20, the number of iterations is 150, the Gama parameter is 0.95.
The algorithm was run 10 times independently in this environment, and the results were shown in Table .
Table 10. Results of 10 APSO independent calculations.
As can be seen from the table above, although the solving efficiency of the APSO algorithm is higher than CPLEX Studio software, the optimal value of the latter is closer to the optimal solution, and the optimal solution obtained by CELEX is much higher than APSO algorithm. Hence, it is more scientific to choose CPLEX Studio software to solve the distribution scheduling problem.
According to the two-stage method, the minimum logistics cost of location-distribution optimization model for the cruise supply logistics distribution centre is 1,431,200 yuan.
6. Conclusion and implications
In this paper, a location-distribution model is constructed for a cruise ship supply logistics distribution centre considering the time window. Considering the timeliness requirement of cruise supply, the penalty function of the time window is introduced on the basis of distribution, fixed, and variable costs, and capacity, which is closer to the reality. The model is solved by a ‘two-stage’ method: In the first stage, the cruise ship supply logistics distribution centre location and its flow allocation are obtained using the Benders decomposition algorithm. Then CPLEX Studio software is used to solve the flow allocation problem from ship supplier to service logistics distribution centre in the second stage, comparing with the APSO algorithm, the results show that CPLEX Studio has more advantages in getting optimal value than it. Although some constraints have been considered such as cost and efficiency in this study, many of the assumptions still have limitations, and the effects of those factors, such as risk, regulation, and constraints of Customs clearance efficiency and tax rebate rate at cruise home port, on locating decisions have not been taking into account. In addition, the location decisions of establishing logistics centre in the free trade zone or overseas storage centre under the considering of tax rebate rate have not been studied in in cruise global supply chain environment. These issues merits we should further study and solve.
Disclosure statement
No potential conflict of interest was reported by the authors.
Additional information
Funding
References
- Bansal, B., & Goyal, D. (2013). Path optimization using APSO. International Journal of Engineering, Applied and Management Sciences Paradigms, 5(7), 32–39.
- Chen, C. A. (2016). How can Taiwan create a niche in Asia’s cruise tourism industry? Tourism Management, 55, 173–183. doi: 10.1016/j.tourman.2016.02.015
- Fu, C. X., & Shou, J. M. (2015). The global cruise material supply chain research. Jiangsu Commercial Forum, (6), 21–24.
- Geoffrion, A. M., & Graves, G. W. (1974). Multicommodity distribution system design by benders decomposition. Management Science, 20(5), 822–844. doi: 10.1287/mnsc.20.5.822
- Javid, A. A., & Azad, N. (2010). Incorporating location, routing and inventory decisions in supply chain network design. Transportation Research Part E Logistics & Transportation Review, 48(2), 485–502.
- Li, Y., Zhao, J., & Wu, G. (2012). Model and algorithm for location-distribution problem in two-stage distribution network[J]. Computer Integrated Manufacturing Systems, 18(11), 2546–2553.
- Tancrez, J. S., Lange, J. C., & Semal, P. (2010). A location-inventory model for large three-level supply chains. Transportation Research Part E Logistics & Transportation Review, 46(5), 582–597. doi: 10.1016/j.tre.2009.06.005
- Vaggelas, G. K., & Lagoudis, I. N. (2010). Analysing the supply chain strategy of the cruise industry – the case of a small cruise company. International Association of Maritime Economists (IAME 2010), Lisbon.
- Véronneau, S., & Cimon, Y. (2007). Maintaining robust decision capabilities: An integrative human-systems approach. Decision Support Systems, 43(1), 127–140. doi: 10.1016/j.dss.2006.08.003
- Véronneau, S., & Roy, J. (2009). Global service supply chains: An empirical study of current practices and challenges of a cruise line corporation. Tourism Management, 30(1), 128–139. doi: 10.1016/j.tourman.2008.05.008
- Weaver, A. (2005). The Mcdonaldization thesis and cruise tourism. Annals of Tourism Research, 32(2), 346–366. doi: 10.1016/j.annals.2004.07.005
- Zhang, X. N., Fan, H. M., & Li, J. F. (2015). Bi-objective fuzzy location model and algorithm for the design of logistics distribution network in B2C e-commerce. Systems Engineering – Theory & Practice, 35(5), 1202–1213.