
 ?Mathematical formulae have been encoded as MathML and are displayed in this HTML version using MathJax in order to improve their display. Uncheck the box to turn MathJax off. This feature requires Javascript. Click on a formula to zoom.
Abstract
In view of the problems of abandoning wind and solar energy, and carbon emissions, inevitable reduce of thermal power generation caused by the consumption of wind and solar energy, and the changes in the proportion of wind and solar energy consumption to thermal power at different times under the influence of time-of-use price, a time-of-use ladder carbon emission rights exchange mechanism is proposed, and on this basis, a low-carbon virtual power plant optimal dispatching model with ‘wind-solar-gas-storage’ is built. The maximum daily operating income of the virtual power plant is taken as the objective function in the model. The IBM commercial solver CPLEX is employed to optimize the solution, so as to obtain the optimal economic dispatching strategy of the virtual power plant, and compares it with the set scenarios. The simulation results reveal that the proposed mechanism can effectively enhance the enthusiasm and operating benefits of virtual power plants for renewable energy consumption, and reduce carbon emissions, providing new methods for low-carbon dispatching, and wind and solar energy consumption of virtual power plants.
1. Introduction
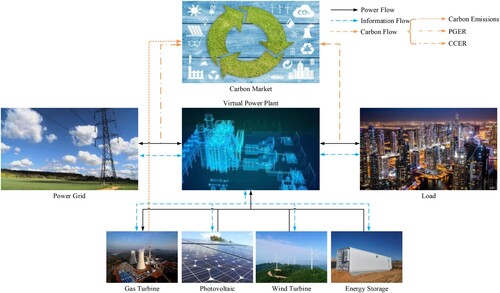
With the growing demand for energy in the development of the world economy, problems such as environmental pollution, the depletion of fossil energy, and climate change are becoming increasingly serious (Cao et al., Citation2018; Jizhen et al., Citation2014; Pandžić et al., Citation2013). Making full use of distributed renewable energy (DRE) and improving energy efficiency are the best solutions to these problems. According to the ‘EU Energy Roadmap’, it is estimated that by 2050, DREs will meet more than 50% of the world's energy demand (Hübler & Löschel, Citation2013). However, Distributed Energy Resources (DER), including energy storage (ES), DREs and interruptible load, is characterized by scattered locations, strong randomness, and difficult management. The disorderly grid connection of a large number of DERs will have a huge impact on the operation of power grid (PG) (Guorong & Xiaran, Citation2017; Hua et al., Citation2020; Ji et al., Citation2018; Peng et al., Citation2021). Virtual Power Plant (VPP) is a unique DERs aggregation and management technology (Hui et al., Citation2022; Pudjianto et al., Citation2007; Shabanzadeh et al., Citation2015). Through advanced communication technology, it can dispatch DERs in a centralized manner, which can not only reduce the impact of its output fluctuation on the PG, but also reduce the difficulty of dispatching, allowing DERs to better participate in the dispatching of the PG.
Due to the random output and less competitive price of DREs, abandoning wind and solar energy exists in actual dispatching, which is acting as a hindrance to VPP from fully realizing its potential in carbon emission reduction (Nafkha-Tayari et al., Citation2022; Naval & Yusta, Citation2021; Zhou et al., Citation2020). The National New Energy Consumption Monitoring and Early Warning Center pointed out in the ‘Evaluation and Analysis of National New Energy Power Consumption in the First Quarter of 2022’ that the national abandoned wind power and photovoltaic power are about 6 billion kWh and about 2.4 billion kWh, respectively (NNEC Monitoring & Center E.W., Citation2022). If they are fully utilized, the realization of the worlds’ goal of ‘double carbon’ will be undoubtedly accelerated. At present, DREs consumption under the optimal dispatching of VPP has been studied at home and abroad. Reference (Gao et al., Citation2016) constructed a two-layer optimal dispatching model of the main network and VPP, and the ability of VPP to accommodate DREs is enhanced by the introduction of wind curtailment penalties. Reference (Xin et al., Citation2016) proposed a pricing method of VPP user-side time-of-use (TOU) price that includes wind power on a long-term scale, and uses a price-based demand response method to increase the proportion of wind power consumption. Reference (Hongshang & Ran, Citation2017) established an optimal dispatching model of VPP including ‘wind-solar-gas-storage’, and promoted the consumption of wind and solar energy by VPP by introducing penalties for abandoning wind and solar energy. Reference (Wenlue et al., Citation2015) constructed a benefit distribution model between VPP and power distribution companies including ‘wind-solar-water’, and promoted the consumption of wind and solar by VPP through the constraints of abandoning wind and solar. Reference (Jie et al., Citation2019) constructed a VPP dispatching model including ‘fire-solar-wind-water-storage’, and promoted the consumption of wind and solar energy by VPP by considering the cost of carbon emissions. Reference (Guo et al., Citation2022) constructed a VPP consisting of combined heat and power, wind turbines (WT), photovoltaics (PV), P2G equipment, carbon capture devices, and gas-storage devices to achieve multi-energy complementarity in the form of combined heat and power, and to reduce carbon emissions while achieving environmental protection. Part of the existing research focuses on improving the ability of VPP to absorb wind and solar energy by introducing penalties for abandoning wind and solar energy, constraints on abandoning wind and solar energy, and carbon emission penalties, but these measures weakened its enthusiasm for wind and solar consumption to a certain extent. The other part uses the form of combined heat and power to convert carbon dioxide into natural gas by using the surplus power of wind and solar, reducing carbon emissions and absorbing wind and solar. But in fact, the efficiency of electricity to natural gas is only 55% (Cui et al., Citation2020; Liu et al., Citation2015), and the electricity mostly losses in the conversion between energy sources.
Aiming at abandoning wind and solar energy, and carbon emissions, we make three theoretical contributions: First, considering the consumption of wind and solar energy will inevitably reduce thermal power generation, we propose a strategy of exchanging carbon emission rights. Through the consumption of DREs, carbon emission quotas can be exchanged, thereby promoting the consumption of DREs, reduce carbon emissions; Second, considering that under the influence of time-of-use prices, the proportions of wind and solar consumption to thermal power generation at different time are different, and the corresponding carbon emission factors are also different, we propose the time-of-use carbon emission factor of PG, and by integrating the time-of-use average power generation of thermal power and renewable energy, the carbon emission benchmark value of thermal power units (0.8729 tCO2/MWh) and the average carbon emission of PG (0.6101 tCO2/MWh), and finally we get the time-of-use carbon emission factor of PG. Last, in response to the low electricity price during the valley and usual times cannot meet the cost of wind and solar consumption, so wind and solar abandonment occurs frequently, we propose a ladder exchange strategy. With the increase in the consumption of DREs, more carbon emission quotas can be exchanged. Combining the above, a time-of-use ladder carbon emission rights exchange mechanism is formed. Aiming at issues such as abandoning wind and solar, and carbon emissions, this paper takes the maximum daily operating income of VPP as the objective function, and constructs a VPP economic optimization based on a time-of-use ladder carbon emission rights exchange mechanism that includes ‘wind-solar-gas-storage’. Through the comparison between the dispatching model and the penalty scenario of abandoning wind and solar, and the stepped carbon trading scenario, the carbon emissions, carbon emission reductions, dispatching benefits, and wind and solar consumption ratios in different scenarios are studied to verify the effectiveness of the proposed mechanism.
2. Time-of-use ladder carbon emission rights exchange mechanism
The carbon trading mechanism achieves the purpose of controlling carbon emissions by establishing legal carbon emission rights and allowing producers to trade carbon emission rights in the market (Chen et al., Citation2022; Liu et al., Citation2018). The carbon quota of each carbon emission source is allocated by the regulatory department, and the carbon source must adjust the emission according to the quota. If the actual carbon emission does not exceed the quota, the remaining carbon can be traded through the carbon trading market, otherwise, it needs to be purchased. Free quota is the main quota method currently used in the world. The consumption of DREs inevitably reduces thermal power generation, the reduced carbon quota can be exchanged to VPP through the exchange mechanism, and the proportion of wind and solar power consumption and thermal power at different times varies under the influence of time-of-use electricity prices, and hence the corresponding carbon emissions per unit of electricity are also different. In order to further reduce carbon emissions, this paper proposes a time-of-use ladder carbon emission rights exchange mechanism, which divides three periods of the peak, usual and valley and multiple exchange intervals. Over the different consumption periods of DREs, the carbon quota coefficient is different. As the consumed electricity increases, the carbon quota exchanged in the corresponding range also increases. The schematic diagram of this mechanism is as follows.
As shown in Figure , the carbon emission allowances redeemed by VPP mainly consist of two parts, which are the China Certified Emission Reduction (CCER) acquired by its own DREs consumption and the Power Grid Emission Reduction (PGER) exchanged with PG, with a maximum offset rate of CCER quota of not more than 6% (Li et al., Citation2019). The detailed process of the proposed mechanism is as follows.
Step 1: Allocate carbon emission base quota: Calculate the total carbon emission of VPP according to the time-of-use carbon emission factors and load, and allocate it to VPP as carbon emission base quota;
Step 2: Calculate the max carbon quota of CCER: Calculate the max carbon quota of CCER according to the maximum offset rate of CCER and the total carbon emission of VPP;
Step 3: Exchange carbon emission quota: Exchange carbon emission quota according to the energy consumption of DREs. When the energy of DREs is used for VPP internal consumption and the total carbon quota of CCER does not exceed its maximum limit, it can be used to exchange for the carbon quota of CCER, and the carbon quota of CCER exceeded should set to 0. When the energy of DREs is sold to PG, it can be used to exchange for the carbon quota of PGER;
Step 4: Introduce PGER and CCER into the objective function;
Step 5: Use CPLEX optimization to solve the optimal dispatching strategy;
Step 6: VPP dispatch DERs and GT to meet load power demand.
The flowchart of proposed mechanism is shown in Figure .
The models are shown as follows.
(1)
(1)
(2)
(2)
(3)
(3) where
is the carbon emission quota of CCER or PGER exchanged by DREs’ output at time t;
is the conversion coefficient of carbon emission quota per kilowatt-hour at time t;
is the quota growth rate;
is the actual output of DREs at time t, when
is used for VPP internal consumption,
represents the CCER, and when
is sold to PG,
represents the PGER;
is the output interval coefficient of DREs;
is the total power generation of DREs at time t.
is the maximum offset rate of CCER quota, 6%;
is the load power at time t.
Figure 1. Schematic diagram of the proposed mechanism.
3. Optimal dispatch model
3.1 Objective function
The optimal dispatch model takes the maximum daily operating income of VPP as the objective function, taking into account DERs output cost, gas turbine (GT) output cost, carbon emission cost and VPP’s power purchase cost from the PG. While VPP’s income comes from carbon trading, sales excess power to the PG, and internal load power supply. The objective function is shown as follows.
(4)
(4) In addition to the basic carbon emission quota of the virtual power plant, the consumption of DREs will exchange for the carbon emission quota, and the output of GT will consume the carbon quota, and the excess carbon emission quota can be used to obtain income in the carbon market.
(5)
(5) VPP can sell surplus electricity to the PG, or sell electricity to the PG when the PG purchase price is high, or purchase electricity from the PG when the PG sell price is low. Thereby gaining benefits through interaction with PG.
(6)
(6) The internal revenue of VPP includes the income of selling electricity to the load side and the cost of power supply. Power supply costs include PV output costs, WT output costs, ES charge and discharge costs, and GT operating costs.
(7)
(7) GT operating costs consists of three parts, namely start-up cost, running cost and climbing cost. There will be a one-time cost at the moment of starting the GT, and the gas will continue to be consumed during the operation of the GT. The cost will also be required during the climbing and descending of the GT.
(8)
(8)
(9)
(9)
(10)
(10)
(11)
(11) where
,
,
, and
are the VPP daily dispatching income, the carbon trading market income, the PG interaction income, and the VPP power supply income respectively;
,
,
, and
are the carbon trading price, PG purchase price, PG sale price and VPP internal electricity price at time t;
,
,
, and
are the carbon emissions quota of CCER and PGER exchanged by DREs at time t, the basic carbon quota allocated by regulatory authorities, and the carbon emissions of GT at time t respectively.
,
,
,
,
,
, and
are the power purchased by the PG, the power sold by the PG, the power required by VPP internal load, the WT output, the PV output, the ES charging and discharging power, and the GT climbing power at time t respectively;
,
,
, and
are WT output cost, 0.52 yuan/kWh, PV output cost, 0.55 yuan/kWh, ES charging and discharging cost, 0.40 yuan/kWh and GT start-up and shutdown cost, 45 yuan/time;
,
,
, and
are GT output cost, start-up and shutdown cost, operation cost and climbing cost at time t;
is the running state of GT at time t (
,
represent running);
is the price of natural gas, 2.87 yuan/m3;
is the conversion rate of natural gas and electricity, 7.1 kW/m3;
is the climbing cost coefficient of GT, 0.8 yuan/kW.
3.2 Constraints
3.2.1 Constraints of power balance
(12)
(12) where
is the interaction power between VPP and PG at time t, when
, VPP purchases power from the PG, on the contrary, VPP sells electricity to the PG.
3.2.2 Constraints of PG interaction
Due to the limited transmission power of transmission line, there is a certain upper limit for the interaction between VPP and PG.
(13)
(13) where
is the maximum transmission power of transmission line.
3.2.3 Constraints of GT
The output of the GT is of a certain limit, and the GT has a certain climbing rate. At the same time, the state of the GT can only be one of ‘start’, ‘close’, ‘climbing’, ‘descending’, and ‘standing’. In order to ensure the life of the GT, the maximum output time is set.
(14)
(14)
(15)
(15)
(16)
(16)
(17)
(17) where
is the climbing rate of GT, 20%/h;
,
,
,
, and
are the status of the GT, which are ‘start’, ‘close’, ‘climbing’, ‘descending’ and ‘standing’ respectively;
is the maximum operating time of GT, 18 h.
3.2.4 Constraints of ES
The ES makes up for the randomness and volatility of DREs output, which is conducive to the stable output and reliable operation of VPP. In order to ensure the service life of ES, the maximum charge and discharge capacity is limited. Additionally, the state of charge (SOC) is required to be within a certain range. To ensure sustainable dispatching, the SOC of the ES should be equal at the beginning and end, and the ES in only one of the three states of ‘charging’, ‘discharging’ or ‘standing’.
(18)
(18)
(19)
(19)
(20)
(20)
(21)
(21) where
and
are maximum charge and discharge capacity for one hour of ES;
is the SOC of ES at time t;
is maximum capacity of ES;
and
are minimum and maximum SOC values of ES;
,
, and
are the states of the ES at time t, which are ‘charging’, ‘discharging’ and ‘standing’ respectively.
3.3 Solving method
The optimal dispatching model constructed in this paper is a mixed integer linear programming model, which is optimized and solved by IBM commercial solver CPLEX.
4. Case analysis
In order to verify the effectiveness of the proposed model, a VPP consisting of a 250 kW WT, a 100 kW PV, a 200 kW ES, a 250 kW GT and a 500 kW load is selected. The parameters of the time-of-use ladder carbon emission rights exchange mechanism, time-of-use carbon emission factors, and time-of-use (TOU) price are shown in Table , Table and Table .
Table 1. Parameters of the time-of-use ladder carbon emissions exchange mechanism.
Table 2. Parameters of time-of-use carbon emission factors.
Table 3. Parameters of TOU price.
The typical daily scenario data in Tibet is selected and the comparison and verification were carried out in the penalty scenario of abandoning wind and solar energy (Scenario 1), the stepped carbon trading scenario (Scenario 2) and the scenario under the mechanism proposed in this paper (Scenario 3). The actual power generation of VPP internal load demand, WT, and PV are shown in Figure , and the dispatching strategies, wind power consumption, and solar power consumption under the three scenarios are shown in Figure , Figure , and Table , respectively, and Scenarios 1–3 follow from (a) to (c).
Figure 2. Flowchart of the proposed mechanism.
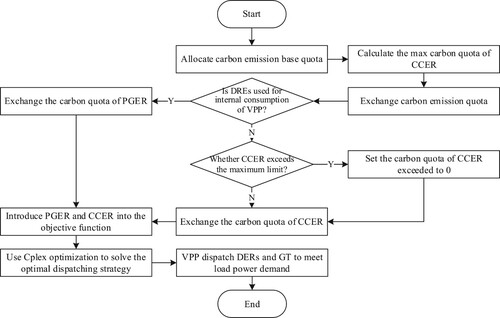
Figure 3. Data of typical scenario.
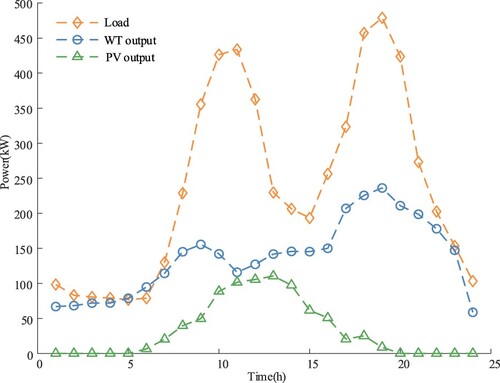
Figure 4. Dispatching strategies.
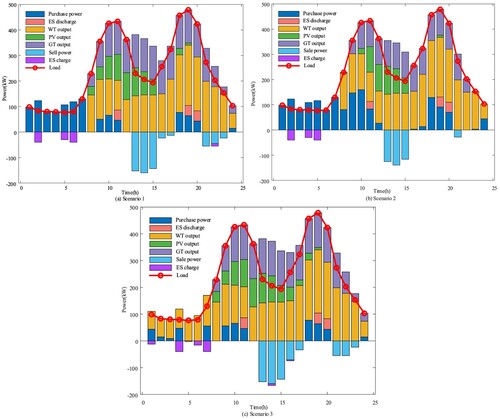
Table 4. Wind and solar power consumption.
From the above results, in Scenario 1, the electricity sales price of the PG during valley time is the lowest during the entire day, and still lower than the output cost of WT and PV after the addition of abandon wind and solar penalties. Therefore, VPP first purchases electricity from the PG to meet the demand of internal loads, accepts the wind power and solar power penalty, and charges the ES, leading to the total abandonment of the wind and solar power at valley time (wind and solar consumption: 0%). In usual time, the electricity sales price of the PG is higher than the output cost of WT, while lower than the output cost of PV. The operating cost of GT is lower than the output cost of WT, but is higher than the output cost of WT after the abandon wind penalty is implemented, yet lower than cost of PV after the penalty of abandon solar is implemented, the electricity sales price of the PG plus the penalty for abandoning wind and solar power is higher than the output cost of WT, so VPP gives preference to wind power consumption, followed by GT, then photovoltaic consumption, and finally the purchase of electricity from the PG. GT are climbing with a certain upper limit, so VPP chooses to purchase electricity from the PG when the output of GT and WT is not enough to meet the load demand. After the load demand is met, VPP will discard the remaining photovoltaics, and restore the ES to the initial state at the final discharge moment. This part is mainly contributed by WT, GT and PV (wind power consumption: 100%, photovoltaic consumption: 71.83%). In the case of peak time, the power purchase price of the PG exceeds the output cost of WT and PV, so VPP chooses to fully absorb the wind and solar energy. When VPP considers the two peaks of power consumption of the load, the GT will be ramped up. Because the ramp up and down slope requires a certain cost, the GT are generally at full output during peak time and the ES is fully discharged to meet the internal load demand. And the excess electricity is sold to the PG to make profits. But when the transmission power exceeds the transmission line, VPP tends to abandon solar (wind power consumption: 100%, photoelectric absorption: 98.66%). In Scenario 1, the total wind power consumption and the total photoelectric consumption are 82.81% and 85.94%.
Similar to Scenario 1, the electricity price of the PG at valley time is lower than the output cost of wind power, so VPP chooses to discard all wind power (wind power consumption: 0%), purchase power from the PG to meet the load demand, and charge the ES until it reaches the upper limit of SOC. At usual time, the PG selling price and GT operating cost are higher than the WT output cost, and lower than the PV output cost. Taking into account the climbing constraint of GT and the stepped carbon emission mechanism, VPP will greatly limit the output of GT and limit its carbon emissions to the second stage. At this time, VPP gives priority to the GT output, followed by WT output, power purchase from the PG, and finally PV output, When the output of GT and WT meets the load demand, VPP chooses to abandon wind (wind power consumption: 98%, photoelectric consumption: 7.79%). The peak time is similar to Scenario 1, while the difference is that the wind and solar are fully absorbed after the output of the GT is limited (wind and solar consumption: 100%). In Scenario 2, the total wind power consumption and total photoelectric consumption are 81.95% and 64.44%, respectively.
In Scenario 3, since the consumption of wind and solar can be exchanged for carbon emission quotas, and additional carbon income can be obtained through the carbon trading market, VPP chooses to fully consume wind and solar power. During valley and peak time, VPP chooses to give up some solar power, considering the TOU price, carbon trading income, WT, PV output cost, GT output cost, start-stop cost, and climbing cost. When the carbon exchange mechanism during valley time is taken into account, the electricity sales price of the PG is higher than the cost of wind power, yet lower than the cost of photovoltaics. At this time, wind power will be consumed first, and the part that does not meet the load demand is made up by purchasing electricity from the PG (wind power consumption: 100%, photovoltaic consumption: 0%). When the carbon exchange mechanism in usual time is taken into account, the electricity sales price of the PG is higher than the output cost of wind and solar, and VPP chooses to fully consume wind and solar, and the part that does not meet the load demand is firstly compensated by GT, followed by the purchase of power from the PG (wind and solar consumption: 100%). The peak time is similar to Scenario 1 (wind power consumption: 100%, photoelectric consumption: 98.66%). In Scenario 3, the total wind power and photoelectric consumption are 100% and 95.77%, respectively.
The benefits and carbon emissions under the three scenarios are shown in Table .
Table 5. Benefits and carbon emissions.
Under the mechanism proposed in this paper, VPP is converted to 199.89 kg of CCER and 338.91 kg of PGER, and the daily dispatch income is 942.89 yuan, with an increase of 295.62 yuan or 45.67% compared with the 647.27 yuan in scenario 1, and an increase of 226.03 yuan compared with the 716.86 yuan in scenario 2, an increase of 31.53% in scenario 3. The consumption degree of wind power increased from 82.81% in scenario 1 and 81.95% in scenario 2–100%, which increased by 20.76% and 22.02% separately. The consumption degree of solar power increased from 85.94% in scenario 1 and 64.44% in Scenario 2–95.77%, with an increase of nearly 11.44% and 48.62%, respectively. It can be seen that the mechanism proposed in this paper can further absorb wind and solar power while improving the operating income of VPP.
Compared with Scenario 2, Scenario 1 has a marginal improvement in wind and solar power consumption. It can be seen that the penalty of abandoning wind and solar promotes wind and solar consumption to a certain extent, but it cannot solve the problem of wind and solar power consumption in valley time.
The carbon emissions under the three scenarios are shown in Figure , with scenarios 1–3 from (a) to (c). Where the value is greater than 0, it is carbon emission, otherwise, it is carbon emission reduction.
Figure 5. Consumption of wind and solar energy.
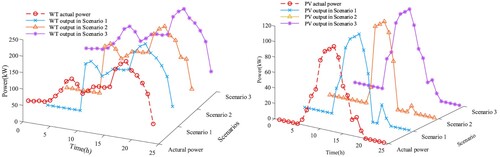
Figure 6. Carbon emissions and carbon reduction.
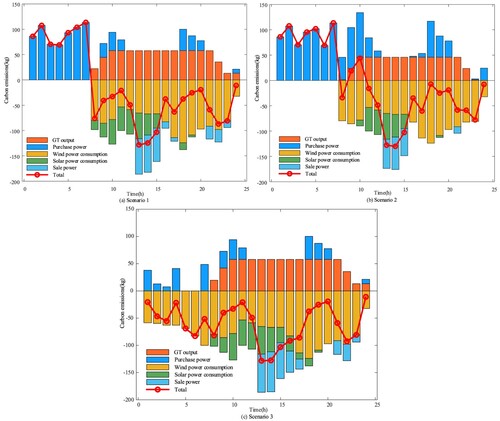
In Scenario 1, the carbon emission of VPP in its dispatching period is 810.53 kg, and the figure is 600 kg in Scenario 2 and 805.26 kg in Scenario 3. It can be seen that the stepped carbon trading mechanism effectively reduces the actual carbon emission of VPP, but it cannot solve the problem of wind and solar power consumption in the valley time. The carbon emission reduction caused by Scenario 3 wind and solar power consumption is 2,201.75 kg, an increase of 533.39 kg compared with 1,668.36 kg in Scenario 1, and an increase of 592.5 kg compared with 1,609.25 kg in Scenario 2. The total carbon emission reduction in Scenario 3 is 1,396.49 kg, an increase of 387.24 kg (nearly 38.36%) compared with 1,009.25 kg in Scenario 2, and an increase of 538.66 kg (62.79%) compared with 857.83 kg in Scenario 1. It can be found that the mechanism proposed in this paper can further achieve the purpose of carbon emission reduction.
In view of the phenomenon that solar is still abandoned at the valley time and peak time in Scenario 3, this paper verifies it by modifying the quota growth rate in the time-of-use ladder carbon emission rights exchange mechanism. The results for solar power consumption under different λ conditions are shown in Table .
Table 6. Solar power consumption under different λ conditions.
It can be seen from the above table that when λ increases from 10% to 12.4%, VPP changes from abandoning solar power completely to full solar consumption at valley time; When λ increases from 12.4% to 13.2%, VPP changes from partial abandoning solar power to full solar consumption at peak time.
5. Conclusion
Aiming at issues such as wind and solar power abandonment and carbon emissions, considering that wind and solar consumption will inevitably reduce thermal power generation, and under the influence of TOU prices, the proportion of wind and solar power consumption to thermal power is different at different times, and the corresponding carbon emissions are also different; electricity prices are low during valley and usual times, which cannot meet the cost of wind and solar power consumption, and there is a large number of abandoned wind and solar. This paper proposes a time-of-use ladder carbon emission rights exchange mechanism, and sets up scenarios for comparative analysis. Draw the following conclusions:
The penalty for abandoning wind and solar promotes wind and solar consumption to a certain extent. The step-style carbon trading restricts the output of GT by controlling carbon emissions, thereby achieving the purpose of promoting wind and solar power consumption. However, neither of these two methods can fundamentally solve the problem that the electricity price does not meet the cost of wind and solar power consumption during the valley and usual times, therefore the phenomenon of abandoning wind and solar energy still exists.
The mechanism proposed in this paper fundamentally solves the above problems. With low electricity price during valley time, the PG mainly adopts thermal power generation. By promoting the consumption of wind and solar, the thermal power is reduced, carbon emissions are reduced, and carbon quotas are exchanged. Through the income obtained from the carbon trading market, the proportion of wind and solar consumption has been increased, and the effectiveness of the mechanism proposed in this paper has been verified;
In terms of solar power abandonment that still exists, by modifying the quota growth rate parameter in the exchange mechanism, it is found that the full consumption of solar can be realized to a certain extent. The results show that the mechanism proposed in this paper not only greatly increases the dispatching income of VPP and the enthusiasm of VPP for wind and solar power consumption, but also verifies the feasibility and practicability of low-carbon VPP, and provides new information for VPP low-carbon economic dispatch and comprehensive wind and solar power consumption methods.
Disclosure statement
No potential conflict of interest was reported by the author(s).
Correction Statement
This article was originally published with errors, which have now been corrected in the online version. Please see Correction (http://dx.doi.org/10.1080/21642583.2023.2187570)
Additional information
Funding
References
- Cao, Y., Li, Q., Tan, Y., Li, Y., Chen, Y., Shao, X., & Zou, Y. (2018). A comprehensive review of energy internet: basic concept, operation and planning methods, and research prospects. Journal of Modern Power Systems and Clean Energy, 6(3), 399–411. https://doi.org/10.1007/s40565-017-0350-8
- Chen, D., Liu, F., & Liu, S. (2022). Optimization of virtual power plant scheduling coupling with p2g-ccs and doped with gas hydrogen based on stepped carbon trading. Power System Technology, 46(06), 2042–2054. https://doi.org/10.13335/j.1000-3673.pst.2021.2177
- Cui, Y., Yan, S., Zhong, W., Wang, Z., Zhang, P., & Zhao, Y. (2020). Optimal thermoelectric dispatching of regional integrated energy system with power-to-gas. Power System Technology, 44(11), 4254–4264. https://doi.org/10.13335/j.1000-3673.pst.2019.2468
- Gao, Z., Xu, W., Chuanwen, J., Yu, Z., & Zhengyu, W. (2016). Economic analysis of virtual power plants based on bi-level optimization dispatch. Power System Technology, 40(8), 2295–2301. https://doi.org/10.13335/j.1000-3673.pst.2016.08.007
- Guo, W., Mao, Y., Zhang, X., & Yin, H. (2022). Internal benefit optimization model of gas-thermal power virtual power plant under China's carbon neutral target. Energy Science & Engineering, 10(4), 1227–1239. https://doi.org/10.1002/ese3.1097
- Guorong, Z., & Xiaran, C. (2017). Future development of energy internet. Proceedings of the EPAE, 37(1), 1–7. https://doi.org/10.16081/j.issn.1006-6047.2017.01.001
- Hongshang, Z., & Ran, L. (2017). Benefit analysis of optimal schedule of virtual power plant under reward-punishment mechanism. Power System Technology, 41(9), 2840–2846. https://doi.org/10.13335/j.1000-3673.pst.2017.0907
- Hua, P., Zuofang, L., Qiangzhong, X., Fang, Z., & Yuhan, X. (2020). Economic dispatch of wind/pv/gas/storage virtural power plant based on time-of-use power price. Proceedings of the AESS, 41(8), 115–122. https://doi.org/10.19912/j.0254-0096.2020.08.016
- Hübler, M., & Löschel, A. (2013). The EU decarbonisation roadmap 2050-what way to walk? Energy Policy, 55, 190–207. https://doi.org/10.1016/j.enpol.2012.11.054
- Hui, S., Xuanxuan, F., Shubo, H., Feixiang, P., Jinsong, L., & Changhai, S. (2022). Internal and external coordination biddingstrategy of virtual power plant participating in day-ahead power market. Power System Technology, 46(04|4), 1248–1262. https://doi.org/10.13335/j.1000-3673.pst.2021.1819
- Ji, X., Li, Y., Yu, Y., & Fan, S. (2018). Optimal dispatching and game analysis of power grid considering demand response and pumped storage. Systems Science & Control Engineering, 6(3), 270–277. https://doi.org/10.1080/21642583.2018.1553074
- Jie, Y., Zhang, X., Yong, T., Chen, R., & Li, J. (2019). Low carbon power dispatch strategy for regional integrated virtual power plants under the constraint of environmental impact assessment. Ekoloji, 28(107), 1411–1416.
- Jizhen, L., Mingyang, L., Fang, F., & Yuguang, N. (2014). Review on virtual power plants. Proceedings of the CSEE, 34(29), 5103–5111. https://doi.org/10.13334/j.0258-8013.pcsee.2014.29.012
- Li, L., Ye, F., Li, Y., & Chang, C.-T. (2019). How will the Chinese certified emission reduction scheme save cost for the national carbon trading system? Journal of Environmental Management, 244, 99–109. https://doi.org/10.1016/j.jenvman.2019.04.100
- Liu, L., Chen, C., Zhao, Y., & Zhao, E. (2015). China’s carbon-emissions trading: Overview, challenges and future. Renewable and Sustainable Energy Reviews, 49, 254–266. https://doi.org/10.1016/j.rser.2015.04.076
- Liu, Z., Zheng, W., Qi, F., Wang, L., Zou, B., Wen, F., & Xue, Y. (2018). Optimal dispatch of a virtual power plant considering demand response and carbon trading. Energies, 11(6), 1488. https://doi.org/10.3390/en11061488
- Nafkha-Tayari, W., Ben Elghali, S., Heydarian-Forushani, E., & Benbouzid, M. (2022). Virtual power plants optimization issue: A comprehensive review on methods, solutions, and prospects. Energies, 15(10), 3607. https://doi.org/10.3390/en15103607
- Naval, N., & Yusta, J. M. (2021). Virtual power plant models and electricity markets-a review. Renewable and Sustainable Energy Reviews, 149, 111393. https://doi.org/10.1016/j.rser.2021.111393
- NNEC Monitoring & Center E. W. (2022, May 25). Evaluation and analysis of national new energy power consumption in the first quarter of 2022. https://www.candela.cn/21c08c79b1/.
- Pandžić, H., Kuzle, I., & Capuder, T. (2013). Virtual power plant mid-term dispatch optimization. Applied Energy, 101, 134–141. https://doi.org/10.1016/j.apenergy.2012.05.039
- Peng, F., Hu, S., Fan, X., Sun, H., Zhou, W., Guo, F., & Song, W. (2021). Sequential coalition formation for wind-thermal combined bidding. Energy, 236, 121475. https://doi.org/10.1016/j.energy.2021.121475
- Pudjianto, D., Ramsay, C., & Strbac, G. (2007). Virtual power plant and system integration of distributed energy resources. IET Renewable Power Generation, 1(1), 10–16. https://doi.org/10.1049/iet-rpg:20060023
- Shabanzadeh, M., Sheikh-El-Eslami, M.-K., & Haghifam, M.-R. (2015). The design of a riskhedging tool for virtual power plants via robust optimization approach. Applied Energy, 155, 766–777. https://doi.org/10.1016/j.apenergy.2015.06.059
- Wenlue, D., Qun, W., & Li, Y. (2015). Coordination dispatching model of virtual power plant and distribution company with wind and water. Automation of Electric Power Systems, 9, 75–81.
- Xin, A., Shupeng, Z., & Yuequn, Z. (2016). Study on time of use pricing of user side considering wind power uncertainty. Power System Technology, 40(5), 1529–1535. https://doi.org/10.13335/j.1000-3673.pst.2016.05.035
- Zhou, B., Zhang, K., Chan, K. W., Li, C., Lu, X., Bu, S., & Gao, X. (2020). Optimal coordination of electric vehicles for virtual power plants with dynamic communication spectrum allocation. IEEE Transactions on Industrial Informatics, 17(1), 450–462. doi:10.1109/TII.2020.2986883