
Abstract
Hepatitis B can be effectively prevented by hepatitis B vaccination. However, hyporesponse to the hepatitis B vaccine has been found in both human and inbred mice with particular MHC alleles or haplotypes, but the mechanisms underlying this poor response remains elusive. In the present study, we investigated the mechanisms underlying the hyporesponse to hepatitis B vaccination using B10.S-H2s/SgMcdJ (B10.S, H-2s, poor responder) and C57BL/10J (B10, H-2b, good responder) mice. We observed that the B10.S mice displayed a hyporesponse to HBsAg vaccine but a normal response to 3 other foreign antigens (influenza A (H1N1) 2009 monovalent vaccine, tetanus toxoid and ovalbumin). In B10.S mice immunized with HBsAg, the levels of serum anti-HBs IgG, the number of HBsAg-specific IgG-secreting plasma cells and HBsAg-specific Th cells were considerably lower than that in B10 mice. Further, the findings of the insufficient maturation (CD86), co-stimulation (CD40) and migration (CCR7) activities of DCs together with the inadequate activation of the HBsAg-specific Th cells by APCs were identified as part of the reason for the HBsAg hyporesponse in B10.S mice, which supports the hypothesis that measures aimed at promoting the maturation, co-stimulation or migration of APCs to enhance Th cell activation may be a useful strategy for the development of new hepatitis B vaccines.
Introduction
The clinical course of chronic HBV infection varies from the asymptomatic carrier state to chronic hepatitis, to cirrhosis and even to hepatocellular carcinoma (HCC).Citation1,2 Therefore, it is more beneficial to prevent HBV infection through vaccination rather than treatment. The hepatitis B vaccine (recombinant hepatitis B surface antigen, rHBsAg) is safe and effective for the prevention of hepatitis B infection worldwide.Citation3 However, the antibody responses to the hepatitis B vaccine vary widely between individuals. In general, it is preferable to achieve anti-HBs levels greater than 100 mIU/mL, whereas levels between 10 and 100 mIU/ml are considered a poor response, and levels less than 10 mIU/ml are considered a non-response.Citation4 There is no direct evidence that low/non-responders to the hepatitis B vaccine are more susceptible to HBV infection,Citation5 but in initially protected persons, the risk of late HBV infection is markedly increased when the anti-HBs levels decrease to less than 10 mIU/ml,Citation6 which may also occur in hepatitis B vaccine low/non-responders.
Compared with perinatal environmental factors, genetic factors (genes, vertical transmission of HBV, etc.) play a dominant role (91%) in determining the HBV vaccination responses in infants.Citation7 Among the many genetic factors affecting the response to hepatitis B vaccine,Citation8-12 HLA-related genes have attracted much attention.Citation13,14 A meta-analysis of 774 potentially relevant articles revealed that DRB1*01, DRB1*1301 and DRB1*15 were associated with a good response to the HBV vaccine, whereas DRB1*03 (DRB1*0301), DRB1*04, DRB1*07 and DRB1*1302 were abundantly found in poor responders.Citation10 Because the HLA genes are highly polymorphic in humans, inbred strains of animals are needed to clarify the mechanism underlying the different responses to the hepatitis B vaccine.
Inbred mice are often used as models of human major histocompatibility complex (MHC)-associated diseases, including insulin-dependent diabetes mellitus (IDDM), multiple sclerosis (MS), arthritisCitation15 and parasitic infections.Citation16 The MHC class II regions of humans and mice are similar in arrangement, and human HLA-DR, DQ and DP resemble mouse IA and I-E.Citation17 Millich et al. found that mice with different H-2 haplotypes respond differently to HBsAg: the H-2q haplotype is highly responsive to the hepatitis B vaccine, whereas the H-2a, b, d, and k haplotypes are associated with a normal response, and the H-2s and f haplotypes are poorly responsive to the hepatitis B vaccine.Citation18,19 However, the mechanisms underlying the low response to the hepatitis B vaccine is worth further investigation in both animal models and humans.
Once hepatitis B vaccine (rHBsAg), as an exogenous antigen, enters the body for the first time via immunization, it can be processed into peptide antigens and transported to the cell surface with MHCII molecules.Citation20 Subsequently, DCs undergo the differentiation and maturation processes and favor the activation and differentiation of T helper cells.Citation21 B cells encounter rHBsAg, become activated and differentiate into one of 2 types of B cells, namely memory B cells and plasma B cells, which produce anti-HBs antibodies.Citation22 During this whole process of the humoral immune response, many factors may lead to a low response to the hepatitis B vaccine, including inadequate antigen-specific activationCitation23 and excessive suppression mediated by regulatory T cellsCitation24 or IL-10.Citation25
In the present study, C57BL/10J (B10, H-2b) and B10.S-H2s/SgMcdJ (B10.S, H-2s) mice (responder and low responder mice, respectively, as defined by Millich et al.) were used to investigate the possible mechanisms responsible for a low response to the hepatitis B vaccine in mice. After immunization of B10.S mice, we observed that the maturation, co-stimulation and migration activities of APCs were retarded after HBsAg stimulation. Together with the inadequate activation of the HBsAg-specific Th cells by APCs, the low level of anti-HBs observed in B10.S mice is due to the hyporesponse of HBsAg-specific Th and plasma cells.
Results
Reduced anti-HBs response to HBsAg vaccine in B10.S mice
In this study, the anti-HBs responses in B10 and B10.S mice were compared after intramuscular injection of 3 different doses of recombinant HBsAg (0.25, 0.5 or 1 ug/dose) with aluminum as an adjuvant. As determined by ELISA, the anti-HBs IgG level in the B10.S mice serum was significantly lower than that in the B10 mice after both priming and boosting (P < 0.01), as shown in and B. The B10.S mice showed an inferior anti-HBs IgG response compared with the B10 mine as early as 14 d after priming (). These results were confirmed by electrochemiluminescence immunoassay (ECLIA, Abbott) (Fig. S1). However, there were no significant differences in the antibody responses to 3 other antigens (HA monovalent influenza vaccine, tetanus toxoid (TT) and OVA) between the B10 and B10.S mice (P = 0.878, P = 0.101, P = 0.435) ().
Figure 1. Reduced antibody responses to HBsAg in B10.S mice. Adult female B10 and B10.S mice were immunized with 0.25, 0.50 or 1.0 µg of HBsAg together with aluminum adjuvant in 0.2 ml of normal saline. Blood samples were collected 4 weeks after vaccination, and (A) the total anti-HBs IgG levels were determined by ELISA. The mice were boosted with 0.25, 0.50 or 1.0 µg of HBsAg 4 weeks after the first vaccination. Blood samples were collected 2 weeks after boosting, and (B) the total anti-HBs IgG levels were determined by ELISA. B10 and B10.S mice were immunized with 2.0 µg of HBsAg, and blood samples were collected on day 0 (pre-immunization) and on days 7, 14, 21, and 28 after immunization. (C) The total anti-HBs IgG levels were determined by ELISA (**P< 0.01).
Figure 2. Normal antibody responses to influenza and tetanus vaccines and OVA in B10.S mice. Adult female B10 and B10.S mice were immunized with HA monovalent influenza vaccines (0.15 ug/dose), tetanus toxoid (2 µg/dose) or OVA (2 µg/dose) with aluminum adjuvant in 0.2 ml of normal saline. Blood samples were collected 4 weeks after immunization, and the level of antigen-specific antibodies (IgG) was determined by ELISA. The data shown are representative of 3 separate experiments.
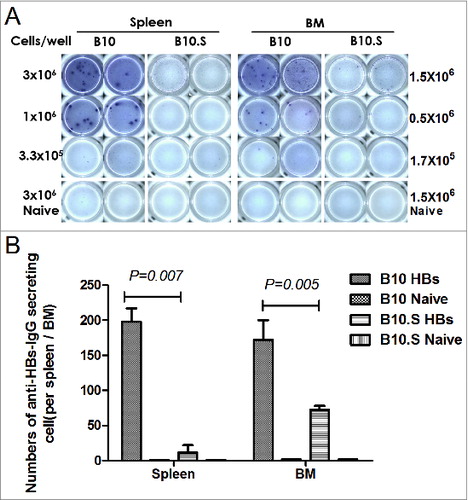
Furthermore, the HBsAg-specific IgG-secreting plasma cells in the spleens and BMs of immunized B10 and B10.S mice were determined by ELISPOT assays. Fourteen days after the last vaccination, the numbers of HBsAg-specific IgG-secreting cells (ASCs) in the spleens and BMs of B10.S mice were 11.53 ± 8.24 and 72.65 ± 10.28, respectively, whereas those in B10 mice were 197.67 ± 33.56 and 172.01 ± 48.50, respectively (spleens, P = 0.007; BMs, P = 0.005) ().
Figure 3. Impaired HBsAg-specific plasma cell response in B10.S mice. (A) Two weeks after boosting with HBsAg (2 µg/dose), splenocytes and bone marrow cells from B10 and B10.S mice were isolated. The number of HBsAg-specific IgG-secreting plasma cells was determined using B cell ELISPOT kits from MabTech. (B) The spots were counted using an ImmunoSpot analyzer, verified by counting with the naked eye and analyzed by ANOVA using the SPSS software. The data shown are representative of 3 separate experiments.
Impaired activation of HBsAg-specific Th cells in B10.S mice
We then observed the HBsAg-specific CD4+ and CD8+ T cell responses in B10 and B10.S mice. Two weeks after boosting with HBsAg, the splenic cells from HBsAg-immunized B10 and B10.S mice were stimulated with HBsAg (20 µg/ml) for 24 h, stained with anti-CD4 FITC and then intracellularly stained with anti-IL-2 APC, anti-IL-4 PE, anti- IFN-γ PE, anti- TNF-α PerCPCy5.5 or anti-IL-17 PE. The number of CD4+ IL-2+ (P = 0.004), CD4+ IL-4+ (P < 0.001), CD4+ IFN-γ+ (P < 0.001), CD4+ TNF-α+ (P = 0.019) or CD4+ IL-17+ (P = 0.032) T cells in B10.S mice was significantly lower than that observed in B10 mice (). The levels of IL-4, IFN-γ, IL-12, TNF-α and IL-6 in the supernatants of splenocytes from HBsAg immunized B10.S mice were significantly lower than those obtained in the cells from B10 mice. However, no differences in IL-10 production were found between the 2 mouse strains (). Altogether, the findings demonstrated the hyporesponse of HBsAg-specific Th cells in B10.S mice, which may influence the production of anti-HBs in B cells. However, there were no significant differences (P = 0.182) in the CD8+ IFN-γ+ T cell response between B10 and B10.S mice (Fig. S2).
Figure 4. Impaired activation of HBsAg-specific CD4+ T cells in B10.S mice. Two weeks after boosting with HBsAg (2 µg/dose), the splenocytes of B10 and B10.S mice were isolated and treated with HBsAg (20 µg/ml). The cells were subjected to surface staining of CD4 combined with intracellular staining of IL-2 (A), IL-4 (B), IFN-γ (C), TNF-α (D) or IL-17(E). The percentages of cytokine-secreting CD4+ cells are shown, and the data are representative of 3 separate experiments.
Figure 5. Impaired cytokine production in B10.S splenic cells. Two weeks after boosting with HBsAg (2 µg/dose), the splenocytes of B10 and B10.S mice were isolated and treated with HBsAg (20 µg/ml) for 24 h. The culture supernatants were collected, and the levels of IL-4 (A), IFN-γ (B), IL-10 (C), IL-12 (D), TNF-α (E) and IL-6 (F) were detected using specific ELISA kits. The data shown are representative of 3 separate experiments.
Reduced expression of CD40, CD86 and CCR7 in B10.S LNDCs
We reasoned that the capability of APCs, particularly dendritic cells (DCs), in B10.S mice may influence the hyporesponse of HBsAg-specific Th cells because the maturation and migration capacities of DCs can influence the subsequent signaling to the adaptive immune system. To investigate this possibility, the draining inguinal lymph nodes of B10 and B10.S mice were isolated 3 d post-HBsAg immunization. Non-immunized mice served as negative controls. The surface expression of the maturation-related molecules CD80 and CD86, the co-stimulatory molecule CD40 and the migration-related molecules CCR7 on the DCs of draining lymph nodes (LNDCs) were analyzed by flow cytometry. The results revealed that the expression (mean fluorescence intensity, MIF) of CD40, CD86 and CCR7 on the LNDCs of B10.S mice is lower than that obtained in the LNDCs of B10 mice (P < 0.01) (), suggesting that the maturation, co-stimulation and migration activities of DCs in B10.S mice are retarded after HBsAg stimulation.
Figure 6. Reduced expression of surface markers on DC from B10.S mice after immunization with HBsAg. Three days after immunization with HBsAg (2 µg/dose), the draining inguinal lymph nodes from B10 and B10.S mice were removed, and single-cell suspensions were prepared. The cells were harvested, subjected to surface staining of CD11c, CD40, CD80, CD86 and CCR7 and analyzed by flow cytometry. The column graphs show the geometric mean fluorescence intensities of the surface markers as the means ± SD for each group of cells. LNDCs from unimmunized mice were used as controls.
APCs from B10.S mice have impaired capacity to stimulate HBsAg-specific CD4+ T cell proliferation
To further investigate the activation of HBsAg-specific CD4+ T cells by APCs from B10 or B10.S mice, F1 hybrid mice were produced by crossing the 2 mouse strains. Because H-2 antigens are expressed in a co-dominant fashion, the APCs from B10 and B10.S mice are both able to present antigens to the T cells of the (C57BL/10 × B10.S-H2s/SgMcdJ) F1 mice. The BMDCs of B10, B10.S and F1 mice were co-cultured with CFSE-labeled CD4+ T cells from F1 mice for 5 d in the presence of HBsAg (10 µg/ml), and the T cell proliferation was then determined by flow cytometry. Cells stimulated with anti-CD3ζ and anti-CD28 antibodies were used as a positive control. BMDCs from B10 mice showed a higher capacity (11.30%) to stimulate HBsAg-specific CD4+ T cell proliferation compared with BMDCs from B10.S mice (7.83%), whereas the proliferation index of the F1 BMDC culture was 9.48%. Moreover, the IL-2 production in the co-culture of B10.S BMDC with F1 CD4+ T cells was significantly lower than those obtained in the other 2 co-cultures (). Taken together, these results indicate that the APCs from B10.S mice are retarded in activating HBsAg-specific CD4+ T cell proliferation. We further examined the humoral immune response in (C57BL/10 × B10.S-H2s/SgMcdJ) F1 mice. The level of anti-HBs IgGs in F1 mice reached the level observed in B10 mice, which was much higher than that found in B10.S mice (P = 0.014) (Fig. S3).
Figure 7. APCs from B10.S mice have impaired capacity to stimulate HBsAg-specific CD4+ T cell proliferation. (A) Ten days after boosting with HBsAg (2 µg/dose), CD4+ T cells from spleens of F1 mice (hybrid of C57BL/10 and B10.S-H2s/SgMcdJ mice) were negatively selected and labeled with CFSE. BMDCs from B10, B10.S or F1 mice were induced and co-cultured with CFSE-labeled CD4+ T cells at a ratio of 1:5 in 100 µl of medium containing HBsAg (10 µg/ml) or anti-CD3/CD28. After five days of culture, the cells and supernatants were collected. The cells were stained with PE-conjugated anti-CD4 mAb and analyzed by flow cytometry. (B) The murine IL-2 levels in the culture supernatants were measured by ELISA.
Discussion
Goncalves et al. found that PBMCs from normal responders to the hepatitis B vaccine are able to proliferate after HBsAg stimulation, whereas those of low/ non-responders are not, suggesting a defect in the HBsAg-specific T cell function in low/non-responders.Citation26 In the present study, we found the number of HBsAg-specific CD4+ IL-2+ (P = 0.004), CD4+ IL-4+ (P < 0.001), CD4+ IFN-γ+ (P < 0.001), CD4+ TNF-α+ (P = 0.019) and CD4+ IL-17+ (P = 0.032) T cells in the spleens of B10.S mice was much lower than that found in B10 mice, moreover, the BMDCs from B10.S mice are retarded in activating HBsAg-specific CD4+ T cell proliferation, which are consistent with the observation in human PBMCs. However, there were no significant differences in the frequency of HBsAg-specific IFN-γ-secreting CD8+ T cells between B10 and B10.S mice.
Because MHCII may influence the development of the adaptive immune response to HBsAg, in addition to antigen-specific Th cell activation and differentiation and B cell activation, the inferior process through which APCs activate Th cells has not been ruled out.Citation27 Ho-Yuan Chou et al. found that GM-CSF is able to enhance the HBsAg-presentation activity of APCs and favor the generation of Th cell responses, subsequently helping B cells produce anti-HBs in non-responders,Citation23 which suggests that a defect in or loss of APC function may lead to low responsiveness to the hepatitis B vaccine. In this study, we found reduced expression of the maturation-related molecules CD86, the co-stimulatory molecule CD40 and the migration-related molecules CCR7 on LNDCs of HBsAg-immunized B10.S mice compared with that observed in the LNDCs of B10 mice. Since there were significant baseline differences in activation markers of naive DC between B10 and B10.S mice, we examined the activation status of LNDCs after tetanus toxin vaccination and found there were no significant differences in CD40, or CD86 expression between B10 and B10.S mice (data not shown). It suggests that the low response to HBsAg in B10.S mice is not due to the baseline differences in the activation markers on naive DC. To further exclude the influence of insufficient activation of CD4+ T cells on DC activation, naive BMDCs from B10 or B10.S mice were stimulated with HBsAg in vitro, which gave the same results as LNDCs experiments (data not shown).
MHC-II molecules are co-dominantly expressed on the surface of APCs.Citation28 Thus, APCs of F1 hybrid mice derive from 2 different inbred strains possess MHC-II molecules from both parents. To determine whether there are differences in HBsAg presentation between B10 and B10.S mice, F1 hybrid mice were produced by crossing the 2 inbred strains. First, we found that the anti-HBs level in F1 mice was not different from that found in B10 mice but significantly higher than that observed in B10.S mice, which implies that these mice presented a restored anti-HBs response. This finding indicates that the MHC-II molecules derived from B10 mice play an important role in the anti-HBs response in F1 mice, which prompts us to investigate the structures of MHCII molecules and their interaction with HBsAg antigenic peptides.
We have predicted the HBsAg Th epitopes for B10 and B10.S mice using Rankpep online software, which is one of the few software covering murine H-2s haplotype. There were 2 HBsAg Th epitopes capable of binding to I-A molecules of B10 or B10.S mice. The OPT% (percentile score of the sequence that yields the optimal score) of H-2s-restricted epitopes were significantly lower than that of H-2b-restricted epitopes. It has been reported that a 15-mer peptide that mimicked the “a” determinant of HBsAg could generate specific B- and T-cell responses in BALB/c mice.Citation29 We found that one H-2b–restricted HBsAg Th epitopes lies in the “a” determinant of HBsAg, while both of the 2 H-2s –restricted Th epitopes lies out of the “a” determinant (Fig. S4). However, prediction of the OVA and HA Th epitopes for B10 and B10.S mice revealed that the number of H-2s–restricted OVA and HA Th epitopes were significantly lower (OVA: 1; HA: 3) than that of H-2b–restricted Th epitopes (OVA: 6; HA: 11). Meanwhile, the OPT% of H-2s-restricted epitopes were significantly lower than that of H-2b-restricted epitopes (data not shown). It implies that the different responses to distinct antigens in B10.S mice cannot simply be explained by H-2s-restricted Th epitopes predicted by Rankpep software.
We further predicted the Th epitopes of Large S (hepatitis B virus large surface protein, adw) for B10 and B10.S mice. There were at least 6 Large S Th epitopes binding to I-A molecules of B10 (11) or B10.S (6) mice (Fig. S5). It suggests that the addition of PreS1 and PreS2 proteins may significantly increase the antigenicity of Hepatitis B vaccine, which has been confirmed by a study of the efficacy of a third generation PreS/S vaccine in non- and low-responders.Citation30
In summary, in B10.S mice immunized with HBsAg vaccine, the maturation, co-stimulation and migration activities of APCs were significantly lower than that of APCs from B10 mice, which results in an inferior activation of HBsAg-specific Th cells. This inferior activation in combination with the low number of antigen-specific plasma cells resulted in low levels of antibody production. However, further studies are necessary to clarify the specific role of MHCII molecules in APC activation and in the immune response to hepatitis B vaccination for overcoming the low/non-responsiveness to the hepatitis B vaccine.
Materials and Methods
Mice
C57BL/10J (B10, H-2b) and B10.S-H2s/SgMcdJ (B10.S, H-2s) mice were obtained from Jackson Laboratory and maintained in a pathogen-free animal housing facility. Females of different inbred strains (aged 6–8 weeks) were used. All of the animal procedures were approved by the Institutional Animal Care and Use Committee (IACUC) of Shanghai Medical College of Fudan University.
Antigens and immunizations
The vaccine qualified recombinant hepatitis B surface antigen (HBsAg, subtype adw) from Saccharomyces cerevisiae and aluminum hydroxide adjuvant were kindly provided by the National Vaccine and Serum Institute, Beijing, China. The formulation of the HBsAg injections contained 0.25, 0.5, 1.0, or 2.0 μg of HBsAg and 0.1 mg of aluminum hydroxide adjuvant, respectively, in a volume of 200 μl per dose. The monovalent HA (0.15 µg/dose), tetanus toxin (2 µg/dose), or OVA (2 µg/dose) with 0.1 mg of aluminum hydroxide adjuvant were used as control immunogens. The formulated vaccines were injected intramuscularly and boosted 4 weeks after priming. The mice were bled from the angular vein at 4 weeks post-priming and 2 weeks post-boosting. The serum was collected and stored at −80°C until antibody detection. The immunization and bleeding of the animals were carried out under appropriate anesthesia with halothane.
Preparation of lymphocytes from the tissues
The mice were sacrificed after CO2 asphyxiation, and the spleens were isolated and meshed through stainless steel screens to obtain single-cell suspensions. The cells were lysed with lysis buffer (0.15 M NH4Cl, 0.01 M KHCO3, and 0.1 mM Na2 EDTA, pH 7.4) to eliminate red cells, washed and re-suspended in RPMI 1640 medium containing 10% FBS, 100 mg/L streptomycin and 105 U/L penicillin. To isolate the bone marrow cells, the tibias and femurs were dissected from the mice, both ends of the bones were cut, and the marrow was flushed out with 5 ml of ice-cold RPMI-1640 medium containing 10% FBS. The red blood cells were lysed with lysis buffer, washed and re-suspended in RPMI 1640 medium. Three days after immunization, the draining inguinal lymph nodes were removed from the mice, meshed through a cell strainer and re-suspended in RPMI 1640 medium.
Antibody detection by ECLIA and ELISA
The serum antibodies were measured by enzyme-linked immunosorbent assay (ELISA) and electrochemiluminescence immunoassay (ECLIA). For the ELISA assay, 96-well plates were coated overnight at room temperature with 100 µl of 1 µg/ml HBsAg, monovalent HA, tetanus toxin or OVA by physical adsorption, respectively. After washing 5 times with PBST (with 0.05% Tween 20) and blocking with ELISA diluent (PBST with 10% FBS) at 37°C for 1 h, the plates were incubated with 3-fold serial dilutions of mouse serum in ELISA diluent at 37°C for 1 h. Then, horseradish peroxidase-conjugated goat anti-mouse IgG antibodies at a dilution of 1:2000 were added, and the plates were incubated at 37°C for 1 h. After washing, 100 µl of tetramethylbenzidine (TMB) substrate (Sigma-Aldrich, cat.no.T0440) was added to each well, the plates were incubated at room temperature for 10 min, and the reaction was stopped by the addition of sulfuric acid solution (2N H2SO4). The ELISA plates were read at 450 nm using 630 nm at a reference. The titers were determined as the highest dilution of serum with an OD value of 0.20. ECLIA was performed using an Abbott Architect i2000 analyzer (Abbott Diagnostics).
Ab-secreting B cell ELISPOT assays
B cell ELISPOT kits were ordered from MabTech (cat.no. 3825–2A). The plates were pretreated with 50 µl of 70% ethanol per well, washed 3 times in sterile PBS, coated with 15 ug/well HBsAg in sterile PBS, and incubated overnight at 4°C. The plates were then washed 5 times with sterile PBS and blocked with 200 µl of RPMI 1640 medium with 10% FBS at RT for 30 min. Splenocytes or BM cells at 3-fold serial dilutions (starting with 3×10⁶ cells/well) were added to the wells in duplicate, and the plates were incubated at 37°C for 24 h in a humidified atmosphere containing 5% CO2. The cells were then removed, and the plates were washed 5 times with PBS. Anti-IgG-biotin (100 ng/well) in 0.5% FBS-PBS was added to the plates, and the plates were incubated at RT for 2 h. After washing with PBS, 100 µl of streptavidin-ALP in 0.5% FBS-PBS (1:1000) was added to the wells, and the plates were incubated at RT for 1 h. Spots were developed by the addition of 100 µl of BCIP (5-bromo-4-chloro-3-indolyl phosphate)/NBT-plus substrate, and the plates were then washed extensively with water and air dried until distinct spots emerged. The spots were counted using the AID iSpot system and verified by counting with the naked eye.
Intracellular staining of splenic cells
Single-cells suspension from B10 and B10.S spleens were prepared 14 d after boosting and incubated with 20 µg/ml HBsAg or the cell stimulation cocktail (500X, eBioscience, cat.no.00–4970–93) for 24 h. Monensin (GolgiPlug™, BD Biosciences, cat.no.554724) was added at a concentration of 1 µl/ml for the last 4–6 h of culture. After surface staining of CD4 or CD8 at 4°C for 30 min, the cells were fixed and permeabilized using IC Fixation (eBioscience, cat.no.00–8222–49) and Permeabilization Buffer (eBioscience, cat.no.00–8333–56) before the addition of Abs against IL-2 (eBioscience, cat.no.17–7021–82), IL-4 (eBioscience, cat.no.12–7041), IFN-γ (eBioscience, cat.no.12–7311), TNF-α(Biolend, cat.no.506321) and IL-17 (Biolend, cat.no.506904). Appropriate isotype controls were used for all staining experiments. Flow cytometry analyses were performed using the FACSCalibur system (BD Biosciences) and the FlowJo 7.6.1 software (Tree Star).
Quantification of cytokines by ELISA
The cytokine levels in the supernatants of HBsAg-stimulated splenic cells or CD4+ T cells plus BMDC cultures were quantified using mouse IL-4, IFN-γ and IL-2 Ready-SET-Go! ELISA kits (eBioscience) and mouse IL-6, IL-10, IL-12, TNF-α ELISA MAX™ Deluxe Sets (Biolegend), following the manufacturer's instructions. In brief, the concentrations of IL-4, IL-2 or IFN-γ were detected using a 96-well ELISA plate pre-coated with anti-IL-4, anti-IL-2 or anti-IFN-γ, respectively. For IL-6, IL-10, IL-12 and TNF-α detection, 100 µl of anti-IL-6, anti-IL-10, anti-IL-12 or anti-TNF-α in coating buffer (1:200), respectively, was added to the wells, and the plates were incubated overnight at 4°C.
Bone marrow DC culture
The concentration of the prepared bone marrow cells was adjusted to 1 × 10⁶ cells/ml in RPMI 1640 medium/10% FBS, and the cells were then plated in 150-mm dishes and treated with GM-CSF (20 ng/ml, R&D, cat.no.404-ML-010) and IL-4 (10 ng/ml, R&D, cat.no.404-ML-010). Three days post-isolation, an equal volume of culture medium with 20 ng/ml GM-CSF and 10 ng/ml IL-4 was added to the dishes. Five days post-isolation, the medium was removed, the cells were gently washed with RPMI-1640, and 10 ml of fresh medium containing 20 ng/ml GM-CSF and 10 ng/ml IL-4 was added. At day 7 post-isolation, the resulting loosely adherent BMDCs were collected and prepared into a single-cell suspension.
Analysis of surface marker expression
Freshly isolated inguinal lymph nodes cells were plated in a round-bottom 96-well plate and re-suspended in ice-cold FACS buffer (PBS including 2% FBS, 2 mM EDTA, and 0.01% sodium azide). The cells were then stained with APC anti-mouse CD11c (cloneN418, eBioscience, cat.no.17–0114) mAb together with FITC anti-mouse CD40 (clone HM40–3, Biolegend, cat.no.102906), FITC anti-mouse CD80 (clone 16–10A1, Biolegend cat.no.104706), PE anti-mouse CD86 (clone GL-1, Biolegend, cat.no.105007) or PE anti-mouse CCR7 (clone 4B12, Biolegend, cat.no.120105) mAb (1:200 dilution) and incubated at 4°C for 30 min. Isotype control mAbs were purchased from Biolegend. After incubation, the cells were washed twice with FACS buffer and analyzed using a BD LSRFortessa instrument (BD Biosciences).
T cell proliferation assay
Ten days after boosting, the CD4+ T cells from the spleens of F1 mice (hybrid of C57BL/10 and B10.S-H2s/SgMcdJ mice) were negatively selected using a CD4+ T Cell Isolation Kit II for mouse (Miltenyi Biotech GmbH, cat.no.130–095–248), and CD4+ T cells with up to 95% purity were obtained. The cell suspension was adjusted to 1×10⁷/ml, mixed with an equal volume of CFSE (1 µM, eBioscience, cat.no. 65–0850–84) in PBS and incubated for 10 min at 37°C in the dark. An equal volume of FBS was added to stop the reaction, and this step was followed by 2 washes with RPMI 1640 medium. The BMDCs from B10 or B10.S mice and CFSE-labeled CD4+ T cells were then seeded at a ratio of 1:5 in round-bottom 96-well plates with 100 µl of medium containing HBsAg (10 µg/ml) or anti-CD3/CD28. After five days of culture, the cells and supernatants were collected. The cells were stained with PE-conjugated anti-CD4 mAb (eBioscience, cat.no.12–0042) for 30 min at 4°C. After washing, the cells were acquired on a FACSCalibur instrument (BD Biosciences). The IL-2 levels in the supernatants were measured by ELISA.
Statistical analysis
The data shown are representative of 3 independent experiments and presented as the mean ± SD. Differences between groups were analyzed by an ANOVA and means of groups were compared by a t-test using SPSS statistical software (version 16.0) (SPSS Inc.). P < 0.05 was considered statistically significant.
Disclosure of Potential Conflicts of Interest
No potential conflicts of interest were disclosed.
Supplemental Material
Supplemental data for this article can be accessed on the publisher's website..
Supplementary_Figures_1048408.zip
Download Zip (812.7 KB)Acknowledgments
We thank Chaofan Li and Chenliang Zhou for technical advice; and Xiuhua Peng for animal care.
Funding
We thank the National Science and Technology Major Project of China (2012ZX10002002; 2012ZX10003008–010; http://www.nmp.gov.), the Program of Ministry of Science and Technology of China (2010DFA32100; http://www.most.gov.cn) for funding.
References
- Elgouhari HM, Abu-Rajab TT, Carey WD. Hepatitis B virus infection: understanding its epidemiology, course, and diagnosis. Cleve Clin J Med 2008; 75:881-9; PMID:19088007; http://dx.doi.org/10.3949/ccjm.75a.07019
- Busch K, Thimme R. Natural history of chronic hepatitis B virus infection. Med Microbiol Immunol 2014; 2014-1225; PMID:25540037
- Mahoney FJ. Update on diagnosis, management, and prevention of hepatitis B virus infection. Clin Microbiol Rev 1999; 12:351-66; PMID:10194463
- Han K, Shao X, Zheng H, Wu C, Zhu J, Zheng X, Zhang Y. Revaccination of non- and low- responders after a standard three dose hepatitis B vaccine schedule. Hum Vaccin Immunother 2012; 8:1845-9; PMID:22906933; http://dx.doi.org/10.4161/hv.21818
- Jack AD, Hall AJ, Maine N, Mendy M, Whittle HC. What level of hepatitis B antibody is protective? J Infect Dis 1999; 179:489-92; PMID:9878036; http://dx.doi.org/10.1086/314578
- Hadler SC, Francis DP, Maynard JE, Thompson SE, Judson FN, Echenberg DF, Ostrow DG, O'Malley PM, Penley KA, Altman NL. Long-term immunogenicity and efficacy of hepatitis B vaccine in homosexual men. N Engl J Med 1986; 315:209-14; PMID:2941687; http://dx.doi.org/10.1056/NEJM198607243150401
- Yan K, Cai W, Cao F, Sun H, Chen S, Xu R, Wei X, Shi X, Yan W. Genetic effects have a dominant role on poor responses to infant vaccination to hepatitis B virus. J Hum Genet 2013; 58:293-7; PMID:23486340; http://dx.doi.org/10.1038/jhg.2013.18
- Duan Z, Chen X, Liang Z, Zeng Y, Zhu F, Long L, McCrae MA, Zhuang H, Shen T, Lu F. Genetic polymorphisms of CXCR5 and CXCL13 are associated with non-responsiveness to the hepatitis B vaccine. Vaccine 2014; 32:5316-22; PMID:25077417; http://dx.doi.org/10.1016/j.vaccine.2014.07.064
- Yucesoy B, Talzhanov Y, Johnson VJ, Wilson NW, Biagini RE, Wang W, Frye B, Weissman DN, Germolec DR, Luster MI, et al. Genetic variants within the MHC region are associated with immune responsiveness to childhood vaccinations. Vaccine 2013; 31:5381-91; PMID:24075919; http://dx.doi.org/10.1016/j.vaccine.2013.09.026
- Li ZK, Nie JJ, Li J, Zhuang H. The effect of HLA on immunological response to hepatitis B vaccine in healthy people: a meta-analysis. Vaccine 2013; 31:4355-61; PMID:23887040; http://dx.doi.org/10.1016/j.vaccine.2013.06.108
- Grzegorzewska AE, Pajzderski D, Sowinska A, Mostowska A, Jagodzinski PP. IL4R and IL13 polymorphic variants and development of antibodies to surface antigen of hepatitis B virus in hemodialysis patients in response to HBV vaccination or infection. Vaccine 2013; 31:1766-70; PMID:23462527; http://dx.doi.org/10.1016/j.vaccine.2013.02.023
- Wang Y, Xu P, Zhu D, Zhang S, Bi Y, Hu Y, Zhou YH. Association of polymorphisms of cytokine and TLR-2 genes with long-term immunity to hepatitis B in children vaccinated early in life. Vaccine 2012; 30:5708-13; PMID:22824342; http://dx.doi.org/10.1016/j.vaccine.2012.07.010
- Png E, Thalamuthu A, Ong RT, Snippe H, Boland GJ, Seielstad M. A genome-wide association study of hepatitis B vaccine response in an Indonesian population reveals multiple independent risk variants in the HLA region. Hum Mol Genet 2011; 20:3893-8; PMID:21764829; http://dx.doi.org/10.1093/hmg/ddr302
- Godkin A, Davenport M, Hill AV. Molecular analysis of HLA class II associations with hepatitis B virus clearance and vaccine nonresponsiveness. Hepatology 2005; 41:1383-90; PMID:15915462; http://dx.doi.org/10.1002/hep.20716
- Allcock RJ, Martin AM, Price P. The mouse as a model for the effects of MHC genes on human disease. Immunol Today 2000; 21:328-32; PMID:10871872; http://dx.doi.org/10.1016/S0167-5699(00)01654-6
- Wrightsman RA, Krassner SM, Watson JD, Manning JE. Role of the H-2s haplotype in survival of mice after infection with Trypanosoma cruzi. Infect Immun 1984; 44:351-4; PMID:6425221
- Carson S, Trowsdale J. Molecular organization of the class II genes of the human and mouse major histocompatibility complexes. Oxf Surv Eukaryot Genes 1986; 3:63-94; PMID:2855304
- Milich DR, Chisari FV. Genetic regulation of the immune response to hepatitis B surface antigen (HBsAg). I. H-2 restriction of the murine humoral immune response to the a and d determinants of HBsAg. J Immunol 1982; 129:320-5; PMID:6177755
- Milich DR, Leroux-Roels GG, Chisari FV. Genetic regulation of the immune response to hepatitis B surface antigen (HBsAg). II. Qualitative characteristics of the humoral immune response to the a, d, and y determinants of HBsAg. J Immunol 1983; 130:1395-400; PMID:6185581
- von Delwig A, Ramachandra L, Harding CV, Robinson JH. Localization of peptide/MHC class II complexes in macrophages following antigen processing of viable Streptococcus pyogenes. Eur J Immunol 2003; 33:2353-60; PMID:12938211; http://dx.doi.org/10.1002/eji.200323559
- Zhu J, Yamane H, Paul WE. Differentiation of effector CD4 T cell populations (*). Annu Rev Immunol 2010; 28:445-89; PMID:20192806; http://dx.doi.org/10.1146/annurev-immunol-030409-101212
- Xu W, Banchereau J. The antigen presenting cells instruct plasma cell differentiation. Front Immunol 2014; 4:504; PMID:24432021; http://dx.doi.org/10.3389/fimmu.2013.00504
- Chou HY, Lin XZ, Pan WY, Wu PY, Chang CM, Lin TY, Shen HH, Tao MH. Hydrogel-delivered GM-CSF overcomes nonresponsiveness to hepatitis B vaccine through the recruitment and activation of dendritic cells. J Immunol 2010; 185:5468-75; PMID:20889541; http://dx.doi.org/10.4049/jimmunol.1001875
- Xu L, Yin W, Sun R, Wei H, Tian Z. Liver type I regulatory T cells suppress germinal center formation in HBV-tolerant mice. Proc Natl Acad Sci U S A 2013; 110:16993-8; PMID:24089450; http://dx.doi.org/10.1073/pnas.1306437110
- Yang Z, Wang L, Niu W, Wu Y, Zhang J, Meng G. Increased CD4+CD25+FoxP3+ regulatory T cells in the blood of nonresponders after standard hepatitis B surface antigen vaccine immunization. Clin Immunol 2008; 127:265-6; PMID:18304878; http://dx.doi.org/10.1016/j.clim.2007.11.010
- Goncalves L, Albarran B, Salmen S, Borges L, Fields H, Montes H, Soyano A, Diaz Y, Berrueta L. The nonresponse to hepatitis B vaccination is associated with impaired lymphocyte activation. Virology 2004; 326:20-8; PMID:15262491; http://dx.doi.org/10.1016/j.virol.2004.04.042
- Akbar SM, Onji M, Inaba K, Yamamura K, Ohta Y. Low responsiveness of hepatitis B virus-transgenic mice in antibody response to T-cell-dependent antigen: defect in antigen-presenting activity of dendritic cells. Immunology 1993; 78:468-75; PMID:8478028
- Ayala GM, Gonzalez YB, Lopez FA, Guani GE. The major histocompatibility complex in transplantation. J Transplant 2012; 2012:842141; PMID:22778908
- Pride MW, Shi H, Anchin JM, Linthicum DS, LoVerde PT, Thakur A, Thanavala Y. Molecular mimicry of hepatitis B surface antigen by an anti-idiotype-derived synthetic peptide. Proc Natl Acad Sci U S A 1992; 89:11900-4; PMID:1361231; http://dx.doi.org/10.1073/pnas.89.24.11900
- Krawczyk A, Ludwig C, Jochum C, Fiedler M, Heinemann FM, Shouval D, Roggendorf M, Roggendorf H, Lindemann M. Induction of a robust T- and B-cell immune response in non- and low-responders to conventional vaccination against hepatitis B by using a third generation PreS/S vaccine. Vaccine 2014; 32:5077-82; PMID:24975813; http://dx.doi.org/10.1016/j.vaccine.2014.06.076