
ABSTRACT
Older adults are at great risk of developing serious complications from seasonal influenza. We explore vaccination coverage estimates in the Medicare population through the use of administrative claims data and describe a tool designed to help shape outreach efforts and inform strategies to help raise influenza vaccination rates. This interactive mapping tool uses claims data to compare vaccination levels between geographic (i.e., state, county, zip code) and demographic (i.e., race, age) groups at different points in a season. Trends can also be compared across seasons. Utilization of this tool can assist key actors interested in prevention – medical groups, health plans, hospitals, and state and local public health authorities – in supporting strategies for reaching pools of unvaccinated beneficiaries where general national population estimates of coverage are less informative. Implementing evidence-based tools can be used to address persistent racial and ethnic disparities and prevent a substantial number of influenza cases and hospitalizations.
Introduction
Every year, seasonal influenza has a dramatic impact on mortality and morbidity, particularly in older adults who are disproportionately impacted by influenza and its complications.Citation1-5 This population is more likely to have prolonged hospital days, be admitted to intensive care units, and have more influenza-related deaths and hospitalizations than any other age group.Citation6-9 While older adults comprise only 15% of the U.S. population, in the 2015–2016 influenza season, 50% of influenza-associated hospitalizations and 64% of pneumonia and influenza deaths were in this cohort.Citation5
Vaccination is an important tool to prevent influenza infection. Increased access to vaccination services through expanded locations like pharmacy venues, as well as more vaccine options such as high-dose and adjuvanted vaccines hold promise for improving the health and well-being of this population. Vaccination coverage in adults age 65 years and older can be improved, particularly among minority populations.Citation10-11 Insurance coverage for this population is through the federal health insurance program Medicare which provides coverage for over 55 million Americans, including virtually all people age 65 years or older and younger adults with permanent disabilities or end-stage renal disease. Most of the beneficiary population is enrolled in fee-for-service (FFS) coverage, which includes inpatient hospital services (Part A) and preventive services like the seasonal influenza vaccination (Part B) at no cost to the beneficiary.
In this paper we describe the use of administrative claims data to obtain timely vaccination status of the Medicare FFS population. We utilize these data to estimate vaccination coverage among the Medicare population and to populate a geographic mapping tool that visualizes vaccination coverage among different geographic units (e.g., zip codes) in near-real time, approximately one week after vaccination occurs. The tool – supported by the Centers for Medicare and Medicaid Services (CMS) and the National Vaccine Program Office (NVPO) – is available online (https://www.hhs.gov/nvpo/about/resources/interactive-mapping-tool-tracking-flu-vaccinations/index.html).Citation12 It was developed to identify geographic areas with low influenza coverage to help public health partners implement targeted evidence-based interventions and increase vaccination coverage in this high risk population.
Results
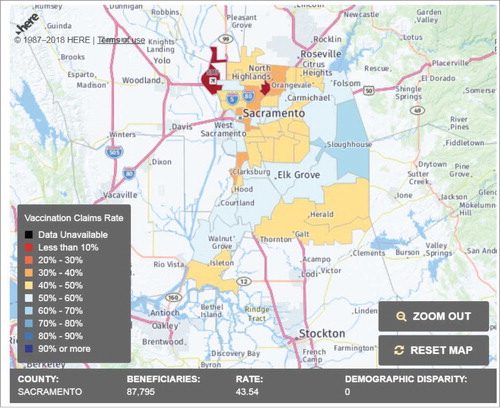
According to Medicare FFS administrative claims data, influenza vaccination coverage estimates have hovered around 50% for the last decade (). summarizes influenza vaccination coverage estimates from the 2006–2007 through to the 2015–2016 influenza seasons, with the majority of claims observed between October and March. demonstrates how this seasonal trend is presented on the mapping tool's Trend Map, as vaccinations begin in earnest in September and start to plateau by the end of the calendar year. The trend map summarizes the cumulative growth in national coverage during the 2015–2016 influenza season, illustrating higher coverage among white beneficiaries than black beneficiaries. In each of the last four influenza seasons, coverage increased modestly from 47% in 2006–2007 to 50% (). Coverage can be improved particularly among men, blacks and Hispanic beneficiaries, and those living in rural areas or who are dually-enrolled in Medicare and Medicaid. presents an example of the heat map, which demonstrates a wide range in vaccine coverage estimates across zip codes in Sacramento County, CA during the 2015–2016 influenza season.
Table 1. Annual influenza vaccination coverage estimates in medicare FFS, by demographic and geographic characteristics, 2006–2016.
Figure 1. Screenshot of the national flumap vaccination coverage estimates by week. This screen shot enables users to display vaccination rates in accordance to selected color-coded attributes to yield trends, a visual display of near-real time national vaccination coverage rates for influenza vaccination by selected race, 2015–2016. Source: https://www.hhs.gov/nvpo/about/resources/interactive-mapping-tool-flu-vaccination-claims-by-week/index.html?language = en.
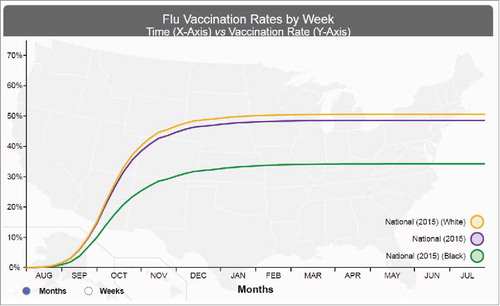
Figure 2. Screenshot of the flumap dashboards. This screen shot enables users to display vaccination rates in accordance to selected color-coded attributes to yield the flumap, a visual display of near-real time vaccination coverage estimates for influenza vaccination by county and zip code, 2015–2016 (Sacramento, California). Source: https://www.hhs.gov/nvpo/about/resources/interactive-mapping-tool-tracking-flu-vaccinations/index.html.
Discussion
This tool can be important to informing state and local partners about underutilization and access to care concerns in their respective regions. The publically available web-based data can be utilized by public health officials who track population-level coverage at the state and local levels; or researchers who may be evaluating pilot behavioral interventions to increase vaccination outcomes in specific zip codes; and the general public who may wish to track vaccination coverage estimates in their community in older adults. Those interested in obtaining the raw data can do so through the HHS Flu Vaccination Application Programming Interface (https://fluvaccineapi.hhs.gov/). Moreover, this tool provides an opportunity for two potential uses: 1) to identify groups covered by Medicare FFS with low vaccination coverage estimates that can be targeted with specific campaigns and interventions and 2) to assess the impact of said interventions by monitoring vaccination rates before and after implementation.
The tool may be able to enhance conventional strategies (e.g. reminder recalls) for boosting vaccination rates that have been stagnant for nearly a decade. Data from this tool can be used in conjunction with tools that have the highest interventional capacity such as electronic health data records or health alert systems to target beneficiaries, and may provide enhanced opportunities to raise coverage rates.Citation15 The granular data provided by this tool can be useful to tailor approaches to specific pockets and populations of need. For example, this tool can be used to tailor mail and telephone reminders to zip codes with low vaccination coverage or establish new venues for vaccination in close proximity to large pockets of unvaccinated beneficiaries.
We recognize the limitations of these data. Our vaccine coverage estimates are based on FFS claims submitted to CMS and do not reflect vaccinations received by Medicare beneficiaries for which reimbursement is not filed by the provider (e.g., beneficiaries who are working and receive their vaccinations through their employer worksite wellness program and do not file a claim with Medicare). Therefore, the estimates provided here may be an underestimation of true vaccination coverage. Furthermore, only claims for FFS Medicare beneficiaries are included. As of 2017, these beneficiaries represented 70% of all Medicare beneficiaries. While these data may not be generalizable to the broader population, it represents a significant proportion of older adults. Future research can include an evaluation of the utility of the tool by various users. For example, state level vaccination rates are used for different purposes (e.g. vaccine tracking versus interventions) than zip-code level rates. Additionally, usability testing of the map itself (e.g. choice of color-coding schemes) may also be useful in improving this practical application of administrative data to support a public health problem.
Methods
In this paper we estimate influenza vaccination coverage among Medicare FFS beneficiaries from the 2006–07 through 2015–16 influenza seasons (). We also describe a data visualization tool that disseminates vaccination estimates (and the raw data used to calculate them) to the public ( and ).
Data variables
Vaccination variable: Each influenza vaccine season spans August through July of the next year, and vaccination coverage estimates are calculated weekly. Each weekly denominator consists of Medicare beneficiaries continuously-enrolled in Part A (hospital insurance) and Part B (medical insurance) from the start of the season in order to minimize unobserved vaccinations. Each week, Part B Medicare claims are queried for these patients and vaccinations are identified using Common Procedure Terminology (CPT) codes recorded on those claims; there is a distinct CPT code for each vaccine formulation payable by Medicare. These claims data are subject to a delay of one to two weeks, meaning that a patient in the denominator may not be considered vaccinated for up to two weeks after the vaccination took place. Once a patient is considered vaccinated, they remain vaccinated for the rest of the season; vaccination status is reset at the start of the subsequent season.
Demographic and zip code variables: Demographic (race and age) and geographic (zip code, county, state) characteristics are assigned to each patient using the Medicare Enrollment Database and are used to stratify coverage estimates in our analytic file () and web tools ( and ).
Interactive web-based visualization tool
The NVPO accumulates the results described above and generates two interactive web-based visualization tools to disseminate this information to the public. One is a heat map that presents vaccination coverage estimates in the current flu season for demographic and geographic patient groupsCitation13; the other is a trend chart that displays the cumulative growth of vaccination rates over time, across years and again between different patient groups.Citation14 Demographic stratifications include age and race, whereas geographic stratifications include state, county, and zip code. When viewing estimates by race, a disparity metric is calculated; similar to a rate ratio, this represents the difference between the estimates among beneficiaries in a particular racial group compared to white beneficiaries of the same age. Negative values mean the coverage estimate is lower than for the comparable white group, positive values mean the rate is higher.
Conclusion
The risk of influenza complications is highest for the Medicare population so protecting this group of older adults, is critically important. Different communities and health systems may wish to tackle the problem of low influenza vaccination coverage in various ways. We provide this tool as a means to support strategies aimed particularly at populations that are not getting vaccinated (i.e. areas of lowest vaccination rates).
Looking forward, additional data inputs to this tool could be helpful to informing strategies to raise influenza coverage rates and may be considered as additional fields in the future. Potential enhancements to this tool such as allowing stratification by gender and dual eligibility with Medicaid could also be useful to increasing outreach and targeted interventions. Reaching all beneficiaries with key health reminders frequently and in convenient locations for vaccination would be ideal. However, with limited resources, health systems and providers must make decisions on where to target efforts. This tool was designed to support strategies to increase recommended vaccinations in this beneficiary population. Concerted effort to ensure all beneficiaries receive a vaccine recommendation and offer from their provider is important.Citation16 At a time when the number of access points to vaccination have increased, particularly with pharmacy venues, the environment is ripe to take advantage of opportunities to raise influenza vaccination rates.Disclaimer
This study was performed as a joint effort of the Centers for Medicare & Medicaid Services and the National Vaccine Program Office. The opinions expressed in this manuscript are those of the authors and not intended to represent the opinions of the National Vaccine Program Office or the Centers for Medicare & Medicaid Services.
Disclaimer
This study was performed as a joint effort of the Centers for Medicare & Medicaid Services and the National Vaccine Program Office. The opinions expressed in this manuscript are those of the authors and not intended to represent the opinions of the National Vaccine Program Office or the Centers for Medicare & Medicaid Services.
Disclosure of potential conflicts of interest
No potential conflicts of interest were disclosed.
References
- Thompson WW, Shay DK, Weintraub E, Brammer L, Bridges CB, Cox NJ, Fukuda K. Influenza-associated hospitalizations in the United States. JAMA 2004;292:1333–40. doi:10.1001/jama.292.11.1333. PMID:15367555.
- Thompson WW, Shay DK, Weintraub E, Brammer L, Cox N, Anderson LJ, Fukuda K. Mortality associated with influenza and respiratory syncytial virus in the United States. JAMA 2003;289:179–86. doi:10.1001/jama.289.2.179. PMID:12517228.
- Zhou H, Thompson WW, Viboud CG, Ringholz CM, Cheng PY, Steiner C, Abedi GR, Anderson LJ, Brammer L, Shay DK. Hospitalizations associated with influenza and respiratory syncytial virus in the United States, 1993–2008. Clin Infect Dis 2012;54:1427–36. doi:10.1093/cid/cis211. PMID:22495079.
- Foppa IM, Cheng P, Reynolds SB, Shay DK, Carias C, Bresee JS, Kim IK, Gambhir M, Fry AM. Deaths averted by influenza vaccination in the U.S. during the seasons 2005/06 through 2013/14. Vaccine 2015;33(26):3003–9. doi:10.1016/j.vaccine.2015.02.042. PMID:25812842.
- Rolfes MA, Foppa IM, Garg S, Flannery B, Brammer L, Singleton JA, Burns E, Jernigan D, Reed C, Olsen SJ, et al. Estimated Influenza Illnesses, Medical Visits, Hospitalizations, and Deaths Averted by Vaccination in the United States. 2016 Dec 9 [January 4, 2018]; https://www.cdc.gov/flu/about/disease/2015-16.htm.
- Bonmarin I, Belchior E, Bergounioux J, Brun-Buisson C, Mégarbane B, Chappert JL, Hubert B, Le Strat Y, Lévy-Bruhl D. Intensive care unit surveillance of influenza infection in France: the 2009/10 pandemic and the three subsequent seasons. Euro Surveill 2015;20. doi:10.2807/1560-7917.ES.2015.20.46.30066. PMID:26607262.
- Thompson WW, Shay DK, Weintraub E, Brammer L, Bridges CB, Cox NJ, Fukuda K. Influenza-associated hospitalizations in the United States. JAMA 2004;292:1333–40. doi:10.1001/jama.292.11.1333. PMID:15367555.
- Thompson WW, Shay DK, Weintraub E, Brammer L, Cox N, Anderson LJ, Fukuda K. Mortality associated with influenza and respiratory syncytial virus in the United States. JAMA 2003;289:179–86. doi:10.1001/jama.289.2.179. PMID:12517228.
- Zhou H, Thompson WW, Viboud CG, Ringholz CM, Cheng PY, Steiner C, Abedi GR, Anderson LJ, Brammer L, Shay DK. Hospitalizations associated with influenza and respiratory syncytial virus in the United States, 1993–2008. Clin Infect Dis 2012;54:1427–36. doi:10.1093/cid/cis211. PMID:22495079.
- Harris, KM, Maurer J, Uscher-Pines L, Kellermann AL, Lurie, N. Seasonal Flu Vaccination: Why Don't More Americans Get It?. Santa Monica, CA: RAND Corporation, 2011. https://www.rand.org/pubs/research_briefs/RB9572.html.
- Williams WW, Lu Peng-Ju, O'Halloran A, Kim DK, Grohskopf LA, Pilishvili T, Skoff TH, Nelson NP, Harpaz R, Markowitz LE, et al. Surveillance of Vaccination Coverage Among Adult Populations — United States, 2015. MMWR Surveill Summ. 2017;66(No.SS-11):1–32. https://www.cdc.gov/mmwr/volumes/66/ss/pdfs/ss6611.pdf Published 2017. Accessed May 17, 2017. doi:10.15585/mmwr.ss6611a1. PMID:28472027.
- National Vaccine Program Office. Interactive Mapping Tool: Live-Tracking Flu Vaccinations of Medicare Beneficiaries; 2017 Dec 28 [accessed January 4, 2018]. https://www.hhs.gov/nvpo/about/resources/interactive-mapping-tool-tracking-flu-vaccinations/index.html?language=en.
- Interactive Mapping Tool: Live-Tracking Flu Vaccinations of Medicare Beneficiaries; 2017 Dec 28 [accessed January 4, 2018]. https://www.hhs.gov/nvpo/about/resources/interactive-mapping-tool-tracking-flu-vaccinations/index.html.
- Interactive Mapping Tool: Flu Vaccinations Claims' Rates by week; 2017 Dec 28 [accessed January 4, 2018]. https://www.hhs.gov/nvpo/about/resources/interactive-mapping-tool-flu-vaccination-claims-by-week/index.html.
- Centers for Medicare & Medicaid Services. Physician Group Practice Demonstration; 2017 December 12 [accessed January 4, 2018]. https://innovation.cms.gov/initiatives/Physician-Group-Practice-Transition/.
- National Vaccine Advisory Committee. Recommendations from the National Vaccine Advisory Committee: Standards for Adult Immunization Practice. NVAC Standards. Public Health Rep 2014;129(2):115–23. doi:10.1177/003335491412900203. PMID:24587544.