
ABSTRACT
HIV sequence diversity and the propensity of eliciting immunodominant responses targeting inessential variable regions are hurdles in the development of an effective AIDS vaccine. We developed a DNA vaccine comprising conserved elements (CE) of SIV p27Gag and HIV-1 Env and found that priming vaccination with CE DNA is critical to efficiently overcome the dominance imposed by Gag and Env variable regions. Here, we show that DNA vaccinated macaques receiving the CE prime/CE+full-length DNA co-delivery booster vaccine regimens developed broad, potent and durable cytotoxic T cell responses targeting conserved protein segments of SIV Gag and HIV Env. Gag CE-specific T cells showed robust anamnestic responses upon infection with SIVmac239 which led to the identification of CE-specific cytotoxic lymphocytes able to recognize epitopes covering distinct CE on the surface of SIV infected cells in vivo. Though not controlling infection overall, we found an inverse correlation between Gag CE-specific CD8+ T cell responses and peak viremia. The T cell responses induced by the HIV Env CE immunogen were recalled in some animals upon SIV infection, leading to the identification of two cross-reactive epitopes between HIV and SIV Env based in sequence homology. These data demonstrate that a vaccine combining Gag and Env CE DNA subverted the normal immunodominance patterns, eliciting immune responses that included subdominant, highly conserved epitopes. These vaccine regimens augment cytotoxic T cell responses to highly conserved epitopes in the viral proteome and maximize response breadth. The vaccine-induced CE-specific T cells were expanded upon SIV infection, indicating that the predicted CE epitopes incorporated in the DNA vaccine are processed and exposed by infected cells in their natural context within the viral proteome.
Introduction
HIV sequence diversity, resulting from a high reverse transcripase mutation rate and genomic plasticity, and the propensity of dominant immune responses to target variable regions of the HIV proteome, with little impact on the fitness of the virus population, are hurdles in the development of an effective AIDS vaccine. Many approaches have been proposed and evaluated to address the problem of viral diversity and to maximize the breadth of recognition and induction of protective T cell responses by vaccine immunogens. These include strategies that use consensus, center-of-tree or ancestral sequences, multiple strains, mosaic immunogens, immunogens consisting of known epitopes, and chimeric molecules expressing a selection of the most conserved epitopes from different clades of HIV,Citation1–Citation25 often with the goal of preventing common immunological escape pathways for HIV/SIV during the natural course of infection. In addition, the presence of variable epitopes in immunogens encompassing the native proteins can result in immunodominance (i.e., hierarchical recognition of some epitopes in the vaccine over others) with the generation of immunodominant T cell responses targeting non-protective epitopes that do not contribute significantly to viral control and can easily mutate without impairing viral fitness, and facilitating the propagation of functionally fit escape mutants. HLA represents a major force driving the evolution and diversification of HIV-1 within individuals and at the population levelCitation26–Citation28 with recognition of immunodominant but non-protective epitopes. It has been suggested that variable sequences can serve as immunodominant “decoys” that can absorb immune reactivity, driving the emergence of escape mutations and potentially precluding responses against conserved protective epitopes.Citation29–Citation35 The mechanisms of this preclusion, also referred to as immunodomination,Citation36 are varied.Citation37,Citation38 Virus-specific T cells are responsible for controlling viremia in humans and macaques. During primary infection in humans the reduction of the original viral burst is associated with the emergence of HIV-specific cytotoxic CD8+ T lymphocytes (CTL).Citation19,Citation33,Citation34,Citation39–Citation53 Their role in controlling viremia was confirmed by systemic CD8 depletion in SIV/SHIV infected macaques, which resulted in a rapid increase in viremia,Citation54–Citation57 demonstrating a CD8-dependent immunological mechanisms of viral control.Citation58–Citation67 Failure to contain viral replication in macaques correlated with the emergence of viral mutants that escaped from CTL immune surveillance.Citation68,Citation69 In humans, CD8+ T cells targeting Gag are inversely associated with virus load,Citation70 including in long-term non-progressors,Citation71 and Gag T cell breadth has been associated with reduced plasma viremia.Citation72
Our strategy to design interventions capable of inducing protective cellular responses has been the generation of DNA vaccines encoding immunogens that focus the immune response to conserved elements (CE) of HIV p24GagCitation1,Citation2,Citation8,Citation9,Citation19 resulting in the development of p24CE DNA vaccine.Citation20,Citation21,Citation73 Seven CE, spanning 12 to 24 AA in length, were selected based on their stringent conservation across all known HIV sequences, broad HLA-coverage, and association with HIV control.Citation19,Citation53,Citation74,Citation75 By positional analogy and sequence homology to the HIV p24CE, an SIV p27Gag (p27CE) derived molecule was generated.Citation76 Using a similar approach based on sequence conservation, association with virologic control, and CTL escape resulting in a loss in viral fitness, we generated HIV Env CE moleculesCitation77 comprising 12 highly conserved regions of Env, spanning 11 to 43 AA in length. In proof-of-concept studies in miceCitation20 and outbred macaques,Citation21,Citation73,Citation76 we demonstrated that immunization with HIV p24CE DNA and SIV p27CE elicited robust cellular and humoral immune responses against CE and that HIV Env CE DNA vaccine regimen induced robust T cell responses yet low antibody responses in macaques,Citation77 whereas induction of CE-specific responses was poor with DNA vaccines expressing only full-length (FL) Gag and Env.Citation21,Citation76,Citation77 Importantly, however, priming with CE DNA and boosting with CE+FL gag or env DNA is a vaccine regimen that maximizes the magnitude of both cellularCitation21,Citation76,Citation77 and humoralCitation73,Citation77 immune responses in macaques. This vaccine strategy provides a novel approach to shift the immunodominance hierarchy and to induce robust immune responses to subdominant epitopes.Citation21
In this report, using the rhesus macaque model, we evaluated the immunogenicity and efficacy of a vaccine regimen that included the homologous SIV Gag CE DNA vaccine and the heterologous HIV Env CE DNA vaccine.
Results
CE DNA Vaccine regimens
We previously reported the generation of two DNA vaccines targeting the highly conserved sequences in HIV GagCitation20,Citation21,Citation73 (and its homolog SIV p27CE)Citation76 and in HIV Env (Env CE)Citation77 (A) and demonstrated induction of robust CE-specific T cell responses in cohorts of vaccinated macaques. The CE selection included analysis of MHC binding prediction to address immunogenicity in humans, and we found that epitopes from all MHC class I known supertypes were represented in Gag CE. As reported previously,Citation19 in a group of 50 people, >30 epitopes were recognized using >40 HLA alleles. No similar laboratory studies have been performed for Env, but in silico analysis indicated that the Env CE together represent a predicted 141 MHC Class I and 760 MHC Class II epitopes with an IC50 value < 50 nmol (www.iedb.org).
Figure 1. Vaccine and immunization scheme.
(A) The SIV p27CE DNA vaccine is a mixture of two plasmids expressing p27CE1 and p27CE2 proteins derived from the SIV capsid p27Gag. Each of two p27CE proteins comprises 7 conserved elements CE that are 12–24 AA in length, differ by 6 AA (indicated by *) and are collinearly arranged, separated via 2–4 AA linkers.Citation76 The HIV Env CE DNA vaccine is a mixture of two plasmids expressing the Env CE1 and Env CE2 proteins. Each of two Env CE proteins comprises 12 CE distributed through gp120 and gp41, spanning 11–43 AA in length, differing by 24 AA (indicated by *), are collinearly arranged and separated via 3 AA linkers.Citation77 (B) Schematic representation of the study schedule. Indian rhesus macaques received 5 vaccinations at the time points indicated by grey arrows. The animals were distributed into four experimental groups; two group received 3 CE DNA priming vaccination followed by 2 CE+FL DNA co-immunization booster vaccinations delivered by IM/EP and ID/EP, respectively; the 3rd group received 5 FL SIV gag and FL HIV env DNA vaccinations delivered by IM/EP, and the control group received sham DNA delivered by either IM/EP or ID/EP. Throughout the study, the SIV DNA vaccine was administered in the left inner thigh and HIV DNA vaccine was administered in the right inner thigh. After a 3-month rest, the macaques were subjected to 6 repeated low-dose rectal challenges with SIVmac239 (indicated by black arrows). At the indicated time points (white arrows), blood samples were collected for the analysis of vaccine-induced immune responses.
Here, we compared the immunogenicity and efficacy of SIV Gag and HIV Env CE-specific T cell responses induced in macaques upon CE DNA priming followed by CE+full-length (FL) DNA booster vaccination, to FL DNA only vaccines, as outlined in B. The HIV vaccine was included in this study to evaluate its immunogenicity and to interrogate possible interference of the two types of CE DNA vaccine regimens, since we and others previously reported potent inhibition of Gag T cell responses by FL Env vaccines.Citation78–Citation81 The 31 Indian rhesus macaques enrolled in this study are described in . Two groups of animals received the same CE DNA vaccine but differed in the delivery routes (B), intramuscular (IM) followed by electroporation (EP) using CELLECTRA® 5P (CE IM group) versus intradermal (ID) followed by EP using CELLECTRA®3P (CE ID group).Citation82,Citation83 These animals received 3 CE DNA priming vaccinations followed by 2 CE+FL DNA booster vaccinations. A third group of animals received five vaccinations of SIV FL gag and HIV FL env DNA via IM/EP (FL IM group). The SIV DNA and HIV DNA vaccines were administered in the left and right inner thighs, respectively. As control, 8 macaques received sham DNA (empty vector) together with IL-12 DNA by EP either via IM (N = 4) or ID (N = 4) routes. Beginning three months after the last vaccination, the animals were subjected to up to 6 weekly low-dose intrarectal exposures to SIVmac239.
Table 1. Animals used in this study.
Induction of robust CE-specific cellular immune responses recognizing SIV Gag and HIV Env in macaques
CE-specific T cell responses were monitored in blood at 2 weeks after the 3rd prime (week 18) and 2nd booster (week 34) vaccinations (B). After priming, the IM delivered vaccine induced robust Gag CE-specific (A, top left panel) and Env CE-specific (C, top left panel) T cell responses in all animals, as we previously reported,Citation76,Citation77 reaching up to 1.2% of circulating total Gag and Env CE T lymphocytes in macaque T152. The ID delivered vaccine induced much lower CE-specific T cell responses and were detected in only 5 of the 8 animals (A and C, top middle panels). Two weeks following the co-delivery of CE+FL gag DNA and CE+FL env DNA booster vaccinations (week 34), the magnitude of CE responses substantially increased in both CE groups and responses were detected in all animals, except T132, which only showed Gag responses (A and C, lower left and middle panels, respectively). The Gag and Env CE-specific responses in the IM group significantly increased upon the CE+FL DNA booster vaccination for both Gag (p = 0.0234; paired T test), corroborating our previous report,Citation76 as well as for Env (p = 0.0078; paired T test). The IM group developed higher responses, up to 4% (Gag CE) and 2% (Env CE), whereas in the ID group maximal levels were significantly (∼10 fold) lower (p = 0.0351 for Gag, B; and p = 0.0035 for Env, D; Holms-Sidak multiple comparison test, ANOVA). Thus, IM/EP delivery was more efficient in inducing T cell responses in blood.
Figure 2. Vaccine-induced CE-specific cellular immune responses.
(A, C) The frequency of CE-specific IFN-γ+ CD4+ (open bars) and CD8+ (black bars) T cell responses for SIV Gag (A) and HIV Env (C) measured at week 18 (2 weeks after the 3rd priming vaccination) and at week 34 (2 weeks after the 2nd booster vaccination) are shown. (B, D) Comparison of the magnitude of (B) SIV Gag CE- and (D) HIV Env CE-specific IFN-γ+ T cells responses in three vaccine groups (week 34). P values from ANOVA Holms-Sidak multiple comparison tests are shown. (E, F) Contour plots showing the cytotoxic phenotype (GrzB+ CD107a+) of the (E) SIV Gag CE-specific CD4+ (red dots) and CD8+ (blue dots) T cells and (F) HIV Env CE-specific CD4+ (red) and CD8+ T cells (blue) after the CE+FL DNA boost (week 34) of two representative animals each from the CE IM (left panels) and CE ID (right panels).
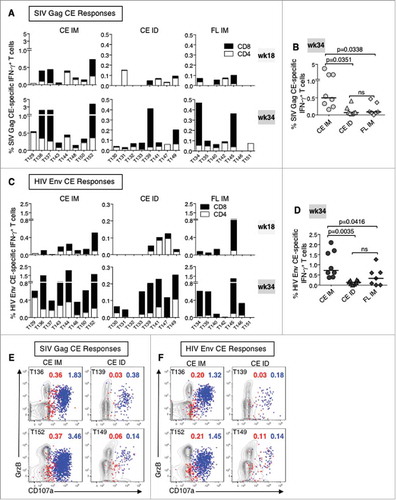
Vaccination with FL DNA Gag and Env immunogens induced generally low levels of CE-specific responses and in only half of the animals, especially against Gag (A and C, top right panels; note scale differences for Gag CE in CE IM group) as expected,Citation76,Citation77 although the response rate and magnitudes also increased with additional vaccinations (week 34; A and C, lower right panels). CE T cell responses induced by the FL DNA were similar to the CE ID group but substantially lower than in the CE IM group (Gag p = 0.034; Env p = 0.042; Holms-Sidak multiple comparison test, ANOVA) (B and D).
The cytotoxic potential of the CE-specific T cells in the CE IM and ID groups was analyzed using PBMC collected after the last booster vaccination (week 34) by monitoring their granzyme B (GrzB) content and their ability to degranulate (express CD107a) upon stimulation by CE peptides. The functional responses from two representative animals from each vaccine group are depicted after stimulation with Gag CE (E) and Env CE peptides (F). The contour plots show the CE-specific CD4+ (in red) and CD8+ (in blue) T cells expressing GrzB and actively degranulating (CD107a+). Thus, both IM, as reported,Citation76,Citation77 and ID delivery of the CE DNA vaccine regimen induced potent CE-specific cytotoxic (GrzB+ CD107a+) IFN-γ+ T cells in blood.
To determine the breadth of the responses against different CE, PBMC were stimulated after the last booster vaccination (week 34) with peptide pools spanning individual CE, and the number of SIV Gag CE () and HIV Env CE () recognized by each animal were determined. Only 2 to 3 animals from the CE ID and FL IM group had CE responses high enough to allow mapping of the individual CE. The data from 10 of the 16 macaques which received the Gag CE/CE+FL DNA (8 IM and 2 ID groups) and 3 macaques (T134, T135 and T145) from the FL IM group are shown in . The SIV Gag CE/CE+FL gag DNA co-delivery booster regimen induced responses to 6 of the 7 CE with a median response breadth of 3.5 CE/animal (range 2–6 CE). CE3, CE5 and CE6 were the most frequently CE recognized, in agreement to our previous report.Citation76 The analysis of the 3 animals from the FL gag group is shown together with data from another 14 previously reported animals which received FL gag DNA vaccine,Citation76 showing a median response against 1 CE/animal (range 1–3), with CE5 being most commonly recognized.
Table 2. Mapping of responses to individual CE upon SIV Gag CE DNA prime-boost or SIV FL gag DNA vaccination.
Table 3. Mapping of responses to individual CE upon HIV Env CE DNA prime-boost or FL env DNA vaccination.
Env CE mapping was performed in 9 of the 16 macaques which received the CE/CE+FL DNA (8 IM and 1 ID groups) and 2 macaques (T134, T135) from the FL IM group (). The HIV Env CE/CE+FL env DNA co-delivery booster regimen induced responses targeting 8 of the 12 CE, with CE14 and CE16 being most frequently recognized (), with a median response breadth of 3 CE/animal (range 2–5 CE). The analysis of the 2 animals from the FL env group is shown together with data from another 5 previously reported animals which received FL env DNA vaccineCitation77 and shows a median of 1 CE/animal (range 1–3 CE), with CE5 being most commonly recognized. Taken together, these data corroborate our previous findingsCitation76,Citation77 and show that CE DNA priming followed by CE+FL DNA co-delivery booster vaccination (IM) induced higher and significantly broader epitope recognition for both SIV Gag and HIV-1 Env (Gag CE p < 0.001; Env CE p = 0.006; Mann Whitney nonparametric t test) than achieved by DNA vaccination with FL expressing DNA alone.
Vaccine-induced CE-specific T cells disseminate to mucosal sites
Rectal biopsies from all the animals (except no biopsy sample was available from T139 from the CE ID group) in the three vaccine groups were analyzed for CE-specific IFN-γ responses at 2 weeks after the last immunization (week 34). Data from a representative animal from each group are shown as contour plots in A and a summary of all positive animals (5 of 8 from CE IM group, 2 of 7 of CE ID group; 5 of 7 from the FL IM group) are shown in B. CE-specific IFN-γ responses in mucosal samples were measured after short-term (6 hrs; vs 12 hrs for PBMC) stimulation with Gag CE peptide pools or medium alone and the results show that these antigen-specific T cells were predominantly CD8+ T cells. Nonetheless, these data show that both IM (CE and FL vaccine groups) and ID delivered DNA vaccine induced CE-specific T cells responses disseminate into mucosal surfaces, an important feature of a vaccine against HIV.
Figure 3. Dissemination of CE-specific T cell responses into rectal mucosa.
(A) Contour plots showing the IFN-γ production from unstimulated and SIV CE peptide stimulated T lymphocytes recovered from rectal biopsies two weeks after the last vaccination (week 34; 2 weeks after the last vaccination) from a representative animal from each of the three vaccine groups. (B) Graph showing the CE-specific T cells in rectal samples from all the animals with measurable positive responses at week 34.
SIV Gag CE-specific T cells recognize SIVmac239-infected cells
After a 3-month rest, the animals were challenged with up to 6 low dose rectal exposures with a SIVmac239 viral stock, grown in macaque T cells, that contained a narrow swarm of virus variants. All animals, except T133 in the ID group, were infected by the 5th exposure and no difference in acquisition rate or peak and chronic viremia was found between animals from different vaccine regimens and controls (A). Two animals in each vaccine group showed lower chronic viremia. These data suggest that the Gag T cell responses induced in these animals via vaccination were nonetheless unable to significantly control viremia. We interrogated whether anamnestic T cell responses were induced upon infection, which would indicate that CE epitopes were exposed on the infected cells and were recognized by the vaccine-induced CE-specific CTL. Gag CE-specific T cell responses were measured at week 42 (2 weeks prior to the 1st exposure) and post-infection. The Gag CE-specific T cell responses were clearly boosted by the infection in several animals ( and , lower panels). Data comparing these responses before and after infection are summarized in D and show a statistically significant increase of CE-specific CD8+ T cells (paired t test, p = 0.008) in the CE IM group (top panel). Of note, some animals in the CE IM group showed very high CE-specific T cell responses (macaques T136, T137 and T152) reaching up to 12% of the circulating T cells, much higher than in the other groups (C, note different scales) where anamnestic responses were only found in macaque T149 (CE ID) and in macaques T134 and T135 (FL IM) (D). The CE-specific CD4+ and CD8+ responses were determined from all individual macaques, including the primary T cell immunity induced by the infection in the control animals. T cell responses targeting Gag CE epitopes were almost exclusively mediated by CD8+ T cells, even in animals that had a significant CE-specific CD4+ T cell subset prior to infection (C).
Figure 4. Viral loads and SIV Gag CE anamnestic responses induced by SIVmac239 infection.
(A) Plasma virus loads in the four experimental groups of macaques after SIVmac239 challenge. (B) Flow plots showing the SIV Gag CE-specific IFN-γ+ T cells two weeks before challenge (week 42 of the study) and at the peak postinfection (P.I.) in selected animals with anamnestic responses. (C) Frequency of SIV Gag CE-specific IFN-γ+ CD4+ (open bar) and CD8+ (black bar) T cells measured before challenge at week 42 and at peak postinfection in all vaccinated and naïve control animals. (D) Changes of SIV Gag CE-specific IFN-γ+ CD8+ T cells upon infection in animals from the CE IM (upper panel), CE ID (middle panel) and FL IM (lower panel) groups at week 42 and at peak postinfection. (E) Graphs showing the mapping of the individual SIV CE-specific T cell responses in a representative animal (macaques T152, T149, T135) from each vaccine group at 2 weeks after the last vaccination (week 34) and at peak postinfection.
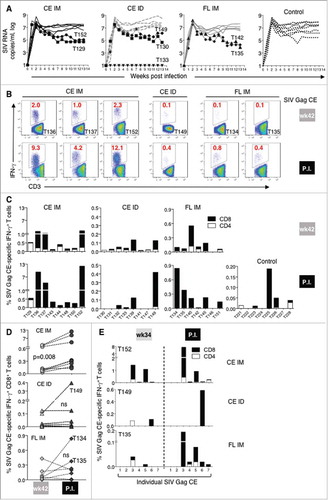
To understand which CE contributed to anamnestic SIV Gag CE-specific responses, individual CE responses before (2 weeks after last booster vaccination, week 34) and after challenge were mapped in one animal from each vaccine group that had anamnestic responses upon infection. Significant increases in the T cell responses were found targeting CE3 (macaques T152 and T135), CE5 (macaque T135) and CE6 (macaque T149) (E). Although we could only analyze a small number of animals, these data clearly demonstrated that distinct CE-specific T cells, such as those targeting CE3, CE5, and CE6, were able to recognize the SIV-infected cells in vivo. Of note, the animals with the highest CE recall responses in each of the CE vaccine groups shown in E also had lower chronic viremia (A), consistent with our previous report that vaccine-induced Gag CE-specific T cells were able to inhibit SIV infection in vitro.Citation76 Taken together, expansion of CE-specific T cells found in infected animals (C-E) demonstrates that vaccine-induced T cell responses target CE epitopes that are indeed processed and exposed upon SIV infection.
Cytotoxic profile of the Gag CE-specific T cells before and after infection
The cytotoxic potential CE-specific T cells following SIV infection was analyzed by monitoring their GrzB content and their ability to degranulate (CD107a+) upon TCR stimulation by specific CE peptides (as shown in E, F). PBMC from all vaccinated animals were analyzed by flow cytometry at week 42 (2 weeks before the 1st SIVmac239 exposure) and after infection. A shows the GrzB content and CD107a surface expression of CE-specific IFN-γ+ CD4+ and CD8+ T lymphocytes before and after SIV infection from macaques T152 and T135, the same animals which were also shown in the mapping analysis in E. CE-specific T cells were mainly CD8+, expressed GrzB and actively degranulated before challenge (A, upper plots), and their frequency significantly increased (up to ∼12% of total T cells for macaque T152) without impairing their cytotoxic capability after infection (A, lower plots). The degranulation profiles (CD107a surface expression) at week 42 and after infection from all macaques in the CE IM and in the FL IM vaccine groups are shown in B. Already high before infection, nearly all the CE-specific IFN-γ+ T cells in blood were CD107a+ after infection, indicating that these CE-specific cytotoxic T cells retained functionality.
Figure 5. SIV Gag CE-specific cytotoxic T cell responses before and after infection.
(A) Contour plots showing the cytotoxic phenotype (GrzB+ CD107a+) of the SIV CE-specific CD4+ (red dots) and CD8+ T cells (blue dots) before and after infection from macaques T152 (CE IM) and T135 (FL IM). (B) Percentage of SIV CE-specific cytotoxic CD107a+ IFN-γ+CD8+ T cells before challenge (wk 42) and at peak P.I. for CE IM (left panel) and FL IM (right panel) vaccine groups. (C, D) Inverse correlations between the fold increase upon infection (from week 42 to peak P.I.) of SIV Gag CE-specific IFN-γ+ total T cells (C) and CD8+ T cells (D) and peak VL. Spearman r and p values are shown.
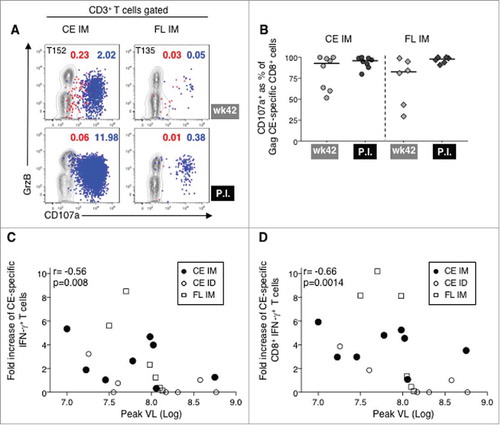
To understand the contribution of the CE-specific T cell responses to control of viremia, we calculated the change of SIV Gag CE-specific T cells from before infection (week 42) to peak post-infection. We found an inverse correlation between the fold increase of the CE-specific total T cells (C; p = 0.008, Spearman) and CE-specific CD8+ T cells (D; p = 0.014) and peak viremia. Thus, the primary viral infection elicited an anamnestic response of the vaccine-induced Gag CE-specific T cells, which are functional in vivo and contribute to restricting viremia.
Analysis of HIV Env CE responses before and after infection
HIV Env CE and FL env DNA were included in this study to evaluate their immunogenicity and monitor putative interference with the Gag CE-induced cellular immune responses. As shown in C, HIV Env CE responses induced upon prime (vaccination week 18) increased after Env CE+FL booster vaccination (week 34). We then compared vaccine induced HIV Env CE T cell responses two weeks before (week 42) and after SIV infection (). Contour plots of representative animals (A) and graphs from all the immunized animals (B) are shown. Distinct from SIV Gag responses, only 2 of 14 of the HIV Env CE-vaccinated animals (IM) showed expansion of 2 fold over the pre-existing HIV Env CE T cell responses upon SIV infection, whereas 3 of 7 HIV FL Env vaccinated macaques (IM) had an increase (B). HIV Env CE responses after SIV infection were again primarily mediated by CD8+ T lymphocytes.
Figure 6. Cellular responses to HIV Env CE upon SIVmac239 infection.
(A) Contour plots showing the frequency of HIV Env CE-specific IFN-γ+ T cells two weeks before challenge (week 42) and at peak postinfection in five animals with anamnestic responses. (B) Graphs showing the frequency of HIV Env CE-specific CD4+ (open bar) and CD8+ (black bar) IFN-γ+ T cell responses from all the vaccinated macaques at week 42 and peak postinfection. (C) Amino acid sequence alignment of HIV Env CE 7 and CE14 and corresponding sequences in SIVmac239 Env shows high degree of identity. Grey shading indicates the toggle AA difference between CE7-1 and CE7-2 (1 AA) and between CE14-1 an CE14-2 (5 AA). (D) Graphs showing the mapping of the individual HIV Env CE-specific T cell responses before and after infection in one representative animal from the CE IM (T144; peak P.I.) and the FL IM (T146; week 8 P.I.) vaccine groups. (E) Contour plots showing the HIV Env CE-specific cytotoxic (GrzB+ CD107a+) CD4+ (red dots) and CD8+ (blue dots) T cells (blue dots) from a representative animal (macaque T143) at week 34 and week 42 (2 and 10 weeks after the last vaccination). (F) Percentage of cytotoxic HIV Env CE-specific cytotoxic CD107a+ IFN-γ+CD8+ T cells at week 34 and week 42 for all the animals in the CE IM (left panel) and FL DNA (right panel) vaccine groups. (G) Graphs showing the frequency of SIV Env-specific CD4+ (open bar) and CD8+ (black bar) IFN-γ+ T cell responses from all the the animals, including the controls, analyzed at peak postinfection.
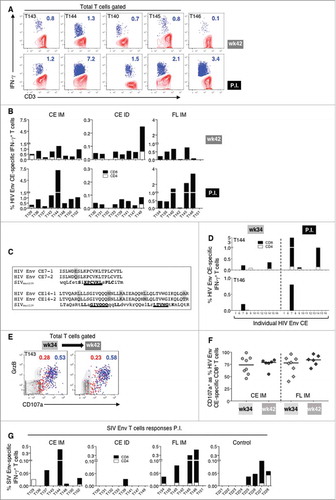
The finding that some immunized macaques expanded the HIV Env CE responses upon SIV infection suggested some crossreactivity of epitopes derived from Env of HIV and SIV. This is not unexpected since multiple amino acids within CE are shared across HIV-1, HIV-2 and SIV (not shown). Alignment of the complete amino acid sequence from the two Env proteins revealed enough homology to accommodate a CD8+ epitope only in the CE7 and CE14 segments (C). Anamnestic responses were mapped in the two macaques with the greatest post infection response (T144 and T146), and indeed the boost was associated with these partially homologous sequences (D). Both CE7 and CE14 were recognized in the CE IM animal and only CE7 in the FL vaccinated animal. These data demonstrate these Env CE specific T cell responses recognize epitopes exposed by SIV-infected cells in vivo. In contrast to cellular responses, no anamnestic humoral responses were found to HIV Env after SIV infection and only primary Ab responses to SIV Env were found by ELISA (Supplemental Fig. 1).
As shown above for the Gag CE T cell responses (A, B), the cytotoxic potential of the HIV Env CE-specific T cells was analyzed by monitoring their granzyme B (GrzB) content and their functional ability to degranulate (CD107a+) upon peptide stimulation (E, F). The PBMC from all vaccinated animals were analyzed by flow cytometry at weeks 34 and 42, before infection. E shows the GrzB content and CD107a surface expression of the HIV Env CE-specific IFN-γ+ CD4+ (red dots) and CD8+ (blue dots) T lymphocytes from a representative animal (macaque T143; CE IM group), indicating preservation of these responses over the 2 months after the last vaccination. The cytotoxic phenotype and degranulation profile from the HIV Env CE-specific T cells from all the animals in the CE IM and the FL IM groups showed that most of the Env CE-specific T cells had functional properties of potent cytotoxic cells and their ability to degranulate was fully preserved, if not increased during these 2 months (F).
Approximately half of the infected control animals developed de novo responses induced by SIV infection (G) reaching a maximum of 0.1% of T cells. Of the 5 macaques [T143 and T144 (CE IM); T140, T145 and T146 (FL IM)] which showed potent recall of the HIV Env CE responses (A), all except T143 also had SIV Env-specific T cells (range 0.1-0.4% of T cells) (G). These responses were found at much lower levels relative to the HIV immunogen, but were higher than in the control animals. This reinforced the notion that few of the macaques with HIV Env CE responses recognized SIV Env epitopes in the infected cells, although those responses were cytotoxic and had killing potential.
Discussion
This study evaluated several factors important to optimizing vaccines in the SIV/macaque model. These factors included differences in DNA vaccines, encoding CE versus FL proteins, delivery by intramuscular (IM) and intradermal (ID) injection followed by electroporation, and between homologous Gag (SIV) and heterologous (HIV) Env vaccines, and protection from SIVmac239 challenge.
In agreement with previous results,Citation20,Citation21,Citation76,Citation77 priming with CE DNA was more efficient at inducing CE-specific T cell responses in the blood than immunization with the FL vaccine, for both Gag and Env. Gag CE-specific responses were also found in rectal mucosa lymphocytes (Env responses were not evaluated in the rectal mucosa due to sample limitations). Animals immunized by ID delivery developed lower levels of CE-specific T cell responses in blood, but not at mucosal sites, than macaques immunized with the same DNA vaccine by the IM route. The finding of differences in the magnitude of circulating CE-specific T cells from animals immunized using two different routes (IM vs ID) is in agreement with our previous data,Citation84,Citation85 although the antigen-specific T cells were long-lasting and cytotoxic in animals immunized by both routes. These differences in magnitude of T cell responses using IM vs ID delivery of the CE DNA are in contrast with the results obtained in a different study using FL gag and env DNA,Citation82 where similar magnitude of T cell responses were observed in macaques immunized by IM or ID DNA delivery. The reason for this discrepancy is currently not understood, but it could be related to differences in the immunogens (CE DNA in this study versus FL DNACitation82) and the animal model used (Indian rhesus macaques in our study versus Chinese rhesus macaques and guinea pigs).
CE-specific T cell responses disseminated to the rectal mucosa in both the IM and ID groups. Of note, CE-specific IFN-γ responses in mucosal samples were measured after short-term (6 hrs) stimulation with Gag CE peptide pools or medium alone and cannot be quantitatively compared to those in blood measured after a 12-hr stimulation. In addition, due to the varied quality and quantity of the biopsy samples, we wish to emphasize the qualitative rather than the quantitative aspect of this analysis. Analysis of mucosal samples would benefit from the more sensitive tetramer-binding assay that typically provides an excellent assessment of mucosally disseminated T cell immunity,Citation86 however, the immunodominant MamuA*01 restricted CM9 epitope is not part of the CE immunogen and hence was not useful for this comparison.
To evaluate the potential interference between Env and Gag epitopes that has been reported previously in mice, macaques and humans,Citation78–Citation81,Citation87 macaques immunized with the SIV Gag CE and FL gag DNA also received the HIV Env CE and FL env DNA vaccine. Importantly, and in contrast to previous observations using only full-length immunogens, we did not find any interference or negative effects from the Env CE DNA immunogen on the cellular responses targeting Gag CE. Of note, in contrast to those previous studies, we used equal amounts of CE and FL gag and env DNAs, and the Gag and Env vaccines were delivered in two distinct anatomical sites (different thighs) in an attempt to reduce or avoid competition for MHC binding of the peptides derived from the two immunogens.
Since our vaccine did not include SIV Env DNA or protein, we did not expect a delay in virus acquisition, nor did we observe a delay. However, we also did not observe a difference in peak or chronic viremia between vaccinated animals and controls, although 2 animals in each group showed lower levels of chronic viremia. Three of the six animals with lower chronic viremia (T152, T149 and T135) showed a significant boost of the SIV gag CE responses suggesting that these responses may contribute to viral control. The other three macaques (T129, T130 and T142) did not increase the CE-specific T cell responses after infection, which suggest that, at least in these animals, these circulating antigen-specific T cells were not responsible for the control of viral replication. Taken together, these data suggest that T cell responses targeting Gag (CE or FL) were suboptimal to efficiently control viral propagation when infection occured in the absence of immune responses targeting other viral proteins. The inability of Gag-specific T cells alone to control virus acquisition has been shown in other studies.Citation88–Citation91 Martins et al.Citation88 reported that vaccine regimens that did not contain Gag, or Env or a combination of both were largely inefficient in reducing viremia, suggesting that the synergy between Gag-specific T cell responses and antibodies targeting Env were an important requirement in the effective control of the virus, an observation also supported by others.Citation92,Citation93 Roederer et al.Citation89 reported that vaccination with mosaic Gag DNA as prime followed by rAd5 as a booster immunization did not protect from infection but showed reduction of viremia. On the other hand, Hansen et al.Citation90,Citation91 reported no protection from virus acquisition but found robust control of viremia in ∼half of the rCMV (SIV Gag) immunized macaques. A fundamental difference between our and the rCMV vaccine is that DNA vaccination induces T cell immunity using canonical MHC molecules, while certain rCMV vectors are able to elicit T cell immunity through the non-canonical MHC-E,Citation94,Citation95 a feature that makes the rCMV vector induced responses unique. In a study designed to mimick elite controllers, Mudd et al.Citation69 reported that vaccination of Mamu B*08+ macaques with recombinant yellow fever 17D (rYF17D)/rAd5 vectors expressing three Mamu B*08 restricted Nef and Vif CD8 epitopes resulted in efficient control of viremia. In two of the RM, loss of control of viral replication correlated with the emergence of escape mutant virus carrying mutations in all three epitopes encoded by the vaccine. These data demonstrated that, in this model, vaccinated macaques can efficiently control SIVmac239 replication with potent CTL even in the absence of Env responses.
Despite lack of consistent reduction in viremia in our CE/CE+gag or gag DNA vaccinated macaques, we found that SIV infection is able to induce anamnestic CE-specific T cell responses, indicating that the CE-spanning T cell epitopes can be processed and displayed together with the appropriate MHC upon SIV infection. This demonstrates that the epitopes included in our DNA vaccines are efficiently processed and exposed also as in the natural context of the viral proteome. Thus, our artificially generated immunogen containing linkers between the CE to optimize proteolytic processing and MHC association of the CE peptides, generates the same peptides as the virus infected cells. We found clear anamnestic responses targeting CE3, CE5 and CE6. These results could underestimate responses targeting the other CE because only few macaques were mapped after infection and compared to peak levels obtained upon vaccination and the not at the ‘day of challenge’ (week 42). Our data demonstrate that infected cells display on their surface the CE epitopes incorporated in our CE DNA vaccine and, importantly, that vaccine-induced CE-specific T cells are able to recognize those infected cells. These findings apply for both the SIV Gag CE and the HIV Env CE DNA vaccines. The homology found among the SIV and HIV Env sequences, and the expansion of specific Env CE-specific cells after infection, identified sequences within CE7 and CE14 of our HIV Env CE immunogen to contain epitopes naturally displayed in SIV-infected cells in vivo. Based on their granzyme B content and their ability to degranulate upon TCR stimulation, the antigen specific T cells induced by both SIV Gag CE and HIV Env CE DNA vaccines are cytotoxic, a functional property found in the CE-specific T cells from animals immunized by both IM and ID delivered DNA. Combining the Gag CE DNA vaccine with matching Env of the infecting virus (DNA and protein) could improve control of viral propagation or, ideally, prevention of viral infection.
Materials and methods
Ethics statement
All animals were cared for and procedures performed under a protocol approved by the Institutional Animal Care and Use Committee of BIOQUAL, Inc. (animal welfare assurance no. A3086-01; protocol number 15-008) and USDA Certificate number 51-R0036. The macaques in this study (NCI study SVEU P185) were managed according to the animal husbandry program, which aims at providing consistent and excellent care to nonhuman primates at the vivarium. This program operates based on the laws, regulations, and guidelines promulgated by the United States Department of Agriculture (e.g., the Animal Welfare Act and its regulations, and the Animal Care Policy Manual), Institute for Laboratory Animal Research (e.g., Guide for the Care and Use of Laboratory Animals, 8th edition), Public Health Service, National Research Council, Centers for Disease Control and Prevention, and the Association for Assessment and Accreditation of Laboratory Animal Care (AAALAC) International. The nutritional plan utilized by BIOQUAL, Inc. consisted of twice daily feeding of Labdiet 5045 High Protein Primate Diet and food intake was closely monitored by animal research technicians. This diet was also supplemented with a variety of fruits and vegetables as part of the environmental enrichment program established by the veterinary staff and enrichment technician. Pairing of animals as part of the environmental enrichment program was managed by the enrichment technician. All primary enclosures and animal rooms were cleaned daily with water and sanitized at least once every two weeks.
Plasmids
All plasmids are derivative of the pCMVkan vector which contains the human CMV promoter and BGH polyadenylation signal in plasmid backbone optimized for growth in bacteria.Citation96 SIV Gag CE DNA is a mixture of p27CE1 (plasmid 262S) and p27CE2 (plasmid 263S).Citation76 HIV Env CE DNA is a mixture of pEnvCE1 (plasmid 329H) and pEnvCE2 (plasmid 331H).Citation77 The SIV gag DNA (termed FL Gag DNA) is a mixture of p57gag (plasmid 206S) and MCP3-p39gag (plasmid 209S) expressing the SIVmac239 p57Gag protein and the processing intermediate p39Gag.Citation96 HIV env DNA (termed FL env DNA) is a mixture of three gp145dID plasmids (332H, 341H and 340H) from clade B strains BaL and 6101, and clade C 1086, respectively, lacking the immunodominant (ID) region in the extracellular gp41.
Vaccination of Rhesus macaques and SIV infection
The macaques (N = 31) used in this study were all males with a median weight of 4.9 kg (range 2.6-10.2). The animals were distributed into three different vaccine groups including Group 1: CE prime/CE+FL boost delivered by intramuscular injection followed by electroporation (IM/EP); Group 2: CE prime/CE+FL boost delivered by intradermal injection followed by electroporation (ID/EP), and Group 3: FL prime/FL boost by IM/EP (FL IM). The range and the median age in the different groups were: CE IM: 3.6-9.9 years (median: 3.9); CE ID: 3.6-5.9 years (median: 3.9); FL IM: 3.8-5.8 years (median: 3.9); control animals: 2.4-2.9 years (median: 2.8). The animals were negative for STLV (PCR/seronegative) and for the MHC class I A*01, B*08 and B*17 alleles, except T142 which is positive for B*08 and T146 which is positive for B*17.
Endotoxin-free DNAs were prepared according to the manufacturer's protocol (Qiagen). The SIV gag and HIV-1 env DNA vaccines were formulated separately and administered in left and right thighs, respectively, throughout the study. The SIV Gag CE priming vaccinations comprised a mixture of 1 mg of each of SIV p27CE1 and p27CE2 DNA. The SIV CE+gag DNA booster vaccination (2 mg) comprised a mixture of 0.5 mg each of SIV p27CE1 DNA, p27CE2 DNA, p57gag DNA, and MCP3-p39gag DNA. The HIV Env CE priming vaccinations comprised a mixture of 1 mg of each of HIV Env CE1 DNA and Env CE2 DNA. The HIV CE+env DNA booster vaccination (2 mg) comprised a mixture of 0.5 mg each of Env CE1 DNA, Env CE2 DNA, 0.4 mg BaL gp145dID, 0.3 mg 6101 gp145dID DNA and 0.3 mg 1086 gp145dID DNA. Vaccination with FL immunogens comprised 2 mg gag DNA (1 mg of each gag plasmid) and 2 mg env DNA (0.7 mg of each env DNA). Each vaccine formulation contained 0.1 mg macaque IL-12 DNA (plasmid AG157Citation97,Citation98) and was formulated in sterile water. The animals in the control group were inoculated either IM (4 macaques) or ID (4 macaques) with sham DNA (empty vector) together with IL-12 DNA. The IM DNA delivery followed by in vivo electroporation (IM/EP) with the CELLECTRA® 5P device (Inovio Pharmaceuticals, Inc.)Citation82,Citation83 was performed with 0.5 ml DNA per side (4 mg/ml DNA). The ID DNA delivery followed by in vivo electroporation (ID/EP) with the CELLECTRA® 3P device (Inovio Pharmaceuticals, Inc.)Citation82,Citation83 was performed with 2 × 0.1 ml DNA per side (8 mg/ml DNA). Vaccinations were performed under anesthesia (Ketamine, 10 mg/kg). No adverse effects associated with these procedures were found.
SIVmac239 virus was generated from transfected HEK293 cells. The SIVmac239 stock was grown in macaque primary lymphocytes and had 3216 TC ID50 when titrated in CEMX174 cells. The animals were subjected to six weekly exposures by the intrarectal route with 1 ml of 1:10 diluted stock, starting 12 weeks (week 44) after the last vaccination (week 32). Blood samples were collected during the vaccination period (day of each vaccination and 2 weeks later), 10 weeks after last (5th) vaccination and 4 and 8 weeks post-infection (peak responses were presented). All animals were euthanized at the end of the study.
Intracellular cytokine staining
Ficoll-hypaque isolated PBMC were cultured in 96-well plates in the presence of various peptide pools from SIV or HIV at a final concentration of 1 μg/ml for each peptide for 12 hrs. Peptide pools covering all SIV/HIV CE or each individual CE (7 Gag CE, 12 Env CE) were prepared combining 15-mer peptides overlapping by 11 AA and 10-mer peptides overlapping by 9 AA (Infinity Biotech Research & Resource, Inc.).Citation76,Citation77 Analysis of SIV Env-specific responses was performed using a pool of 15-mer peptides overlapping by 11 AA covering the full-length protein sequence. Antigen-specific T cells were measured by intracellular cytokine staining followed by polychromatic flow cytometryCitation22,Citation76,Citation77,Citation86 using the following cocktail of cell surface antibodies: CD3-APCCy7 (clone SP34-2), CD4-V500 (clone L200), CD95-FITC (clone DX2) (Cat #557757, 561488, 556640, respectively, BD Pharmingen), CD8-Alexa Fluor-405 (clone 3B5, Cat #MHCD0826, Invitrogen) and CD28-PerCP Cy5.5 (clone CD28.2, Cat #302922, BioLegend). Ten minutes after addition of peptides, the CD107a-eFluor 660 or CD107a-PE antibody (clone eBioH4A3, Cat #50-1079-41, 50-1079-42, respectively, ThermoFisher) was added. After cell permeabilization, intracellular staining was performed using IFN-γ-PE Cy7 (clone B27, Cat #557643, BD Pharmingen), and Granzyme B-PE or Granzyme B-APC antibodies (clone GB12, Cat #MHGB04, MHGB05, respectively, Invitrogen). As negative and positive controls, PBMCs were cultured in medium without peptide stimulation or with a commercial mixture of PMA and calcium ionophore (Cat #00-4970-93, Invitrogen), respectively. Samples were acquired on a LSR II or Fortessa flow cytometer (BD Biosciences), and the data were analyzed using FlowJo software (Tree Star, Inc.). Samples were considered positive if the frequency of IFN-γ+ T cells was 2-fold higher than that of unstimulated medium only control and greater than 0.01 after subtracting the medium control value.
Lymphocyte isolation from rectal biopsies
Rectal biopsies (10-12 pinches) were minced and enzymatically digested in RPMI-1640 medium supplemented with 2X penicillin/streptomycin, gentamycin, 10 units/ml DNase I (Cat #04716728001, Roche) and 200 U/ml collagenase (Cat #C6885,Sigma-Aldrich) at 37°C and 5% CO2 for one hour. After digestion, the supernatants and remaining pieces of tissue were crushed and passed through 100 μm cell strainers, and washed with R10 media. After counting, the cells were seeded (106 cells/well) in 48-well plates in the presence of SIV p27CE or Gag peptide pools, at a final concentration of 2 μg/ml for each peptide, for 6 hrs. A sample without peptide stimulation was used as negative control for each macaque. The samples were incubated for 6 hours prior to staining as described.
Humoral immune response analysis
Plasma samples were heat-inactivated for 30 minutes at 56°C prior to the assay. The endpoint binding titers to SIVmac251 p27Gag, HIVIIIB gp120 Env and SIVmac251 gp120 Env were determined in 4-fold serially diluted plasma samples by standard ELISA (Advanced Bioscience Laboratories, Inc.) measuring optical absorbance at 450 nm.
Viral load measurement
Virus loads were measured from plasma samples using the NASBA assay with a threshold of detection of 50 copies per ml plasma (Advanced Bioscience Laboratories, Inc.).
Statistical analyses
The statistical analyses were carried out with GraphPad Prism version 7.0 for MacOS X (GraphPad Software, Inc.).
Disclosure of potential conflict of interests
The authors declare the follow potential conflict of interests: G.N.P. and B.K.F. are inventors on U.S. Government-owned patents related to DNA vaccines and gene expression optimization; G.N.P. B.K.F. and J.I.M. are inventors on U.S. Government- and Washington University co-owned patents related to CE DNA; K.E.B. and N.Y.S. are full time employees of Inovio Pharmaceuticals and as such receive compensation in the form of salary and stock options. The remaining authors declare no potential competing financial interests.
Supplemental Material
Download MS Power Point (184.9 KB)Acknowledgments
We thank H. Anderson, D. Weiss, J. Treece and staff (Bioqual) and I. Kalisz and R. Pal (Advanced Bioscience Laboratories, Inc.) for excellent support of macaque studies, N. Miller (NIAID) for discussion and support of the study, the members of the Felber and Pavlakis lab for discussion, and T. Jones for administrative support and editorial assistance. The following reagents were obtained through the NIH AIDS Reagent Program, Division of AIDS, NIAID, NIH: SIV Gag Peptide Set (#12364); HIV BaL (#9480) Peptide Set.
Funding
This work was supported in part through the Simian Vaccine Evaluation Unit SVEU P185 (DAIDS, NIAID and by the Intramural Research Program of the National Cancer Institute (G.N.P and B.K.F.), by the National Center for Research Resources and the Office of Research Infrastructure Programs (ORIP) of the NIH through a grant OD011104 at the Tulane National Primate Research Center (P.A.M.); and by Public Health Services grant (5PO1 AI057005, J.I.M.) and the Molecular Profiles and Computational Biology Core of the Seattle Centers for AIDS Research (P30 AI027757, J.I.M.).
Related Research Data
References
- Nickle DC, Rolland M, Jensen MA, Pond SL, Deng W, Seligman M, et al. Coping with viral diversity in HIV vaccine design. PLoS Comput Biol. 2007;3:e75. doi:10.1371/journal.pcbi.0030075.
- Nickle DC, Jojic N, Heckerman D, Jojic V, Kirovski D, Rolland M, et al. Comparison of immunogen designs that optimize peptide coverage: reply to Fischer et al. PLoS Comput Biol. 2008;4:e25. doi:10.1371/journal.pcbi.0040025.
- Barouch DH, O'Brien KL, Simmons NL, King SL, Abbink P, Maxfield LF, et al. Mosaic HIV-1 vaccines expand the breadth and depth of cellular immune responses in rhesus monkeys. Nat Med. 2010;16:319–23. doi:10.1038/nm.2089.
- Santra S, Liao HX, Zhang R, Muldoon M, Watson S, Fischer W, et al. Mosaic vaccines elicit CD8+ T lymphocyte responses that confer enhanced immune coverage of diverse HIV strains in monkeys. Nat Med. 2010;16:324–8. doi:10.1038/nm.2108.
- Fischer W, Perkins S, Theiler J, Bhattacharya T, Yusim K, Funkhouser R, et al. Polyvalent vaccines for optimal coverage of potential T-cell epitopes in global HIV-1 variants. Nat Med. 2007;13:100–6. doi:10.1038/nm1461.
- Fischer W, Liao HX, Haynes BF, Letvin NL, Korber B. Coping with viral diversity in HIV vaccine design: a response to Nickle et al. PLoS Comput Biol. 2008;4:e15; author reply e25. doi:10.1371/journal.pcbi.0040015.
- Doria-Rose NA, Learn GH, Rodrigo AG, Nickle DC, Li F, Mahalanabis M, et al. Human immunodeficiency virus type 1 subtype B ancestral envelope protein is functional and elicits neutralizing antibodies in rabbits similar to those elicited by a circulating subtype B envelope. J Virol. 2005;79:11214–24. doi:10.1128/JVI.79.17.11214-11224.2005.
- Mullins JI, Nickle DC, Heath L, Rodrigo AG, Learn GH. Immunogen sequence: the fourth tier of AIDS vaccine design. Expert Rev Vaccines. 2004;3:S151–9. doi:10.1586/14760584.3.4.S151.
- Nickle DC, Jensen MA, Gottlieb GS, Shriner D, Learn GH, Rodrigo AG, et al. Consensus and ancestral state HIV vaccines. Science. 2003;299:1515–8; author reply -8. doi:10.1126/science.299.5612.1515c.
- Dahirel V, Shekhar K, Pereyra F, Miura T, Artyomov M, Talsania S, et al. Coordinate linkage of HIV evolution reveals regions of immunological vulnerability. Proc Natl Acad Sci U S A. 2011;108:11530–5. doi:10.1073/pnas.1105315108.
- Letourneau S, Im EJ, Mashishi T, Brereton C, Bridgeman A, Yang H, et al. Design and pre-clinical evaluation of a universal HIV-1 vaccine. PLoS One. 2007;2:e984. doi:10.1371/journal.pone.0000984.
- Rosario M, Bridgeman A, Quakkelaar ED, Quigley MF, Hill BJ, Knudsen ML, et al. Long peptides induce polyfunctional T cells against conserved regions of HIV-1 with superior breadth to single-gene vaccines in macaques. Eur J Immunol. 2010;40:1973–84. doi:10.1002/eji.201040344.
- De Groot AS, Rivera DS, McMurry JA, Buus S, Martin W. Identification of immunogenic HLA-B7 “Achilles' heel” epitopes within highly conserved regions of HIV. Vaccine. 2008;26:3059–71. doi:10.1016/j.vaccine.2007.12.004.
- Wilson CC, McKinney D, Anders M, MaWhinney S, Forster J, Crimi C, et al. Development of a DNA vaccine designed to induce cytotoxic T lymphocyte responses to multiple conserved epitopes in HIV-1. J Immunol. 2003;171:5611–23. doi:10.4049/jimmunol.171.10.5611.
- Kaufman DR, Li F, Cruz AN, Self SG, Barouch DH. Focus and breadth of cellular immune responses elicited by a heterologous insert prime-boost vaccine regimen in rhesus monkeys. Vaccine. 2012;30:506–9. doi:10.1016/j.vaccine.2011.11.079.
- Almeida RR, Rosa DS, Ribeiro SP, Santana VC, Kallas EG, Sidney J, et al. Broad and cross-clade CD4+ T-cell responses elicited by a DNA vaccine encoding highly conserved and promiscuous HIV-1 M-group consensus peptides. PLoS One. 2012;7:e45267. doi:10.1371/journal.pone.0045267.
- Stephenson KE, SanMiguel A, Simmons NL, Smith K, Lewis MG, Szinger JJ, et al. Full-length HIV-1 immunogens induce greater magnitude and comparable breadth of T lymphocyte responses to conserved HIV-1 regions compared with conserved-region-only HIV-1 immunogens in rhesus monkeys. J Virol. 2012;86:11434–40. doi:10.1128/JVI.01779-12.
- Ondondo B, Murakoshi H, Clutton G, Abdul-Jawad S, Wee EG, Gatanaga H, et al. Novel conserved-region T-cell mosaic vaccine with high global HIV-1 coverage is recognized by protective responses in untreated infection. Mol Ther. 2016;24:832–42. doi:10.1038/mt.2016.3.
- Mothe B, Llano A, Ibarrondo J, Zamarreno J, Schiaulini M, Miranda C, et al. CTL responses of high functional avidity and broad variant cross-reactivity are associated with HIV control. PLoS One. 2012;7:e29717. doi:10.1371/journal.pone.0029717.
- Kulkarni V, Rosati M, Valentin A, Ganneru B, Singh AK, Yan J, et al. HIV-1 p24gag derived conserved element DNA vaccine increases the breadth of immune response in mice. PLos One. 2013;8:e60245 doi:10.1371/journal.pone.0060245.
- Kulkarni V, Valentin A, Rosati M, Alicea C, Singh AK, Jalah R, et al. Altered response hierarchy and increased T-cell breadth upon HIV-1 conserved element DNA vaccination in macaques. PLoS One. 2014;9:e86254. doi:10.1371/journal.pone.0086254.
- Mothe B, Hu X, Llano A, Rosati M, Olvera A, Kulkarni V, et al. A human immune data-informed vaccine concept elicits strong and broad T-cell specificities associated with HIV-1 control in mice and macaques. J Transl Med. 2015;13:60. doi:10.1186/s12967-015-0392-5.
- Asjo B, Stavang H, Sorensen B, Baksaas I, Nyhus J, Langeland N. Phase I trial of a therapeutic HIV type 1 vaccine, Vacc-4x, in HIV type 1-infected individuals with or without antiretroviral therapy. AIDS Res Hum Retroviruses. 2002;18:1357–65. doi:10.1089/088922202320935438.
- Kran AM, Sorensen B, Nyhus J, Sommerfelt MA, Baksaas I, Bruun JN, et al. HLA- and dose-dependent immunogenicity of a peptide-based HIV-1 immunotherapy candidate (Vacc-4x). AIDS. 2004;18:1875–83. doi:10.1097/00002030-200409240-00003.
- Pollard RB, Rockstroh JK, Pantaleo G, Asmuth DM, Peters B, Lazzarin A, et al. Safety and efficacy of the peptide-based therapeutic vaccine for HIV-1, Vacc-4x: a phase 2 randomised, double-blind, placebo-controlled trial. Lancet Infect Dis. 2014;14:291–300. doi:10.1016/S1473-3099(13)70343-8.
- Carlson JM, Brumme CJ, Martin E, Listgarten J, Brockman MA, Le AQ, et al. Correlates of protective cellular immunity revealed by analysis of population-level immune escape pathways in HIV-1. J Virol. 2012;86:13202–16. doi:10.1128/JVI.01998-12.
- Carlson JM, Le AQ, Shahid A, Brumme ZL. HIV-1 adaptation to HLA: a window into virus-host immune interactions. Trends Microbiol. 2015;23:212–24. doi:10.1016/j.tim.2014.12.008.
- Keane NM, Roberts SG, Almeida CA, Krishnan T, Chopra A, Demaine E, et al. High-avidity, high-IFNgamma-producing CD8 T-cell responses following immune selection during HIV-1 infection. Immunol Cell Biol. 2012;90:224–34. doi:10.1038/icb.2011.34.
- Rolland M, Tovanabutra S, deCamp AC, Frahm N, Gilbert PB, Sanders-Buell E, et al. Genetic impact of vaccination on breakthrough HIV-1 sequences from the STEP trial. Nat Med. 2011;17:366–71. doi:10.1038/nm.2316.
- Christie NM, Willer DO, Lobritz MA, Chan JK, Arts EJ, Ostrowski MA, et al. Viral fitness implications of variation within an immunodominant CD8+ T-cell epitope of HIV-1. Virology. 2009;388:137–46. doi:10.1016/j.virol.2009.03.003.
- Brander C, Hartman KE, Trocha AK, Jones NG, Johnson RP, Korber B, et al. Lack of strong immune selection pressure by the immunodominant, HLA-A*0201-restricted cytotoxic T lymphocyte response in chronic human immunodeficiency virus-1 infection. J Clin Invest. 1998;101:2559–66. doi:10.1172/JCI2405.
- Goulder PJ, Watkins DI. HIV and SIV CTL escape: implications for vaccine design. Nat Rev Immunol. 2004;4:630–40. doi:10.1038/nri1417.
- Goulder PJ, Brander C, Tang Y, Tremblay C, Colbert RA, Addo MM, et al. Evolution and transmission of stable CTL escape mutations in HIV infection. Nature. 2001;412:334–8. doi:10.1038/35085576.
- Goonetilleke N, Liu MK, Salazar-Gonzalez JF, Ferrari G, Giorgi E, Ganusov VV, et al. The first T cell response to transmitted/founder virus contributes to the control of acute viremia in HIV-1 infection. J Exp Med. 2009;206:1253–72. doi:10.1084/jem.20090365.
- Deng K, Pertea M, Rongvaux A, Wang L, Durand CM, Ghiaur G, et al. Broad CTL response is required to clear latent HIV-1 due to dominance of escape mutations. Nature. 2015;517:381–5. doi:10.1038/nature14053.
- Chen W, McCluskey J. Immunodominance and immunodomination: critical factors in developing effective CD8+ T-cell-based cancer vaccines. Adv Cancer Res. 2006;95:203–47. doi:10.1016/S0065-230X(06)95006-4.
- Lauron EJ, Yang L, Elliott JI, Gainey MD, Fremont DH, Yokoyama WM. Cross-priming induces immunodomination in the presence of viral MHC class I inhibition. PLoS Pathog. 2018;14:e1006883. doi:10.1371/journal.ppat.1006883.
- Chen W, Anton LC, Bennink JR, Yewdell JW. Dissecting the multifactorial causes of immunodominance in class I-restricted T cell responses to viruses. Immunity. 2000;12:83–93. doi:10.1016/S1074-7613(00)80161-2.
- Ogg GS, Jin X, Bonhoeffer S, Dunbar PR, Nowak MA, Monard S, et al. Quantitation of HIV-1-specific cytotoxic T lymphocytes and plasma load of viral RNA. Science. 1998;279:2103–6. doi:10.1126/science.279.5359.2103.
- Salazar-Gonzalez JF, Salazar MG, Keele BF, Learn GH, Giorgi EE, Li H, et al. Genetic identity, biological phenotype, and evolutionary pathways of transmitted/founder viruses in acute and early HIV-1 infection. J Exp Med. 2009;206:1273–89. doi:10.1084/jem.20090378.
- Mothe B, Llano A, Ibarrondo J, Daniels M, Miranda C, Zamarreno J, et al. Definition of the viral targets of protective HIV-1-specific T cell responses. J Transl Med. 2011;9:208. doi:10.1186/1479-5876-9-208.
- Borrow P, Lewicki H, Hahn BH, Shaw GM, Oldstone MB. Virus-specific CD8+ cytotoxic T-lymphocyte activity associated with control of viremia in primary human immunodeficiency virus type 1 infection. J Virol. 1994;68:6103–10.
- Fellay J, Shianna KV, Ge D, Colombo S, Ledergerber B, Weale M, et al. A whole-genome association study of major determinants for host control of HIV-1. Science. 2007;317:944–7. doi:10.1126/science.1143767.
- Koup RA, Safrit JT, Cao Y, Andrews CA, McLeod G, Borkowsky W, et al. Temporal association of cellular immune responses with the initial control of viremia in primary human immunodeficiency virus type 1 syndrome. J Virol. 1994;68:4650–5.
- Carrington M, O'Brien SJ. The influence of HLA genotype on AIDS. Annu Rev Med. 2003;54:535–51. doi:10.1146/annurev.med.54.101601.152346.
- Adland E, Hill M, Lavandier N, Csala A, Edwards A, Chen F, et al. Differential immunodominance hierarchy of CD8(+) T-cell responses in HLA-B*27:05- and -B*27:02-mediated control of HIV-1 infection. J Virol. 2018;92:e01685.
- Goulder PJ, Walker BD. HIV and HLA class I: an evolving relationship. Immunity. 2012;37:426–40. doi:10.1016/j.immuni.2012.09.005.
- Borthwick N, Lin Z, Akahoshi T, Llano A, Silva-Arrieta S, Ahmed T, et al. Novel, in-natural-infection subdominant HIV-1 CD8+ T-cell epitopes revealed in human recipients of conserved-region T-cell vaccines. PLoS One. 2017;12:e0176418. doi:10.1371/journal.pone.0176418.
- Goulder PJ, Phillips RE, Colbert RA, McAdam S, Ogg G, Nowak MA, et al. Late escape from an immunodominant cytotoxic T-lymphocyte response associated with progression to AIDS. Nat Med. 1997;3:212–7. doi:10.1038/nm0297-212.
- Murakoshi H, Akahoshi T, Koyanagi M, Chikata T, Naruto T, Maruyama R, et al. Clinical control of HIV-1 by cytotoxic T cells specific for multiple conserved epitopes. J Virol. 2015;89:5330–9. doi:10.1128/JVI.00020-15.
- Laher F, Ranasinghe S, Porichis F, Mewalal N, Pretorius K, Ismail N, et al. HIV controllers exhibit enhanced frequencies of major histocompatibility complex class II tetramer(+) Gag-specific CD4(+) T cells in chronic clade C HIV-1 infection. J Virol. 2017;91. doi:10.1128/JVI.02477-16.
- Dinges WL, Richardt J, Friedrich D, Jalbert E, Liu Y, Stevens CE, et al. Virus-specific CD8+ T-cell responses better define HIV disease progression than HLA genotype. J Virol. 2010;84:4461–8. doi:10.1128/JVI.02438-09.
- Rolland M, Manocheewa S, Swain JV, Lanxon-Cookson EC, Kim M, Westfall DH, et al. HIV-1 conserved-element vaccines: relationship between sequence conservation and replicative capacity. J Virol. 2013;87:5461–7. doi:10.1128/JVI.03033-12.
- Jin X, Bauer DE, Tuttleton SE, Lewin S, Gettie A, Blanchard J, et al. Dramatic rise in plasma viremia after CD8(+) T cell depletion in simian immunodeficiency virus-infected macaques. J Exp Med. 1999;189:991–8. doi:10.1084/jem.189.6.991.
- Metzner KJ, Jin X, Lee FV, Gettie A, Bauer DE, Di Mascio M, et al. Effects of in vivo CD8(+) T cell depletion on virus replication in rhesus macaques immunized with a live, attenuated simian immunodeficiency virus vaccine. J Exp Med. 2000;191:1921–31. doi:10.1084/jem.191.11.1921.
- Schmitz JE, Kuroda MJ, Santra S, Sasseville VG, Simon MA, Lifton MA, et al. Control of viremia in simian immunodeficiency virus infection by CD8+ lymphocytes. Science. 1999;283:857–60. doi:10.1126/science.283.5403.857.
- von Gegerfelt A, Valentin A, Alicea C, Van Rompay KK, Marthas ML, Montefiori DC, et al. Emergence of simian immunodeficiency virus-specific cytotoxic CD4+ T cells and increased humoral responses correlate with control of rebounding viremia in CD8-depleted macaques infected with Rev-independent live-attenuated simian immunodeficiency virus. J Immunol. 2010;185:3348–58. doi:10.4049/jimmunol.1000572.
- Mueller YM, Do DH, Boyer JD, Kader M, Mattapallil JJ, Lewis MG, et al. CD8+ cell depletion of SHIV89.6P-infected macaques induces CD4+ T cell proliferation that contributes to increased viral loads. J Immunol. 2009;183:5006–12. doi:10.4049/jimmunol.0900141.
- Cartwright EK, Spicer L, Smith SA, Lee D, Fast R, Paganini S, et al. CD8(+) lymphocytes are required for maintaining viral suppression in SIV-infected macaques treated with short-term antiretroviral therapy. Immunity. 2016;45:656–68. doi:10.1016/j.immuni.2016.08.018.
- Fukazawa Y, Lum R, Okoye AA, Park H, Matsuda K, Bae JY, et al. B cell follicle sanctuary permits persistent productive simian immunodeficiency virus infection in elite controllers. Nat Med. 2015;21:132–9. doi:10.1038/nm.3781.
- Petrovas C, Yamamoto T, Gerner MY, Boswell KL, Wloka K, Smith EC, et al. CD4 T follicular helper cell dynamics during SIV infection. J Clin Invest. 2012;122:3281–94. doi:10.1172/JCI63039.
- Xu Y, Weatherall C, Bailey M, Alcantara S, De Rose R, Estaquier J, et al. Simian immunodeficiency virus infects follicular helper CD4 T cells in lymphoid tissues during pathogenic infection of pigtail macaques. J Virol. 2013;87:3760–73. doi:10.1128/JVI.02497-12.
- Deleage C, Wietgrefe SW, Del Prete G, Morcock DR, Hao XP, Piatak M, Jr, et al. Defining HIV and SIV reservoirs in lymphoid tissues. Pathog Immun. 2016;1:68–106. doi:10.20411/pai.v1i1.100.
- Deleage C, Turkbey B, Estes JD. Imaging lymphoid tissues in nonhuman primates to understand SIV pathogenesis and persistence. Curr Opin Virol. 2016;19:77–84. doi:10.1016/j.coviro.2016.07.002.
- Demers KR, Reuter MA, Betts MR. CD8(+) T-cell effector function and transcriptional regulation during HIV pathogenesis. Immunol Rev. 2013;254:190–206. doi:10.1111/imr.12069.
- Nishimura Y, Gautam R, Chun TW, Sadjadpour R, Foulds KE, Shingai M, et al. Early antibody therapy can induce long-lasting immunity to SHIV. Nature. 2017;543:559–63. doi:10.1038/nature21435.
- Li S, Folkvord JM, Rakasz EG, Abdelaal HM, Wagstaff RK, Kovacs KJ, et al. Simian immunodeficiency virus-producing cells in follicles are partially suppressed by CD8+ cells in vivo. J Virol. 2016;90:11168–80. doi:10.1128/JVI.01332-16.
- Barouch DH, Kunstman J, Kuroda MJ, Schmitz JE, Santra S, Peyerl FW, et al. Eventual AIDS vaccine failure in a rhesus monkey by viral escape from cytotoxic T lymphocytes. Nature. 2002;415:335–9. doi:10.1038/415335a.
- Mudd PA, Martins MA, Ericsen AJ, Tully DC, Power KA, Bean AT, et al. Vaccine-induced CD8+ T cells control AIDS virus replication. Nature. 2012;491:129–33. doi:10.1038/nature11443.
- Kiepiela P, Ngumbela K, Thobakgale C, Ramduth D, Honeyborne I, Moodley E, et al. CD8+ T-cell responses to different HIV proteins have discordant associations with viral load. Nat Med. 2007;13:46–53. doi:10.1038/nm1520.
- Ndhlovu ZM, Stampouloglou E, Cesa K, Mavrothalassitis O, Alvino DM, Li JZ, et al. The breadth of expandable memory CD8+ T cells inversely correlates with residual viral loads in HIV elite controllers. J Virol. 2015;43:591–604.
- Janes H, Friedrich DP, Krambrink A, Smith RJ, Kallas EG, Horton H, et al. Vaccine-induced gag-specific T cells are associated with reduced viremia after HIV-1 infection. J Infect Dis. 2013;208:1231–9. doi:10.1093/infdis/jit322.
- Kulkarni V, Valentin A, Rosati M, Rolland M, Mullins JI, Pavlakis GN, et al. HIV-1 conserved elements p24CE DNA vaccine induces humoral immune responses with broad epitope recognition in macaques. PLoS One. 2014;9 e111085. doi:10.1371/journal.pone.0111085.
- Rolland M, Heckerman D, Deng W, Rousseau CM, Coovadia H, Bishop K, et al. Broad and Gag-biased HIV-1 epitope repertoires are associated with lower viral loads. PLoS One. 2008;3:e1424. doi:10.1371/journal.pone.0001424.
- Rolland M, Nickle DC, Mullins JI. HIV-1 group M conserved elements vaccine. PLoS Pathog. 2007;3:e157. doi:10.1371/journal.ppat.0030157.
- Hu X, Valentin A, Dayton F, Kulkarni V, Alicea A, Rosati M, et al. DNA Prime-boost vaccine regimen to increase breadth, magnitude, and cytotoxicity of the cellular immune responses to subdominant Gag epitopes of SIV and HIV. J Immunol. 2016;197:3999–4013. doi:10.4049/jimmunol.1600697.
- Hu X, Valentin A, Rosati M, Manocheewa S, Alicea C, Chowdhury B, et al. HIV env conserved element DNA vaccine alters immunodominance in macaques. Hum Vaccin Immunother. 2017;13:2859–71. doi:10.1080/21645515.2017.1339852.
- Bockl K, Wild J, Bredl S, Kindsmuller K, Kostler J, Wagner R. Altering an artificial gagpolnef polyprotein and mode of ENV co-administration affects the immunogenicity of a clade C HIV DNA vaccine. PLoS One. 2012;7:e34723. doi:10.1371/journal.pone.0034723.
- Valentin A, Li J, Rosati M, Kulkarni V, Patel V, Jalah R, et al. Dose-dependent inhibition of gag cellular immunity by env in SIV/HIV DNA vaccinated macaques. Hum Vaccin Immunother. 2015;11:2005–11. doi:10.1080/21645515.2015.1016671.
- Toapanta FR, Craigo JK, Montelaro RC, Ross TM. Reduction of anti-HIV-1 Gag immune responses during co-immunization: immune interference by the HIV-1 envelope. Curr HIV Res. 2007;5:199–209. doi:10.2174/157016207780077057.
- Graham BS, Koup RA, Roederer M, Bailer RT, Enama ME, Moodie Z, et al. Phase 1 safety and immunogenicity evaluation of a multiclade HIV-1 DNA candidate vaccine. J Infect Dis. 2006;194:1650–60. doi:10.1086/509259.
- Amante DH, Smith TR, Mendoza JM, Schultheis K, McCoy JR, Khan AS, et al. Skin transfection patterns and expression kinetics of electroporation-enhanced plasmid delivery using the CELLECTRA-3P, a portable next-generation dermal electroporation device. Hum Gene Ther Methods. 2015;26:134–46.
- Morrow MP, Tebas P, Yan J, Ramirez L, Slager A, Kraynyak K, et al. Synthetic consensus HIV-1 DNA induces potent cellular immune responses and synthesis of granzyme B, perforin in HIV infected individuals. Mol Ther. 2015;23:591–601.
- Kulkarni V, Rosati M, Jalah R, Ganneru B, Alicea C, Yu L, et al. DNA vaccination by intradermal electroporation induces long-lasting immune responses in rhesus macaques. J Med Primatol. 2014;43:329–40.
- Kulkarni V, Rosati M, Bear J, Pilkington GR, Jalah R, Bergamaschi C, et al. Comparison of intradermal and intramuscular delivery of SIV env DNA by in vivo electroporation in macaques. Hum Vaccin Immunother. 2013;9:2081–94.
- Valentin A, McKinnon K, Li J, Rosati M, Kulkarni V, Pilkington GR, et al. Comparative analysis of SIV-specific cellular immune responses induced by different vaccine platforms in rhesus macaques. Clin Immunol. 2014;55:91–107.
- Ake JA, Schuetz A, Pegu P, Wieczorek L, Eller MA, Kibuuka H, et al. Safety and immunogenicity of PENNVAX-G DNA prime administered by Biojector 2000 or CELLECTRA electroporation device with modified vaccinia Ankara-CMDR boost. J Infect Dis. 2017;216:1080–90.
- Martins MA, Shin YC, Gonzalez-Nieto L, Domingues A, Gutman MJ, Maxwell HS, et al. Vaccine-induced immune responses against both Gag and Env improve control of simian immunodeficiency virus replication in rectally challenged rhesus macaques. PLoS Pathog. 2017;13:e1006529.
- Roederer M, Keele BF, Schmidt SD, Mason RD, Welles HC, Fischer W, et al. Immunological and virological mechanisms of vaccine-mediated protection against SIV and HIV. Nature. 2014;505:502–8.
- Hansen SG, Piatak M, Jr, Ventura AB, Hughes CM, Gilbride RM, Ford JC, et al. Immune clearance of highly pathogenic SIV infection. Nature. 2013;502:100–4.
- Hansen SG, Ford JC, Lewis MS, Ventura AB, Hughes CM, Coyne-Johnson L, et al. Profound early control of highly pathogenic SIV by an effector memory T-cell vaccine. Nature. 2011;473:523–7.
- Schell JB, Bahl K, Folta-Stogniew E, Rose N, Buonocore L, Marx PA, et al. Antigenic requirement for Gag in a vaccine that protects against high-dose mucosal challenge with simian immunodeficiency virus. Virology. 2015;476:405–12.
- Schell JB, Rose NF, Bahl K, Diller K, Buonocore L, Hunter M, et al. Significant protection against high-dose simian immunodeficiency virus challenge conferred by a new prime-boost vaccine regimen. J Virol. 2011;85:5764–72.
- Hansen SG, Sacha JB, Hughes CM, Ford JC, Burwitz BJ, Scholz I, et al. Cytomegalovirus vectors violate CD8+ T cell epitope recognition paradigms. Science. 2013;340:1237874.
- Hansen SG, Wu HL, Burwitz BJ, Hughes CM, Hammond KB, Ventura AB, et al. Broadly targeted CD8(+) T cell responses restricted by major histocompatibility complex E. Science. 2016;351:714–20.
- Rosati M, von Gegerfelt A, Roth P, Alicea C, Valentin A, Robert-Guroff M, et al. DNA vaccines expressing different forms of simian immunodeficiency virus antigens decrease viremia upon SIVmac251 challenge. J Virol. 2005;79:8480–92.
- Jalah R, Patel V, Kulkarni V, Rosati M, Alicea C, Ganneru B, et al. IL-12 DNA as molecular vaccine adjuvant increases the cytotoxic T cell responses and breadth of humoral immune responses in SIV DNA vaccinated macaques. Hum Vaccin Immunother. 2012;8:1620–9.
- Jalah R, Rosati M, Ganneru B, Pilkington GR, Valentin A, Kulkarni V, et al. The p40 subunit of IL-12 promotes stabilization and export of the p35 subunit: implications for improved IL-12 cytokine production. J Biol Chem. 2013;288:6763–76.