
 ?Mathematical formulae have been encoded as MathML and are displayed in this HTML version using MathJax in order to improve their display. Uncheck the box to turn MathJax off. This feature requires Javascript. Click on a formula to zoom.
ABSTRACT
Background: In this study, we aimed to explore the rural-urban disparities in the magnitude and determinants of missed opportunities for vaccination (MOV) in sub-Saharan Africa.
Methods: This was a cross-sectional study using nationally representative household surveys conducted between 2007 and 2017 in 35 countries across sub-Saharan Africa. The risk difference in MOV between rural or urban dwellers were calculated. Logistic regression method was used to investigate the urban-rural disparities in multivariable analyses. Then Blinder-Oaxaca method was used to decompose differences in MOV between rural and urban dwellers.
Results: The median number of children aged 12 to 23 months was 2113 (Min: 370, Max: 5896). There was wide variation in the the magnitude of MOV among children in rural and urban areas across the 35 countries. The magnitude of MOV in rural areas varied from 18.0% (95% CI 14.7 to 21.4) in the Gambia to 85.2% (81.2 to 88.9) in Gabon. Out of the 35 countries included in this analysis, pro-rural inequality was observed in 16 countries (i.e. MOV is prevalent among children living in rural areas) and pro-urban inequality in five countries (i.e. MOV is prevalent among children living in urban areas). The contributions of the compositional ‘explained’ and structural ‘unexplained’ components varied across the countries. However, household wealth index was the most frequently identified factor.
Conclusions: Variation exists in the level of missed opportunities for vaccination between rural and urban areas, with widespread pro-rural inequalities across Africa. Although several factors account for these rural-urban disparities in various countries, household wealth was the most common.
Introduction
Immunization is one of the most effective public health interventions for preventing common childhood infectious diseases.Citation1 According to estimates from the Global Burden of Disease study in 2017, under-five mortality has significantly reduced between 1970 and 2016 from 16.4 million to 5.0 million respectively.Citation2 This global decline in child mortality is partly attributed to childhood immunization.Citation3 To sustain this, childhood immunization has remained an important global health agenda.Citation4 However, global immunization coverage has stagnated in recent years.Citation5 In 2008, coverage with third dose of diptheria-tetanus-pertussis containing vaccine (DTP3 coverage) was estimated to be 83%.Citation5 This coverage level only increased marginally by 3% in 2015, and remained at same level in 2016.Citation5 Consequently, an estimated 19.5 million children, which represents about one-fifth of the annual global birth cohort, remain unvaccinated or undervaccinated.Citation6
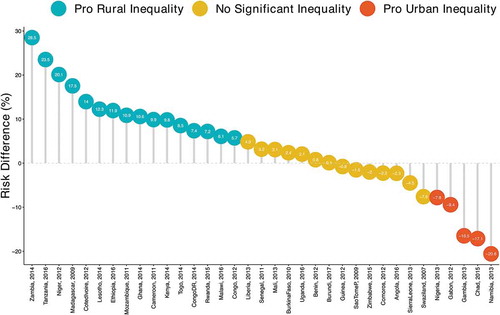
Figure 1. Prevalence of missed opportunities for vaccination in rural and urban areas of countries in sub-Saharan Africa
In an effort to breach this gap, the World Health Organization (WHO) has reinvigorated efforts to reduce missed opportunities for vaccination (MOV).Citation7 MOV is defined by the WHO as “any contact with health services by a child (or adult) who is eligible for vaccination (unvaccinated, partially vaccinated or not up-to-date, and free of contraindications to vaccination), which does not result in the individual receiving all the vaccine doses for which he or she is eligible”.Citation8 MOV assessments are conducted in health facilities across Africa and other continents in order to help local stakeholders to plan appropriate interventions.Citation8
Several social determinants of health that contribute to inequalities in Africa, also affect access to immunization services.Citation9–Citation13 However, there is a dearth of evidence on how underlying inequalities, particularly, rural – urban disparities, affects MOV. Inequality results in disproportionate access to vaccines, therefore impeding progress towards univeral access. Identifying the disparities where they exists will serve as useful information for policy-makers at regional and national level when planning programmes to address MOV and improve immunization coverage. In addition, understanding the factors that influence rural-urban disparities in MOV can foster consideration for context-specific interventions for addressing MOV.
In this study we determined the burden of MOV among children aged 12– 23 months in rural and urban areas and described the factors associated with rural-urban disparity. The findings from this study advanced current knowledge by exploring the relationship between place of residence and missed opportunities for vaccination in sub-Saharan Africa.
Results
Survey and sample characteristics
The surveys were conducted between 2007 and 2017. The median (min,max) number of children aged 12 to 23 months was 2113 (370, 5893) (). Among study participants, the proportion of male children was 50.6%. Mean (standard deviation) age of children in months was 17.13 (3.42). About 46% of the mothers were aged between 25 to 34 years old and 40% had no formal education. Almost one third of the mothers were not working at the time of the survey. Majority of the respondents were living in rural areas (70%). Other demographic characteristics of the study participants are presented on . The burden of MOV in rural areas varied from 18.0% (95% CI 14.7 to 21.4) in the Gambia to 85.2% (81.2 to 88.9) in Gabon. Details of the pooled MOV for each country is presented on . In some countries, the prevalence of MOV in rural areas was higher compared to urban areas (Figure 1). This was highest in Zambia where the magnitude of MOV in rural areas was 74.4% and 45.9% in urban area with a risk difference of 28.5% (95%CI: 24.6 to 32.4). However, in Namibia, the burden of MOV in rural areas was 22.9%, while in urban areas, it was 43.5%, thus yielding a risk difference of −20.6% (95% CI −26.5 to −14.6). shows details of the variation in MOV among children in rural and urban areas across the 35 countries included in the study.
Table 1. Description of demographic and health surveys data by countries, in sub-Saharan Africa, 2007 to 2016.
Table 2. Summary of pooled sample characteristics of the demographic and health surveys data in sub-Saharan Africa.
Magnitude and variations in residence inequality in MOV
shows the risk difference (measure of inequality) between mothers residing in rural and urban areas. Out of the 35 countries included in this analysis, 16 countries showed pro-rural inequality (i.e. MOV is prevalent among mothers living in rural areas), four showed pro-urban inequality (i.e. MOV is prevalent among mothers living in urban areas) and remaining 14 countries showed no significant inequality. Among the countries with significant pro-rural inequality, the risk difference ranged from 5.7% (95% CI 1.1 to 10.4) to 28.5% (95% CI 24.6 to 32.4). The risk difference ranged from −20.6% (95% CI −26.5 to −14.6) in Namibia to −7.8% (95% CI −10.4 to −5.2) in Nigeria (countries with significant pro-urban inequality).
Figure 2. Risk difference between in magnitude of missed opportunities for vaccination between rural and urban areas in sub-Saharan Africa.
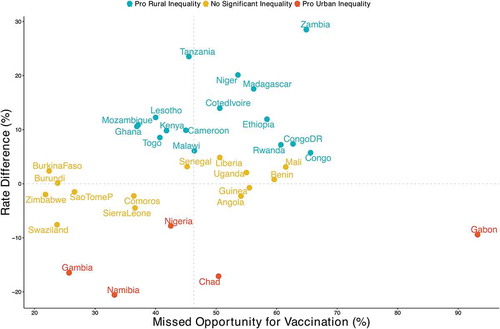
plot the relationship between the magnitude of MOV and inequality for all countries. The countries can be grouped into distinct categories, those with:
high MOV and high pro-rural inequality such as Zambia
high MOV and high pro-urban inequality such as Gabon
low MOV and high pro-rural inequality such as Lesotho and Mozambique
low MOV and high pro-urban inequality such as the Gambia
Figure 3. Rate difference in magnitude of missed opportunities for vaccination between urban and rural areas in sub-Saharan Africa.
Decomposition of residence inequality in MOV
A negative contribution indicates that the determinant was narrowing the relative gap between rural and urban areas and vice versa. The contributions of the compositional ‘explained’ and structural ‘unexplained’ components varied across the countries. Compositional effects of the determinants were responsible for most of the inequality in MOV between rural and urban areas in Liberia, Kenya, Ghana, Cote d’ivore, Congo DR and Cameroon. While in Lesotho and Ethiopia structural effects of the determinants were responsible for most of the inequality in MOV between rural and urban areas. Important factors responsible for the inequality varied across the countries. On average, household wealth index was the most important factors in most countries. In Mozambique, the largest contributions to the inequality in MOV was wealth index followed by media access and maternal education. Wealth index and not working were narrowing the inequality in MOV between rural and urban areas in Uganda and Rwanda respectively. shows the detailed decomposition of the part of the inequality that was caused by compositional effects of the determinants.
Figure 4. Compositional effect of the determinants of missed opportunities for vaccination in rural and urban areas in sub-Saharan Africa.
Discussion
Main findings
The magnitude of missed opportunities for vaccination was 90.8% and 85.6% in urban and rural areas of Gabon respectively, and this was the highest among all countries. Swaziland had the lowest level of missed opportunities for vaccination in rural areas, while Zimbabwe had the lowest level in urban areas compared to all countries. There was significant pro-rural inequality in the following countries: Tanzania, Zambia, Niger, Madagascar, Uganda, Cote d’Ivoire, Lesotho, Ethiopia, Kenya, Mozambique, Democratic Republic of Congo, Rwanda, Ghana, Liberia, and Cameroon. Several demographic and socioeconomic factors were found to be responsible for the rural-urban disparity in missed opportunities for vaccination in different countries. The compositional effects of these determinants accounted for the disparity in MOV in six countries namely; Kenya, Liberia, Cote d’Ivoire, Ghana, Democratic republic of Congo, and Cameroon. While structural effects are responsible in Lesotho and Ethiopia. Household wealth index was the most implicated factor responsible for this disparity across the countries.
Policy implications
Currently a great proportion of households making contact with health facilities fail to get the eligible children vaccinated. This results in missed opportunities for vaccination which invariably affects the overall immunization coverage at regional and national level.Citation9 The magnitude of missed opportunities for vaccination varied from country to country between rural and urban areas. In Tanzania, the gap difference was marked widely. In Zimbabwe, however, missed opportunties for vaccination was low in both areas, and this is consistent with the overall high performance of the immunization system in the country.Citation5 Nevertheless, it is important to note that in rural areas, factors such as low level of education among mothers, low household wealth, high number of children who are less than five years, and high birth order were common factors related to high MOV in rural areas. Similar factors have been found to be associated with MOV in other studies.Citation9,Citation14
In this study, high pro-rural inequality was found in 16 countries. Place of residence (rural and urban) is a recognized dimension of inequality, and it has been associated with immunization inequality, with rural areas often disadvantage.Citation15–Citation17 It is therefore not surprising that more countries had pro-rural inequalities in missed opportunities for vaccination in this study. This can be explained by poor performance of immunization clinics in rural areas due health services-related factors.
Based on our findings, rural-urban disparity in missed opportunities for vaccination within countries are determined by several factors as follows: household wealth, maternal education, media access, number of underfive children, and birth order of the child. Nevertheless, household wealth was found to be an important factor in most of the countries. Children in wealthy households are likely to be taken to less crowded health facilities, and even spend more time, thus resulting in verification of their vaccination status, and subsequent immunization, if needed. The relationship between socioeconomic status and vaccination in Africa has been reported in several studies.Citation18,Citation19 In fact, household wealth has been found to be a predictor of full immunization coverage in previous studies.Citation20,Citation21 Maternal education was another factors that was observed in several countries. Other studies have emphasized the role of maternal education in ensuring a child’s vaccinatio.Citation22,Citation23 Since mothers in rural areas usually have lower level of education, they are less likely to seek information about vaccination.
Strengths and limitations of the study
This study is one of the first analysis of rural-urban disparities in missed opportunities for vaccination in Africa, and the use of nationally representative data from each of the 35 countries enhances the confidence in the estimates produced. However, there are limitations. First, causal relationship cannot be inferred from our findings because a cross sectional study design was used. Secondly, MOV was estimated using DHS data which is originally a household survey, although evidence of contact with health facilities was obtained using other variables therein. In addition, surveys conducted at different time points were combined in this study, the earliest being in 2007, and latest in 2016. Due to data limitations, MOV for specific vaccines and vaccine doses could not be determined. A main strength of this study was a proxy measure of wealth using household economic status was developed and used.
Methods
Study design and data
Data for this cross-sectional study was obtained from Demographic and Health Surveys (DHS), which are nationally representative household surveys conducted in low- and middle-income countries. This study used data from 35 recent DHS surveys conducted between 2007 and 2016 in sub-Saharan Africa available as of December 2017. The DHS uses a multi-stage, stratified sampling design with households as the sampling unit.Citation24 Within each sample household, all women and men meeting the eligibility criteria are interviewed. Because the surveys are not self-weighting, weights are calculated to account for unequal selection probabilities as well as for non-responses. With weights applied, survey findings represent the full target populations. The DHS surveys collects data using a household questionnaire. For eligible individuals within households, interviews are conducted using a woman’s or man’s questionnaire. DHS surveys are implemented across countries with standardized interviewer training, supervision, and implementation protocols.
Outcome variable
We used the World Health Organization (WHO) definition of missed opportunity for vaccination (MOV) as the outcome variable, defined as a binary variable that takes the value of 1 if a child who is eligible for vaccination, 12–23 months had any contact with health services, which does not result in the child receiving one or more of the vaccine doses for which he or she is eligible. Contact with health services was defined using the following five variables: skilled birth attendance, baby postnatal check within 2 months, received vitamin A dose in first 2 months after delivery, has a health card and received medical treatment for diarrhea/fever/cough.
Main determinant variable
Place of residence which was categorised as rural or urban areas.
Explanatory variables
The following factors were included in the models: child’s age, sex (male versus female), high birth order (>4 birth order), number of under five children in the household, maternal age in completed years (15 to 24, 25 to 34, 35 to 49), employment status (working or not working), maternal education (no education, primary or secondary or higher) and media access (radio, television or newspaper). Media access was assessed using the following indicators: access to information measured via frequency of watching television, listening to radio, and reading newspapers/magazine. To allow meaningful analysis, we dichotomized the response levels “less than one week”, “at least once a week”, and “almost every day” as one group and the response level “not at all” as the other group. We then created an additive media access variable (from 0 to 3) that counted the number of media type each respondent had access to. Wealth index was used as a proxy indicator for socioeconomic position. The methods used in calculating DHS wealth index have been described elsewhere.Citation25,Citation26 Briefly, an index of economic status for each household was constructed using principal components analysis based on the following household variables: number of rooms per house, ownership of car, motorcycle, bicycle, fridge, television and telephone as well as any kind of heating device. From these criteria the DHS wealth index quintiles (poorest, poorer, middle, richer and richest) were calculated and used in the subsequent modelling.
Statistical analyses
The analytical approach included descriptive statistics, univariable analysis and Blinder-Oaxaca decomposition techniques using logistic regressions. We used descriptive statistics to show the distribution of respondents by the key variables. Values were expressed as absolute numbers (percentages) and mean (standard deviation) for categorical and continuous variables respectively. In the descriptive statistics the distribution of respondents by key variables were expressed as percentages. All cases in the DHS data were given weights to adjust for differences in probability of selection and to adjust for non-response in order to produce the proper representation. Individual weights were used for descriptive statistics in this study.
We calculate risk difference in missed opportunities between the two group, living in rural or urban areas. A risk difference greater than 0 suggests that missed opportunities is prevalent among children living in rural areas (pro-rural inequality). Conversely, a negative risk difference indicates that missed opportunities for vaccination is prevalent among children living in urban areas (pro-urban inequality). Finally, we adopted logistic regression method using the pooled cross-sectional data to investigate the urban-rural disparities in multivariable analyses adjusted for explanatory variables.
The Blinder-Oaxaca decomposition was a counterfactual method with an assumption that “what the probability of missed opportunities for vaccination would be if children living in rural areas had the same characteristics as their urban counterparts?”.Citation27,Citation28 The Blinder-Oaxaca method allows for the decomposition of the difference in an outcome variable between 2 groups into 2 components.Citation27,Citation28 The first component is the “explained” portion of that gap that captures differences in the distributions of the measurable characteristics (referred as “compositional” or “endowments”) of these groups.Citation27,Citation28 This illustrates the portion of the gap in missed opportunities for vaccination that is attributed to the differences in observable, measurable characteristics between the two groups. Using this method, we can quantify how much of the gap the “advantaged” and the “disadvantaged” groups is attributable to these differences in specific measurable characteristics. The second component is the “unexplained” part, meaning the portion of the gap due to the differences in the estimated regression coefficients and the unmeasured variables between the two groups.Citation27,Citation28 This is also referred to in the literature as the “structural” component or the “coefficient” portion of the decomposition. This reflects the remainder of the model not explained by the differences in measurable, objective characteristics. The “unexplained” portion arises from differentials in how the predictor variables are associated with the outcomes for the two groups. This portion would persist even if the disadvantaged group were to attain the same average levels of measured predictor variables as the advantaged group.
The DHS stratification and the unequal sampling weights as well as household clustering effects were considered in the analysis to correct standard errors. All tests were two tailed and p < 0.05 was considered significant.
Model fit and specifications
Regression diagnostics were used to judge the goodness-of-fit of the model. They included the tolerance test for multicollinearity, its reciprocal variance inflation factors (VIF), presence of outliers and estimates of adjusted R square of the regression model. We checked for multi-collinearity among explanatory variables examining the variance inflation factor (VIF),Citation29 all diagonal elements in the variance-covariance () matrix for correlation between −1 and 1, and diagonal elements for any elements close to zero. The largest VIF greater than 10 or the mean VIF greater than 6 represent severe multicollinearity. None of the results of the tests provided reasons for concern. Thus, the models provide robust and valid results.
Conclusion
In conclusion, variation exists in the level of missed opportunities for vaccination between rural and urban areas, with widespread pro-rural inequalities across Africa. Although several factors account for these rural-urban disparities in various countries, household wealth was the most common.
Recommendations are as follows;
The variation in magnitude of missed opportunities for vaccination between rural and urban areas necessitates consideration for place of residence in immunization activities to address this problem.
Intersectoral collaboration between national immunization programmes and other government ministries and agencies is necessary as several social factors have been found to influence the urban-rural disparity in missed opportunities for vaccination.
Multifacted approach which takes local context and other social factors into consideration will be a better approach to closing the gap between rural and urban dweller.
There is a need for further research on inequalities in missed opportunities for vaccination in order to identify how it varies by other sociodemographic factors that are likely to cause inequality such as maternal education, wealth among others.
Abbreviations
| DHS | = | Demographic and Health Survey |
| DTP3 | = | Third Dose of Diptheria-Tetanus-Pertussis containing vaccine |
| MOV | = | Missed Opportunities for Vaccination |
| WHO | = | World Health Organization |
Disclosure of potential conflicts of interest
No potential conflicts of interest were disclosed.
Availability of data and materials
The data used in this paper will be available upon request from the Demographic and Health Survey Program.
Authors’ contribution
OAU and CSY conceived the study. OAU and CSY obtained funding for the study. OAU collected and analysed initial data. AAA, ABW, CSY, DN, EZS, ABW and OAU participated contributed in refining the data analysis. OAU and AAA wrote the first manuscript. AAA, ABW, CSY, DN, EZS, GB, JO, OAU, TO and SY contributed to further analysis, interpreting and shaping of the argument of the manuscript and participated in writing the final draft of the manuscript. All the authors read and approved the final manuscript.
Ethics approval and consent to participate
This study was based on an analysis of secondary survey data with all identifier information removed. The survey was approved by the Ethics Committee of the ICF Macro at Fairfax, Virginia in the USA and by the National Ethics Committees in their respective countries. All study participants gave informed consent before participation and all information was collected confidentially.
Acknowledgments
The authors are grateful to DHS Program for providing them with the survey data. Data used for this study are available upon request. Olalekan Uthman is supported by the National Institute of Health Research using Official Development Assistance (ODA) funding. The views expressed in this publication are those of the author(s) and not necessarily those of the NHS, the National Institute for Health Research.
Additional information
Funding
Related Research Data
References
- Ehreth J. The global value of vaccination. Vaccine. 2003;21:596–600.
- Wang H, Abajobir AA, Abate KH, Abbafati C, Abbas KM, Abd-Allah F, et al. Global, regional, and national under-5 mortality, adult mortality, age-specific mortality, and life expectancy, 1970–2016: a systematic analysis for the global burden of disease study, 2017. Lancet. 390(10100):1084–1150.
- McGovern ME, Canning D. Vaccination and all-cause child mortality from 1985 to 2011: global evidence from the demographic and health surveys. Am J Epidemiol. 2015;182(9):791–98. doi:10.1093/aje/kwv125.
- Griggs D, Stafford-Smith M, Gaffney O, Rockström J, Öhman MC, Shyamsundar P, Steffen W, Glaser G, Kanie N, Noble I. Policy: sustainable development goals for people and planet. Nature. 2013;495(7441):305–307.
- WHO/UNICEF. WHO/UNICEF estimates of national immunization coverage Geneva2018; 2018 [ accessed 2018 Jan 7]. http://apps.who.int/immunization_monitoring/globalsummary/timeseries/tswucoveragedtp3.html.
- World Health Organization. Pertussis vaccination: reduction of pertussis in infancy remains primary goal 2018. http://www.who.int/immunization/newsroom/news_position_paper_pertussis_vaccines/en/.
- World Health Organization (2016). “Meeting of the Strategic Advisory Group of Experts on immunization, April 2016 – conclusions and recommendations„. Weekly Epidemiological Record 91(21): 265–284.
- World Health Organization. Methodology for the assessment of missed opportunities for vaccination. Geneva (Switzerland): WHO; 2017.
- Sridhar S, Maleq N, Guillermet E, Colombini A, Gessner BD. A systematic literature review of missed opportunities for immunization in low-and middle-income countries. Vaccine. 2014;32:6870–79.
- Restrepo-Méndez MC, Barros AJ, Wong KL, Johnson HL, Pariyo G, França GV, Yin P, Liu Y, Li Y, Liu J, et al. Inequalities in full immunization coverage: trends in low-and middle-income countries. Bull World Health Organ. 2016;94(11). doi:10.2471/BLT.15.153148.
- Wagstaff A. Poverty and health sector inequalities. Bull World Health Organ. 2002;80:97–105.
- Marmot M. Social determinants of health inequalities. Lancet. 2005;365(9464):1099–104. doi:10.1016/S0140-6736(05)74234-3.
- Gwatkin DR. Health inequalities and the health of the poor: what do we know? What can we do? Bull World Health Organ. 2000;78:3–18.
- Garib Z, Vargas AL, Trumbo SP, Anthony K, Diaz-Ortega JL, Bravo-Alcántara P, Leal I, Danovaro-Holliday MC, Velandia-González M. Missed opportunities for vaccination in the dominican republic: results of an operational investigation. Biomed Res Int. 2016;2016.
- World Health Organization. State of inequality: childhood immunization. Geneva (Switzerland): World Health Organization; 2016.
- Arcaya MC, Arcaya AL, Subramanian S. Inequalities in health: definitions, concepts, and theories. Glob Health Action. 2015;8(1):27106. doi:10.3402/gha.v8.29034.
- Gwatkin DR. Trends in health inequalities in developing countries. Lancet Global Health. 2017;5(4):e371–e2. doi:10.1016/S2214-109X(17)30080-3.
- INDEPTH NETWORK. Measuring health equity in small areas: findings from demographic surveillance system. Health inequalities in the Kassena-Nankana District in Northern Ghana. England: Ashgate Publishing; 2005.
- Ndiritu M, Cowgill KD, Ismail A, Chiphatsi S, Kamau T, Fegan G, Feikin DR, Newton CR, Scott JA. Immunization coverage and risk factors for failure to immunize within the expanded programme on immunization in Kenya after introduction of new Haemophilus influenzae type b and hepatitis b virus antigens. BMC Public Health. 2006;6(1):132. doi:10.1186/1471-2458-6-132.
- Wado YD, Afework MF, Hindin MJ. Childhood vaccination in rural southwestern Ethiopia: the nexus with demographic factors and women’s autonomy. Pan Afr Med J. 2014;17:9.
- Ndirangu J, Bärnighausen T, Tanser F, Tint K, Newell M-L. Levels of childhood vaccination coverage and the impact of maternal HIV status on child vaccination status in rural KwaZulu-Natal, South Africa. Trop Med Int Health. 2009;14:1383–93.
- Munthali AC. Determinants of vaccination coverage in Malawi: evidence from the demographic and health surveys. Malawi Med J. 2007;19:79–82.
- Joshi AR. Maternal schooling and child health: preliminary analysis of the intervening mechanisms in rural Nepal. Health Transition Rev. 1994; 4(1):1–28.
- Rutstein SO, Rojas G. Guide to DHS statistics: demographic and health surveys methodology. Calverton (Maryland): ORC Macro; 2006.
- Montgomery MR, Gragnolati M, Burke KA, Paredes E. Measuring living standards with proxy variables. Demography. 2000;37:155–74.
- Vyas S, Kumaranayake L. Constructing socio-economic status indices: how to use principal components analysis. Health Policy Plann. 2006;21(6):459–68. doi:10.1093/heapol/czl029.
- Blinder AS. Wage discrimination: reduced form and structural variables. J Hum Resour. 1973; 197(8):436–55.
- Oaxaca R. Male-female wage differentials in urban labor markets. Int Econ Rev. 1973;14:693–709. doi:10.2307/2525981.
- Tu YK, Kellett M, Clerehugh V, Gilthorpe MS. Problems of correlations between explanatory variables in multiple regression analyses in the dental literature. Br Dent J. 2005;199:457–61.