
ABSTRACT
Adjuvants produce complex, but often subtle, effects on vaccine-induced immune responses that, nonetheless, play a critical role in vaccine efficacy. In-depth profiling of vaccine-induced cytokine, cellular, and antibody responses (“immunoprofiling”) combined with machine-learning holds the promise of identifying adjuvant-specific immune response characteristics that can guide rational adjuvant selection. Here, we profiled human immune responses induced by vaccines adjuvanted with two similar, clinically relevant adjuvants, AS01B and AS02A, and identified key distinguishing characteristics, or immune signatures, they imprint on vaccine-induced immunity. Samples for this side-by-side comparison were from malaria-naïve individuals who had received a recombinant malaria subunit vaccine (AMA-1) that targets the pre-erythrocytic stage of the parasite. Both adjuvant formulations contain the same immunostimulatory components, QS21 and MPL, thus this study reveals the subtle impact that adjuvant formulation has on immunogenicity. Adjuvant-mediated immune signatures were established through a two-step approach: First, we generated a broad immunoprofile (serological, functional and cellular characterization of vaccine-induced responses). Second, we integrated the immunoprofiling data and identify what combination of immune features was most clearly able to distinguish vaccine-induced responses by adjuvant using machine learning. The computational analysis revealed statistically significant differences in cellular and antibody responses between cohorts and identified a combination of immune features that was able to distinguish subjects by adjuvant with 71% accuracy. Moreover, the in-depth characterization demonstrated an unexpected induction of CD8+ T cells by the recombinant subunit vaccine, which is rare and highly relevant for future vaccine design.
Introduction
The goal of adjuvant research is to characterize the type of immune responses that different adjuvants and adjuvant formulations generate to enable rationale vaccine design whereby antigens are matched with optimal adjuvants. Comparisons, especially in humans, between clinically relevant adjuvants that are already in licensed products are rare. To gain useful insights into the immune signatures induced by adjuvants, it is necessary to perform immunoprofiling by collecting the broadest possible range of immune measures. Vaccine evaluations have traditionally been restricted to relatively simple readouts such as antibody titers and basic T cell analyses such as cytokine-ELISpot or the assessment of the presence and frequency of poly-functional T cells producing IFN-γ, IL-2, and/or TNF-α. While a useful starting point, these efforts have largely failed to predict vaccine efficacy or assist in the down-selection of vaccine formulations.Citation1-Citation3 Surrogate markers or immune correlates of protection remain elusive for most vaccines and diseasesCitation4 and uncovering these parameters could greatly assist in vaccine design and development. It is clear that a comprehensive understanding of vaccine-induced immunity is necessary but collecting and analyzing complex immune data sets poses a number of technical and analytical challenges.
Previously, we combined immunoprofiling with multivariate analysis to collect and analyze serological and functional antibody data from the clinical evaluation of a CSP-based malaria vaccine.Citation5,Citation6 Using serum samples collected from vaccinees of the RTS,S malaria vaccine, we used univariate analyses to identify a negative association between antigen-specific phagocytic activity and protection.Citation6 We then carried out complex immunoprofiling of serological measurements followed by linear regression analysis which identified key serological determinants of phagocytic activity,Citation7,Citation8 tying IgG4 antibody levels to phagocytic activity and vaccine efficacy. A subsequent, even more comprehensive immunoprofiling study of cellular and antibody responses in a non-human primate (NHP) model was based on 120 antigen-specific immune measurements (cellular and serological) across multiple lymphoid organs (liver, spleen, and vaccination site draining lymph nodes) in addition to peripheral blood.Citation9 Because size and complexity of the data set was beyond the scope of most regression-based methods, we turned to machine learning to identify what combination of immune features most clearly distinguished vaccinees by adjuvant formulation. We identified a combination of immune features (an ‘immune signature’) capable of distinguishing between vaccine-induced responses by adjuvant with 92% accuracy, and which provided a basis for rational adjuvant selection and formulation.
Our immunoprofiling studies with various vaccines and adjuvants yielded two key observations: First, vaccines elicit a wide range of immune responses that are often unexpected, yet critical for efficacy. This suggests that a targeted approach to assessing immunity based on a priori expectations of what immune responses are essential is likely to miss important correlates of protection and, thus, fail to provide insights into immune mechanisms responsible for vaccine efficacy. Second, immune correlates associated with adjuvant selection or protective status are often complex and multivariate, resulting from the coordination of a wide array of antigen-induced immune factors and cells. As such, the expectation of simple univariate measures as a correlate of protection is often unrealistic. In short, effective assessment of vaccine-induced immunity requires both an unbiased, comprehensive profile of immune responses, and data analysis methods, such as machine learning or regression analysis, that are able to simultaneously capture the combinatorial effects of multiple immune responses.
The AS01 adjuvant system has a strong track record of generating efficacious vaccine responses. Most recently, the tuberculosis vaccine M72/AS01E has demonstrated, for the first time, that a soluble protein vaccine can elicit a protective response against TB.Citation10 Similarly, AS01B has greatly increased the efficacy of the malaria vaccine Mosquirix (RTS,S).Citation11,Citation12 A highly efficacious shingles vaccine (Shingrix) that utilizes AS01 was licensed in the US in 2017. AS02 contains the same immunostimulatory components, the saponin QS21 and the LPS-derived TLR4 agonist 3-O-desacyl-4ʹ-monophosphory lipid A (MPL), but is formulated very differently: the same amounts of these molecules are delivered through a liposome in AS01B, but as an oil-in-water formulation in AS02A. The present study sought to establish the immunoprofile of responses induced by a recombinant Plasmodium falciparum Apical Membrane Antigen (AMA)-1 (3D7) vaccine (FMP2.1) adjuvanted with either AS01B or AS02A in a clinical Phase I/IIa trial.Citation13 AMA-1 is expressed during pre-erythrocytic and erythrocytic stages of the malaria parasite and has, therefore, been evaluated for its potential to mediate protection against infection and disease. Vaccinees were infected with malaria by mosquito bite and, despite the lack of sustained sterile immunity, significant differences in the parasite density were observed in the FMP2.1/AS02A vaccinated study participants. Follow-up studies of the vaccine focused on the FMP2.1/AS02A formulation in malaria-endemic populations in Mali where it displayed strain-specific efficacy.Citation14-Citation16 The vaccine induced strong cellular (CD4+ T cell)Citation17 and humoralCitation12,Citation14,Citation16 responses in both, malaria-naïveCitation13 and malaria-experiencedCitation12,Citation14-Citation17 vaccinees.
The availability of parasitological data and biological effects made these trial samples a logical choice for establishing immunoprofiles and subsequent computational modeling. The objective of this study was to determine whether computational analysis can identify adjuvant-specific immune signatures for AS01B and/or AS02A in humans, identify immune measures associated with vaccine efficacy, and determine the effect of adjuvant formulation on vaccine-induced immune responses.
Immunoprofiling was achieved by collecting 40 unique immune measures that characterized the serological responses (i.e., antibody titers and functional activity (i.e., growth- inhibition) in immune sera) and cellular responses (i.e., frequency and phenotyping of antigen-specific B cells, CD4+ and CD8+ T cell subsets, antigen-specific cytokine profiles of ex vivo stimulated PBMC). These parameters were then integrated with parasitological outcomes (i.e., pre-patent period and parasite density) after sporozoite challenge. The results revealed a large overlap in the immune signatures of AS01B and AS02A, which was anticipated since the two formulations contain the same immunostimulators. However, they also uncovered several significant differences: AS01B mediates higher antibody responses at earlier time points while AS02A promotes higher frequencies of antigen-specific CD8+ T cell (especially within the CCR6+ subset) and TFH17 circulating follicular T helper cells. Using machine learning, AS01B and AS02A data sets were used to train the Random Forest Model to determine whether unique immune signatures could be established for the two adjuvants. Despite an overlap, a fairly accurate prediction of which cohort samples came from could be achieved based on their immune profile thus validating an approach that had previously only been applied to preclinical sample sets.Citation9 Moreover, immune measures that had previously been considered to be associated with vaccine efficacy, such as the parasite growth inhibition assay (GIA), were surprisingly not associated with parasitological outcome demonstrating the power of this approach for identifying biomarkers of vaccination and/or protection. Most importantly, insights into the interplay between antigen-specific CD4+ and CD8+ T cell subsets were revealed.
Materials and methods
Study samples
Samples for this study, i.e., sera and PBMC, were collected under a clinical protocol (www.clinicaltrials.gov NCT00385047)Citation13 from participants immunized with 50 µg/ml AMA-1 adjuvanted with either AS01B (n = 14 subjects) or AS02A (n = 14 subjects). The vaccine formulations as well as the details on stability, ratio antigen-to-adjuvant have been described previously.Citation13 Briefly, 50 µg AMA-1 were formulated in 0.5 ml of adjuvant system and injected intramuscularly. Vaccinees received three doses in four-week intervals in alternate arms.
ELISA
Sera were collected from each study participant at Day 0, 14, 28, 42, 56, 70, 93, 114 and 156 and tested as described previously. Briefly, sera were tested against the vaccine antigen (FMP2.1)Citation18 in a standardized, qualified ELISA assay performed at the WRAIR Malaria Serology Laboratory, an international reference center. The serological data used for the multi-variant analyses and machine learning are the original data set.Citation13
Growth inhibition assay
Sera from pre-immune and pre-challenge time points were tested using a high-throughput method based on the detection of parasitic lactate dehydrogenase (pLDH) as described previously.Citation19 The GIA data used for the multi-variant analyses and machine learning are the original data set.Citation13
B cell ELISpot
Human B cell responses were measured using ELISpot assay kits (Mabtech Inc, Cincinnati, OH) following the manufacturer’s instructions. Thawed PBMCs were stimulated with 1 µg/mL R848 and 10 ng/ml recombinant human IL-2 in culture medium (RPMI-1640 containing 10% fetal bovine serum, Pen/Strep, L-glutamine, NEAA, Sodium Pyruvate, 2-mercaptoethanol) for 36 hrs. ELISpot plates were coated with recombinant PfAMA-1 (3D7) or anti-IgG monoclonal antibody MT91 (positive control to capture all secreted IgG). Prior to plating, B cells were purified by magnetic enrichment using CD19 microbeads (Miltenyi Biotec, San Diego, CA) following the manufacturer’s instructions. Enriched cells were plated at a concentration of 5 × 10⁴ cells/well. ELISpot plates were analyzed using the AID Autoimmun Diagnostika GmbH ELISpot reader (Strassberg, Germany) and software. The values of the positive assay control (MT91) (i.e. the frequency of activated B cells in PBMC) confirmed that the viability and functionality of the PBMC was not diminished despite being stored in liquid nitrogen for 10 years.
Flow cytometric analysis
Cryopreserved PBMCs from the pre-immune and pre-challenge (14 days post 3rd vaccination) time points were incubated with an AMA-1 peptide pool (15-mer peptides overlapping by 11 AA representing the AMA-1 (3D7) vaccine antigen) at 1.25 µg/mL final concentration, or media alone (control stimulation). Cells were cultured for 16 hours (37°C, 5% CO2) in complete medium (RPMI-1640 (Life Technologies, Waltham, MA) containing 10% human serum (Gemini Bio-Products, West Sacramento, CA)) at a concentration of 5 × 10⁶ cells/mL. Anti-human CCR6-APC (REA190) and CD40 (HB14) were added to the culture at a 1:10 and 1:100 dilution, respectively. Following stimulation, cells were washed and stained with anti-human CD154-biotin (5C8) for 15 minutes at 4°C in FACS solution (0.5% human serum and 0.1% sodium azide in PBS). Cells were further incubated with anti-biotin microbeads (Ultrapure, Miltenyi Biotec) for 15 minutes at 4°C. After washing, an antibody cocktail with fluorochrome-conjugated antibodies against CD3-VioBlue (BW264/56), CD4-PerCPVio700 (M-T466), CD185-PEVio770 (REA103), CD183-VioBrightFITC (REA232), CD154-PE (5C8) and Zombie Aqua Fixable dye (BioLegend, San Diego, CA) was added and incubated for 45 minutes at 4°C. All monoclonal antibodies for cell culture and analysis were purchased from Miltenyi Biotec. Cells were enriched and acquired on a MACSQuant Analyzer 10 as previously described.Citation20,Citation21 Cell viability of thawed PBMC was > 92% as measured by a Luna-FL™ Dual Fluorescence cell counter (fluorescence protocol with AO/PI to determine cell viability). Viability of the cells after overnight stimulation and staining was >84% which is the observed range, in our laboratory, for younger cryopreserved as well as freshly acquired PBMC. Lymphocytes were first gated by scatter, then for viability, and the lineage marker CD3 (Suppl. Figures 1 and 2). Enriched antigen-specific cells were gated based on the co-expression of CD4 or CD8 with CD154. Subsequent gating for CD4+CXCR5+ TFH subsets was done based on the expression of CCR6 and CXCR3 to identify THF1, TFH2, and TFH17 cells. Subsequent gating of CD8+CD154+ was also done based on CCR6 (Tc17) and CXCR3 (Tc1) expression. Flow cytometric data were analyzed using FlowJo V10 (Treestar, Ashland, OR).
Mesoscale analysis
Cryopreserved PBMCs from each study subject from time points Day 0 and Day 28 days post immunization were stimulated with an AMA-1 peptide pool media, or anti-CD3. Cell viability of thawed PBMC was > 92% as measured by a Luna-FL™ Dual Fluorescence cell counter (fluorescence protocol with AO/PI to determine cell viability). The Mesoscale Discovery’s 10-plex human pro-inflammatory panel kit (IL-1β, IL-8, IL-2, IL-4, IL-6, IL-10, IL-12p70, IL-13, IFN-γ, TNF-α) was used to analyze culture supernatants according to the manufacturer’s protocol. Plates were read on a QuickPlex SQ120 (Mesoscale, Gaithersburg, MD). Cytokine levels induced by anti-CD3 stimulation fell within the range of younger cryopreserved as well as freshly obtained PBMC indicating that long-term storage did not impact the functionality of the cells.
Computational analysis
We integrated the data across assays by subject and carried out a univariate analysis, comparing each immune response to its pre-immune reference point, at the group level, to identify the subset of immune responses that are vaccine-induced. With those data, we carried out a univariate analysis between subjects from the AS01B and AS02A cohorts to identify adjuvant-level differences at the cohort-level. Finally, we used machine learning to determine how well we could distinguish between subjects from the cohorts, and what multi-factorial combination of immune factors was most responsible for making this distinction. We also used machine learning to determine if the immune data could be used to distinguish subjects by parasitological outcome (delayed parasitemia vs. normal parasitemia). An overview of all measurements and time points is in Supplementary Table 1.
Univariate analysis
To determine which immune responses showed vaccine-induced changes, univariate analysis for each immune measure was carried out, comparing pre-immune vs. post-immune responses with both adjuvant groups pooled together. If normally distributed, as determined by Shapiro-Wilks tests, paired Student’s t-tests were used to calculate statistical significance. If not normally distributed, the Wilcoxon signed-rank test was applied. After calculating p-values for immune parameters in the data sets, a correction for multiple comparisons was made (resulting in a corrected p-value) using the Benjamini-Hochberg correction.Citation22 Immune measures in which comparison to the pre-immune data showed a significant difference at p < .05 and a false discovery rate of q < 0.20 were classified as vaccine-induced immune responses.
To determine group-level differences with respect to adjuvant, we carried out Student’s t-tests or Wilcoxon signed-rank tests between the two adjuvant groups (AS01B vs. AS02A), for all immune measures that were determined to be vaccine-induced. After calculating p-values for each vaccine-induced immune parameter, we accounted for multiple comparisons by using the Benjamini-Hochberg correction. Vaccine-induced immune measures that showed a significant difference between AS01B and AS02A subjects at p < .05 and q < 0.20 were classified as adjuvant-specific differences.
ELISA data were collected at eight time points for each subject and we used a linear mixed model to model them (response variable) as a function of time point and adjuvant (explanatory variables with fixed effects), and subject (explanatory variable with random effects) allowing for an interaction between time point and adjuvant. We used the lmer function within the lme4 package in R with the following formula: log(ELISA) = Time Point * Cohort + (1 | Subject). Fixed effects were evaluated with respect to Time point 0 (pre-immune) as the reference group. Planned contrasts were made across all time points and between cohorts within each time point. We used the lmerTest package in R to generate p-values for the linear mixed model analysis.
Multivariate analysis and machine learning
Correlation matrices for the data set were generated by calculating the Spearman correlation coefficient between all immune measures. Spearman’s ρ statistic was used to calculate p-values for each correlation estimate. Only correlation coefficients with p < .05 were retained for further analysis to ensure that only high-confidence correlations were used in subsequent analyses; all others were set to ‘0ʹ. Hierarchical clustering (R package hclust function) was used to group correlated immune measures and to define immune clusters based on a cutoff criterion of having a correlation coefficient of at least 0.40, using the cutree function. A dendrogram of the hierarchical cluster was generated using the A2Rplot function in R package addicted.
Representative immune measures from the 11 largest clusters (representing 92% of all vaccine-induced immune responses) containing at least one vaccine-induced immune measure were used for additional analyses. Principal component analysis (PCA) was performed on these representative immune measures, using the R function ir.pca to separate subjects with respect to adjuvant (AS01B, AS02A) or parasitological outcome (delayed parasitemia vs. normal parasitemia). Using the R package ggbiplot, the first two principal components were visualized as two- dimensional PCA plots.
For the random forest model (based on the R caret package) we used all vaccine-induced immune responses (26 parameters) to predict adjuvant status (AS01B vs. AS02A) for all subjects in the study (n = 28). The model was trained using the repeated cv method, subsampling the data set by 5-fold and resampling ten times. To test the predictive accuracy of the random forest modeling approach, a leave-one-out analysis was carried out, where one subject was removed from the data set, after which the model was trained on the remaining subjects and then used to predict the adjuvant condition of the excluded subject based on its immune data. This analysis was performed for all subjects in the data set, and calculated both the accuracy and kappa value of the prediction model. The varImp function was used to determine the variable importance for each generated model, and the average variable importance across all models was reported to assess the relative importance of each vaccine-induced immune measure to predicting the adjuvant condition.
Results
Immunoprofiling of vaccine-induced responses reveals distinct response patterns
The interactions between various immune measures induced by vaccination were determined through a correlation matrix (). As expected, all serological measurements correlated positively with each other at all time points. Pre-challenge (T5), the magnitude of the serological response correlated significantly with the functional activity measured in growth-inhibition assays (GIA). The correlations between serological responses and cytokines revealed previously unknown associations: the magnitude of the serological response correlated with TNF-α and IFN-γ only at early time points, but pre-challenge, the serological response correlated with IL-10. The positive correlations between the frequency of antigen-specific B cells and TFH17 T cells as well as the correlation between TNF-α and IFN-γ indicate a bias toward a Th1-type immune response. Additional positive correlations between cytokine secretion patterns were found between IL-2 and IL-13 suggesting that the T cell response is accompanied by the presence of an anti-inflammatory responseCitation23 as well as between IFN-γ, TNF-α, and IL1β, suggesting support for the expansion and differentiation of Th2-cells.Citation24
Figure 1. Correlation matrix of all collected immune measures. Serological (Sero), cytokine (Cyto), B cell ELISPOT (BELI), and T cell flow cytometry (TFC) measures are shown. Pearson correlation coefficient is shown from −1 (red) to 1 (blue). Only correlations with statistical significance of p < .05 are shown. Notable correlation clusters are highlight for positive (red) and negative (blue) interactions.
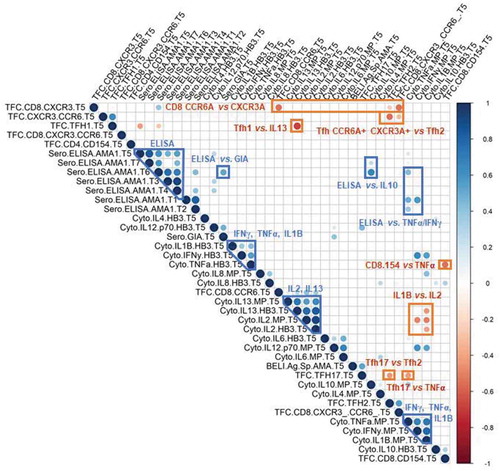
Similarly, the negative correlations we identified indicate polarizing immune interactions: (1) the frequency of antigen-specific TFH17 vs. TFH2 cells; (2) the frequency of antigen-specific CD4+ CCR6+CXCR3+ T cells vs. TFH2 cells; (3) the frequency of antigen-specific CD8+ CCR6+Citation25 vs. CD8+ CXCR3+ cells;Citation26 (4) the frequency of antigen-specific TFH1 with IL-13 and the magnitude of the serological response at the pre-challenge time point; (5) the frequency of antigen-specific TFH17 cells with TNF-α produced by PBMC in response to antigenic stimulation; and (6) the magnitude of the IL1β response vs. IL-2 response by PBMC in response to antigenic stimulation. The latter suggests that the T cell response occurs in the absence of strong inflammation.
Hierarchical clustering of vaccine-induced responses to decipher vaccine- vs. adjuvant-affected immune responses
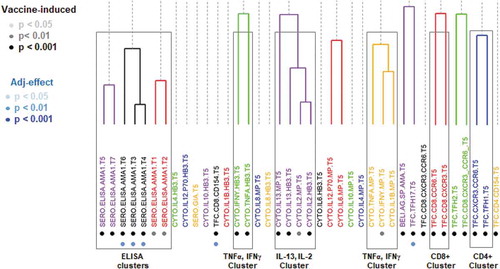
Vaccine-induced immune responses were identified through univariate analyses of all immune measures (). The main vaccine-induced clusters are the serological (“ELISA”) responses and cytokine clusters (i.e., IL-13, IL-2 and IFN-γ, TNF-α). Only TNF-α responses after antigenic stimulation of PBMC reached borderline statistical significance when comparing the two adjuvant groups (p = .09, paired T-test; AS01B>AS02A). The evaluation of the clusters regarding differences in the responses based on the adjuvant formulation showed that the differences between AS01B and AS02A were at the level of serological responses, the frequency of antigen-specific CD8+ T cells, and antigen-specific CD4+ TFH17 cells.
Figure 2. Hierarchical clustering of all immune measurements. Clusters were defined by a cutoff of a Pearson correlation coefficient of 0.60 and are color-coded. Immune measures that are classified as ‘vaccine-induced’ are highlighted with light, medium, and dark gray, corresponding to statistical significance (vs. pre-immune). Immune measures that are classified as showing adjuvant-specific differences are shown in light, medium, and dark blue based on its statistical significance (AS01B vs. AS01A).
Vaccine-induced cytokine responses
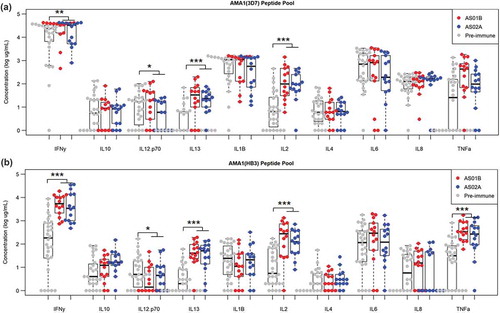
Cytokine responses were profiled using the Mesoscale Diagnostics assay platform (). Culture supernatants of PBMC were tested after ex vivo stimulation with allele specific AMA-1 peptide pools or controls. Comparing the two different AMA-1 pools revealed a strong cross-reactivity between two alleles of the AMA-1, namely 3D7 and HB3 at the T cell level. The profile of vaccine-induced responses was comprised of IFN-γ, IL-13, IL-2, and TNF-α for both, the homologous (3D7) as well as the heterologous response (HB3). There was no significant difference in the cytokine profile induced by AS01B vs. AS02A.
Figure 3. Cytokine concentration following ex vivo stimulation by allele-specific AMA-1 peptide pools. Cytokine concentrations following stimulation by AMA1 (3D7) peptide pool (a) and AMA1 (HB3) peptide pool (b) for pre-immune (gray) samples and AS01B and AS02A vaccinees (red and blue, respectively) collected at the pre-challenge time point. Vaccine-induced differences (vs. pre-immune) are shown in black, adjuvant-specific differences (AS01B vs. AS02A) are shown in magenta (* p < .05, ** p < .01, *** p < .001).
Differences in the adjuvant groups at the level of CD4+ T cells
Antigen-specific CD4+ T cells were identified by the expression of CD154 after antigen stimulation.Citation27,Citation28 We focused on measuring the frequencies of TFH subsets based on their role in inducing and maintaining humoral responses (reviewed inCitation29). In humans, circulating TFH cells have been described as reliable surrogates of lymphoid organ-resident TFH.Citation30 These CD4+ CXCR5+ cTFH are classified based on the expression of additional cell surface markers as TFH1 (CXCR3+), TFH2 (CXCR3−CCR6−), or TFH17 (CCR6+). While the role of TFH2 and TFH17 cells is to support the activation of antigen-specific B cells and germinal center reactions,Citation30,Citation31 the role of TFH1 cells has been more elusive: one study suggests that the frequency of antigen-specific TFH1 was associated with Influenza-specific neutralizing antibody titers and, hence, vaccine efficacy,Citation32 while in vitro co-culture experiments showed that TFH1 do not support B cell activation and differentiation.Citation30
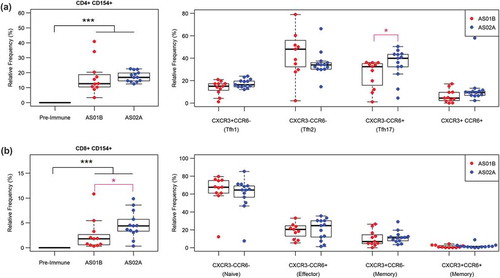
While all changes in the frequencies of antigen-specific CD4+ T cells and, in particular, CD4+CXCR5+ T cells are vaccine-induced in our study, the only difference between the two adjuvant formulations was in the TFH17 (CD4+ CXCR5+CCR6+) cell subset (). The trend toward higher TFH1 and CXCR3+CCR6+ T cells in the AS02A group was not statistically significant. Notably, we observed a significant correlation between the frequency of AMA-1 specific B cells and AMA-1 specific TFH17 (p < .05).
Figure 4. Vaccine-induced and adjuvant-specific immune responses for Tfh CD4+ and CD8+ cells. (a) Relative frequency of activated Tfh cells (CD154+ CXCR5+) and the relative frequency of TFH1, TFH2, TFH17 subsets of the TFH population. (b) Relative frequency of activated CD8+ T cells and the relative frequency of naïve, effector, and memory subsets of the activated CD8+ T cell population. Vaccine-induced differences (vs. pre-immune) are shown in black; adjuvant-specific differences (AS01B vs. AS02A) are shown in magenta (* p < .05, ** p < .01, *** p < .001).
Differences in the frequency of antigen-specific CD8+ T cells between the adjuvant groups
Antigen-specific CD8+ T cell were characterized based on the expression of the activation marker CD154.Citation33,Citation34 CD8+ effector and memory cells were identified based on the expression of CXCR3 and CCR6.Citation35,Citation36 Both markers are associated with memory T cells; CXCR3+ CD8+ T cells have been described as long-lived effector and memory T cells.Citation37 The co-expression of both markers is associated with short-lived effector memory T cellsCitation26 migrating to tissues, including homing to the liver,Citation38,Citation39 which may be represent an important immune defense strategy against liver-resident malaria parasite when antibodies failed to neutralize the parasite. While all responses in the various CD8+ T cell subsets were vaccine-induced, the only significant difference between the two adjuvants groups was observed in the overall frequency of antigen-specific CD8+CD154+ T cells ().
Adjuvant-induced differences in the magnitude of the humoral immune response
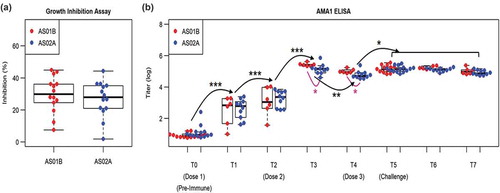
Antibody-mediated growth inhibition pre-challenge was not significantly different between the AS01B and AS02A cohorts (). A linear mixed model analysis of the repeated ELISA measures across eight time points in the study revealed a significant effect of the time point on the ELISA data (p < 10–5) and a significant interaction between adjuvant and time point T3 and T4 (p < .1). Using planned comparisons between time points and between cohorts within each time point we observed that antibody titers increase monotonically from T0 to T3 (p < 10–3), decreased from T3 to T4 (p < .01), and then increased following Dose 3 (T5), before leveling off (T6 and T7). AS01B induced higher antibody responses than AS02A (p < .05) following Dose 2 (T3 and T4), but both adjuvants showed similar Ab titers following Dose 3 (T5, T6, and T7). These results provide two findings: 1) the AS01B adjuvant is able to mount Ab responses at post-Dose 2 that the AS02A adjuvant does not reach until after Dose 3. 2) for both adjuvants, while the peak Ab response following Dose 2 and Dose 3 is comparable, the post-Dose 2 Ab response is characterized by a decay in Ab titers at 4-weeks post-Dose 2, while post-Dose 3 Ab responses are maintained beyond four weeks and persist through the post-challenge period.
Figure 5. Vaccine-induced and adjuvant-specific immune responses in antibody responses. (a) Growth inhibition assay for AS01B and AS02A adjuvanted vaccine-induced antibody responses. (b) ELISA assay using recombinant AMA1 antigen across time points from pre-immune (T0) to post-challenge (T7). Linear mixed model was used to assess time point-specific (black) and adjuvant-specific (magenta) effects. Selected pair-wise comparisons between time points and adjuvant conditions are shown using curved lines with corresponding p-values (* p < .05; ** p < .01; *** p < 10−3 ***).
Principal component analysis of vaccine induced immune responses to establish adjuvant-specific immune signatures
To detect any systematic difference in vaccine-induced immune responses in the AS01B- and AS02A-cohorts, we carried out principal component analysis (PCA) using representative immune measures from each immune cluster identified from hierarchical clustering (). These 11 representative parameters () collectively represent 92% of all the immune measures that were classified as vaccine-induced based on the univariate analysis.
Table 1. Representative parameters for PCA.
Comparing the 11 representative parameters for the two cohorts using PCA () shows that the adjuvants induce largely overlapping immune responses. Although univariate analyses identified several adjuvant-specific differences in vaccine-induced immune responses, such as higher antibody levels at earlier time points (AS01A), and higher frequencies of antigen-specific CD8+ T cells (AS02A), these differences were exceptions.
Figure 6. Principal component analysis (PCA) for vaccine-induced responses. (a) PCA plot for representative parameters for all vaccine-induced responses, summarized in . Vectors corresponding to each measure are shown. Points are labeled for AS01B vaccinees (pink) and AS02A vaccinees (blue). (b) PCA plot for parameters identified using machine learning to have predictive value in distinguishing AS01B and AS02A vaccinees.
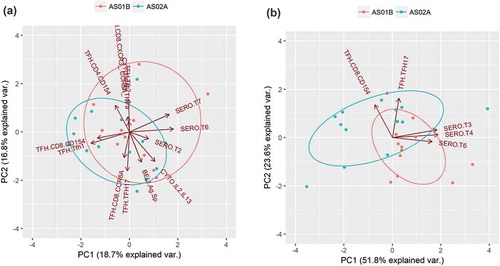
Overall, there was little systematic difference between the two adjuvants, meaning that variations in immune responses between individuals was substantially greater than the systematic difference in immune responses mediated by AS01B vs. AS02A. This finding highlights the major challenge in assessing adjuvant specific-effects – that these effects, while sometimes critical for vaccine efficacy,Citation14,Citation16 often manifest themselves as subtle differences in vaccine-induced immune responses that are not readily apparent from group-level analyses.
Multivariate analysis using all vaccine-induced parameters to generate a predictive model for adjuvant use
Given the limitations of identifying adjuvant-specific effects from group-level analyses of vaccine-induced immune responses, we used machine learning to carry out an individualized assessment of adjuvant-specific effects. With the Random Forest Model, we made individualized predictions of whether vaccinees received AS01B or AS02A adjuvanted vaccine based on 26 immune parameters that were classified as vaccine-induced in the univariate analysis, and trained the model with 28 subjects. We assessed model accuracy using the leave-one-out method, whereby a training set is created using all but one subject, and then the model predicts the adjuvant condition for the excluded subject. Despite the large overlap in immune responses, the model was able to predict cohort-membership with 71% accuracy (κ = 0.42, p = .02).
Next, we determined what parameters in the model were most responsible for model accuracy with a variable importance analysis. Four parameters were mainly responsible for predictive accuracy: antigen-specific antibody titers at two time points, frequency of antigen-specific TFH17 cells, and activated antigen-specific CD8+ cells (). PCA analysis with these four parameters () showed that vaccinees were clearly distinguishable by adjuvant when using this subset of parameters. Furthermore, two components alone were able to capture over 70% of the variation in the data set, suggesting that despite the large overlap in vaccine-induced immune responses, this machine learning approach was able to isolate a subset of adjuvant-specific immune responses.
Table 2. Predictive parameters for modeling adjuvant effects.
Relationship between parasitological outcomes and immunological responses
Measures of parasitological outcomes (i.e., pre-patent period between challenge and parasite detection using blood smears) of the Phase IIa trial samples were analyzed to determine differences between unvaccinated challenge controls and vaccinees receiving either vaccine formulation (Suppl. Figure S3). There was a notable anti-parasite response in vaccinated study participants, and it was stronger in recipients of the FMP2.1/AS02A formulation. Next, the 26 immune measures were integrated with the parasitological data and used to train the algorithm to predict the protective status of the vaccine recipients. The resulting computer model was not able to predict the protective status with sufficient accuracy (accuracy: 56%; κ = 0.12, p = .60). Thus, we conclude that for this vaccine the reported immune measures should be considered immunogenicity markers rather than immune correlates of protection.
Discussion
Comparative studies of human immunoprofiles induced by adjuvants are rare, mainly because of the proprietary nature of late-stage adjuvants. Thus, insights into adjuvant-mediated immune responses are mostly derived from clinical studies in which adjuvants were used for different vaccines, and which differed in schedule and readout methods. These differences make it virtually impossible to determine the differential contribution of adjuvants to vaccine-immunogenicity and efficacy. Furthermore, in many vaccine trials, a limited number of immunological parameters is collected. Establishing immune signatures for adjuvants in comparative trials will greatly enhance our understanding of adjuvants and guide their selection. Here, we describe the immune signatures of two adjuvant formulations containing the same amount of the same immunostimulatory components, but formulated differently: in AS02A, MPL and QS21 are delivered through an oil-in-water emulsion, while AS01B is a liposomal formulation. Differences in the immune signatures induced by the same antigen delivered with the same immunostimulatory molecules would thus be the result of formulation, here an emulsion versus liposomes. Adjuvant formulation represents one of the least appreciated and investigated aspect of vaccine development and our study highlights how this seemingly minor difference in formulations can affect a vaccine’s immune profile.
We utilized samples and data from a clinical adjuvant-comparison trial involving AMA-1, a promising malaria vaccine candidate that showed parasitological efficacy in challenged, previously malaria-naïve individualsCitation13 when formulated with AS02A. In a subsequent field trial, FMP2.1 reduced parasite burden in adults and children in a malaria-endemic area in Mali,Citation14-Citation16 although efficacy was limited to parasites with genetically similar AMA-1 as the allele in the vaccine.
The present study yielded several key observations in addition to producing a computational model that characterizes the immune signature of emulsions vs. liposomal adjuvants containing MPL and QS21:
AMA-1 antibody titers at early vaccination time points correlated with TNF-α and IFN-γ secretion by antigen specific T cells demonstrating a bias toward Th1 type responses and the induction of cytophilic antibodies; Ig-titers at later time points (pre- and post-challenge) correlated with functional anti-parasite activity (measured by GIA) and IL-10. IL-10 has been shown to act as a growth and differentiation factor for B cells in humans,Citation40,Citation41 but could also indicate immunomodulation.Citation42,Citation43
Both adjuvants mediate a strong bias of the vaccine-induced immune response toward a Th1/Th17 type profile and are able to induce AMA-1 specific CD8+ T cells as well as AMA-1 specific TFH1 and TFH17 CD4+ T cells. The presence of CD8+ T cells was surprising since recombinant proteins are inherently poor inducers of this T cell subset, particularly in humans. We also found a correlation between the frequencies of AMA-1 specific B cells and TFH17 cells (). Further indication of a bias toward cellular responses is the negative correlation between TFH17 and TFH2 ().
AS01B and AS02A have a largely overlapping immune signature, which is not surprising considering that they contain the same immunostimulatory molecules. However, AS01B induces higher antibody titers while AS02A promotes higher frequencies of TFH17 and CD154+CD8+ T cells (), contradicting the highly simplistic hypothesis that AS02A would support a stronger antibody response, presumably more important for the AMA-1 vaccine, while AS01B would support stronger cellular responses.
Although univariate analysis was able to identify several group-level differences between AS01B and AS02A, multivariate PCA confirmed that, overall, there was little systematic difference in vaccine-induced immune responses. This indicated that variation in immune responses between individuals was significantly greater than differences in immune responses elicited by the adjuvant. However, we were able to use a machine learning approach to make an individualized prediction about which adjuvant a particular subject had received based on immune data selected by the algorithm.
Comparing comprehensive immune profiles induced by a novel malaria vaccine, delivered with two different, but related, adjuvants, has provided novel and unique insights into the important effects of adjuvant formulation on vaccine immunogenicity. The study also highlights the significant impact adjuvant formulation, beyond simply the nature of the immunostimulatory components, has on vaccine-induced antigen-specific responses. A limitation of the present study is its inability to identify biomarkers of reactogenicity, which would require a significantly larger dataset. The BIOVACSAFE project was the first of its kind that aimed to integrate available safety data as well as “omics” data from a wide range of preclinical and clinical vaccine trials to determine such biomarkers through system vaccinology.Citation44 When provided with an appropriate data set, the approach described here can also be used to gain insights into what immune profiles are associated with reactogenicity in an attempt to further improve the safety of vaccines.
Author Contributions
SC performed the data analysis and the computational portion of the work, EHD performed the flow cytometric analysis and cytokine array experiments, TA performed the Fluorospot analysis, SD and MDS provided critical reagents and edited the manuscript, WL provided critical expertise on adjuvants and composed the discussion section, EB-L designed the immunoprofiling experiments and compiled the manuscript. All authors read and approved the final manuscript.
Disclosure of potential conflicts of interest
No potential conflicts of interest were disclosed.
Supplemental Material
Download MS Word (303.4 KB)Acknowledgments
The authors would like to thank Dr. Kevin Beck for his expertise on specialized flow cytometry and Drs. Schuerman and Coccia (GlaxoSmithKline Belgium) for critical review of the manuscript. Material has been reviewed by the Walter Reed Army Institute of Research. There is no objection to its presentation and/or publication. The opinions or assertions contained herein are the private views of the authors, and are not to be construed as official, or as reflecting the views of the Department of the Army or the Department of Defense or the National Institutes of Health. This paper has been approved for public release with unlimited distribution. The investigators have adhered to the policies for protection of human subjects as prescribed in AR 70-25.
Additional information
Funding
References
- Seder RA, Chang LJ, Enama ME, Zephir KL, Sarwar UN, Gordon IJ, Holman LA, James ER, Billingsley PF, Gunasekera A, et al. Protection against malaria by intravenous immunization with a nonreplicating sporozoite vaccine. Science. 2013;341:1359–65.
- Tamminga C, Sedegah M, Maiolatesi S, Fedders C, Reyes S, Reyes A, Vasquez C, Alcorta Y, Chuang I, Spring M, et al. Human adenovirus 5-vectored Plasmodium falciparum NMRC-M3V-Ad-PfCA vaccine encoding CSP and AMA1 is safe, well-tolerated and immunogenic but does not protect against controlled human malaria infection. Hum Vaccin Immunother. 2013;9:2165–77. doi:10.4161/hv.24941.
- Tamminga C, Sedegah M, Regis D, Chuang I, Epstein JE, Spring M, Mendoza-Silveiras J, McGrath S, Maiolatesi S, Reyes S, et al. Adenovirus-5-vectored P. falciparum vaccine expressing CSP and AMA1. Part B: safety, immunogenicity and protective efficacy of the CSP component. PLoS One. 2011;6:e25868. doi:10.1371/journal.pone.0025868.
- Plotkin SA. Correlates of protection induced by vaccination. Clin Vaccin Immunol. 2010;17:1055–65. doi:10.1128/CVI.00131-10.
- Regules JA, Cicatelli SB, Bennett JW, Paolino KM, Twomey PS, Moon JE, Kathcart AK, Hauns KD, Komisar JL, Qabar AN, et al. Fractional third and fourth dose of RTS,S/AS01 malaria candidate vaccine: a phase 2a controlled human malaria parasite infection and immunogenicity study. J Infect Dis. 2016;214:762–71. doi:10.1093/infdis/jiw237.
- Stoute JA, Slaoui M, Heppner DG, Momin P, Kester KE, Desmons P, Wellde BT, Garçon N, Krzych U, Marchand M. A preliminary evaluation of a recombinant circumsporozoite protein vaccine against Plasmodium falciparum malaria. RTS,S malaria vaccine evaluation group. N Engl J Med. 1997;336:86–91. doi:10.1056/NEJM199701093360202.
- Chaudhury S, Ockenhouse CF, Regules JA, Dutta S, Wallqvist A, Jongert E, Waters NC, Lemiale F, Bergmann-Leitner E. The biological function of antibodies induced by the RTS,S/AS01 malaria vaccine candidate is determined by their fine specificity. Malar J. 2016;15:301. doi:10.1186/s12936-016-1348-9.
- Chaudhury S, Regules JA, Darko CA, Dutta S, Wallqvist A, Waters NC, Jongert E, Lemiale F, Bergmann-Leitner ES. Delayed fractional dose regimen of the RTS,S/AS01 malaria vaccine candidate enhances an IgG4 response that inhibits serum opsonophagocytosis. Sci Rep. 2017;7:7998. doi:10.1038/s41598-017-08526-5.
- Chaudhury S, Duncan EH, Atre T, Storme CK, Beck K, Kaba SA, Lanar DE, Bergmann-Leitner ES. Identification of immune signatures of novel adjuvant formulations using machine learning. Sci Rep. 2018;8:17508. doi:10.1038/s41598-018-35452-x.
- Van Der Meeren O, Hatherill M, Nduba V, Wilkinson RJ, Muyoyeta M, Van Brakel E, Ayles HM, Henostroza G, Thienemann F, Scriba TJ, et al. Phase 2b controlled trial of M72/AS01E vaccine to prevent tuberculosis. N Engl J Med. 2018;379:1621–34. doi:10.1056/NEJMoa1803484.
- Kester KE, Cummings JF, Ofori-Anyinam O, Ockenhouse CF, Krzych U, Moris P, Schwenk R, Nielsen RA, Debebe Z, Pinelis E, et al. Randomized, double-blind, phase 2a trial of falciparum malaria vaccines RTS,S/AS01B and RTS,S/AS02A in malaria-naive adults: safety, efficacy, and immunologic associates of protection. J Infect Dis. 2009;200:337–46. doi:10.1086/600120.
- Polhemus ME, Remich SA, Ogutu BR, Waitumbi JN, Otieno L, Apollo S, Cummings JF, Kester KE, Ockenhouse CF, Stewart A, et al. Evaluation of RTS,S/AS02A and RTS,S/AS01B in adults in a high malaria transmission area. PLoS One. 2009;4:e6465. doi:10.1371/journal.pone.0006465.
- Spring MD, Cummings JF, Ockenhouse CF, Dutta S, Reidler R, Angov E, Bergmann-Leitner E, Stewart VA, Bittner S, Juompan L, et al. Phase 1/2a study of the malaria vaccine candidate apical membrane antigen-1 (AMA-1) administered in adjuvant system AS01B or AS02A. PLoS One. 2009;4:e5254. doi:10.1371/journal.pone.0005254.
- Laurens MB, Kouriba B, Bergmann-Leitner E, Angov E, Coulibaly D, Diarra I, Daou M, Niangaly A, Blackwelder WC, Wu Y, et al. Strain-specific Plasmodium falciparum growth inhibition among Malian children immunized with a blood-stage malaria vaccine. PLoS One. 2017;12:e0173294. doi:10.1371/journal.pone.0173294.
- Laurens MB, Thera MA, Coulibaly D, Ouattara A, Kone AK, Guindo AB, Traore K, Traore I, Kouriba B, Diallo DA, et al. Extended safety, immunogenicity and efficacy of a blood-stage malaria vaccine in malian children: 24-month follow-up of a randomized, double-blinded phase 2 trial. PLoS One. 2013;8:e79323. doi:10.1371/journal.pone.0079323.
- Thera MA, Doumbo OK, Coulibaly D, Laurens MB, Ouattara A, Kone AK, Guindo AB, Traore K, Traore I, Kouriba B, et al. A field trial to assess a blood-stage malaria vaccine. N Engl J Med. 2011;365:1004–13. doi:10.1056/NEJMoa1008115.
- Graves SF, Kouriba B, Diarra I, Daou M, Niangaly A, Coulibaly D, Keita Y, Laurens MB, Berry AA, Vekemans J, et al. Strain-specific Plasmodium falciparum multifunctional CD4(+) T cell cytokine expression in Malian children immunized with the FMP2.1/AS02A vaccine candidate. Vaccine. 2016;34:2546–55. doi:10.1016/j.vaccine.2016.04.019.
- Dutta S, Lalitha PV, Ware LA, Barbosa A, Moch JK, Vassell MA, Fileta BB, Kitov S, Kolodny N, Heppner DG, et al. Purification, characterization, and immunogenicity of the refolded ectodomain of the Plasmodium falciparum apical membrane antigen 1 expressed in Escherichia coli. Infect Immun. 2002;70:3101–10. doi:10.1128/iai.70.6.3101-3110.2002.
- Duncan EH, Bergmann-Leitner ES. Miniaturized growth inhibition assay to assess the anti-blood stage activity of antibodies. Methods Mol Biol. 2015;1325:153–65.
- Farooq F, Beck K, Paolino KM, Phillips R, Waters NC, Regules JA, Bergmann-Leitner ES. Circulating follicular T helper cells and cytokine profile in humans following vaccination with the rVSV-ZEBOV Ebola vaccine. Sci Rep. 2016;6:27944. doi:10.1038/srep27944.
- Bergmann-Leitner ES, Farooq F, Beck K. Magnetic enrichment of antigen-specific CD4+ T cells enables the in-depth characterization of vaccine-induced circulating follicular T helper cells. Miltenyi Biotec. 2016:e1–4. MACSMore Application Note. https://www.miltenyibiotec.com/upload/assets/IM0022027.PDF
- Benjamini Y, Hochberg Y. Controlling the false discovery rate: a practical and powerful approach to multiple testing. J Roy Stat Soc Ser B (Stat Method). 1995;57:289–300.
- de Vries JE. The role of IL-13 and its receptor in allergy and inflammatory responses. J Allergy Clin Immunol. 1998;102:165–69. doi:10.1016/s0091-6749(98)70080-6.
- Ben-Sasson SZ, Hu-Li J, Quiel J, Cauchetaux S, Ratner M, Shapira I, Dinarello CA, Paul WE. IL-1 acts directly on CD4 T cells to enhance their antigen-driven expansion and differentiation. Proc Natl Acad Sci U S A. 2009;106:7119–24. doi:10.1073/pnas.0902745106.
- Billerbeck E, Kang YH, Walker L, Lockstone H, Grafmueller S, Fleming V, Flint J, Willberg CB, Bengsch B, Seigel B, et al. Analysis of CD161 expression on human CD8+ T cells defines a distinct functional subset with tissue-homing properties. Proc Natl Acad Sci U S A. 2010;107:3006–11. doi:10.1073/pnas.0914839107.
- Kurachi M, Kurachi J, Suenaga F, Tsukui T, Abe J, Ueha S, Tomura M, Sugihara K, Takamura S, Kakimi K, et al. Chemokine receptor CXCR3 facilitates CD8(+) T cell differentiation into short-lived effector cells leading to memory degeneration. J Exp Med. 2011;208:1605–20. doi:10.1084/jem.20102101.
- Bacher P, Scheffold A. Flow-cytometric analysis of rare antigen-specific T cells. Cytometry Part A: J Int Soc Anal Cytol. 2013;83:692–701. doi:10.1002/cyto.a.22317.
- Chattopadhyay P, Yu J, Roederer M. Live-cell assay to detect antigen-specific CD4+ T-cell responses by CD154 expression. Nat Protoc. 2006;1:1–6. doi:10.1038/nprot.2006.1.
- Crotty S. T follicular helper cell differentiation, function, and roles in disease. Immunity. 2014;41:529–42. doi:10.1016/j.immuni.2014.10.004.
- Schmitt N, Bentebibel SE, Ueno H. Phenotype and functions of memory Tfh cells in human blood. Trends Immunol. 2014;35:436–42. doi:10.1016/j.it.2014.06.002.
- Schmitt N, Ueno H. Human T follicular helper cells: development and subsets. Adv Exp Med Biol. 2013;785:87–94. doi:10.1007/978-1-4614-6217-0_10.
- Bentebibel SE, Lopez S, Obermoser G, Schmitt N, Mueller C, Harrod C, Flano E, Mejias A, Albrecht RA, Blankenship D, et al. Induction of ICOS+CXCR3+CXCR5+ TH cells correlates with antibody responses to influenza vaccination. Sci Transl Med. 2013;5:176ra32. doi:10.1126/scitranslmed.3005191.
- Frentsch M, Stark R, Matzmohr N, Meier S, Durlanik S, Schulz AR, Stervbo U, Jürchott K, Gebhardt F, Heine G, et al. CD40L expression permits CD8+ T cells to execute immunologic helper functions. Blood. 2013;122:405–12. doi:10.1182/blood-2013-02-483586.
- Tay NQ, Lee DCP, Chua YL, Prabhu N, Gascoigne NRJ, Kemeny DM. CD40L expression allows CD8(+) T cells to promote their own expansion and differentiation through Dendritic cells. Front Immunol. 2017;8:1484. doi:10.3389/fimmu.2017.01484.
- Ferguson AR, Engelhard VH. CD8 T cells activated in distinct lymphoid organs differentially express adhesion proteins and coexpress multiple chemokine receptors. J Immunol. 2010;184:4079–86. doi:10.4049/jimmunol.0901903.
- Kondo T, Takata H, Takiguchi M. Functional expression of chemokine receptor CCR6 on human effector memory CD8+ T cells. Eur J Immunol. 2007;37:54–65. doi:10.1002/eji.200636251.
- Hu JK, Kagari T, Clingan JM, Matloubian M. Expression of chemokine receptor CXCR3 on T cells affects the balance between effector and memory CD8 T-cell generation. Proc Natl Acad Sci U S A. 2011;108:E118–27. doi:10.1073/pnas.1101881108.
- Arsent’eva NA, Semenov AV, Lyubimova NE, Ostankov YV, Elezo DS, Kudryavtsev IV, Basina VV, Esaulenko EV, Kozlov KV, Zhdanov KV, et al. Chemokine receptors CXCR3 and CCR6 and their ligands in the liver and blood of patients with Chronic Hepatitis C. Bull Exp Biol Med. 2015;160:252–55. doi:10.1007/s10517-015-3142-z.
- Oo YH, Banz V, Kavanagh D, Liaskou E, Withers DR, Humphreys E, Reynolds GM, Lee-Turner L, Kalia N, Hubscher SG, et al. CXCR3-dependent recruitment and CCR6-mediated positioning of Th-17 cells in the inflamed liver. J Hepatol. 2012;57:1044–51. doi:10.1016/j.jhep.2012.07.008.
- Malisan F, Briere F, Bridon JM, Harindranath N, Mills FC, Max EE, Banchereau J, Martinez-Valdez H. Interleukin-10 induces immunoglobulin G isotype switch recombination in human CD40-activated naive B lymphocytes. J Exp Med. 1996;183:937–47. doi:10.1084/jem.183.3.937.
- Rousset F, Garcia E, Defrance T, Peronne C, Vezzio N, Hsu DH, Kastelein R, Moore KW, Banchereau J. Interleukin 10 is a potent growth and differentiation factor for activated human B lymphocytes. Proc Natl Acad Sci U S A. 1992;89:1890–93. doi:10.1073/pnas.89.5.1890.
- Chauvat A, Benhamouda N, Gey A, Lemoine FM, Paulie S, Carrat F, Gougeon M-L, Rozenberg F, Krivine A, Cherai M, et al. Clinical validation of IFNgamma/IL-10 and IFNgamma/IL-2 FluoroSpot assays for the detection of Tr1 T cells and influenza vaccine monitoring in humans. Hum Vaccin Immunother. 2014;10:104–13. doi:10.4161/hv.26593.
- Fillatreau S. Regulatory roles of B cells in infectious diseases. Clin Exp Rheumatol. 2016;34:1–5.
- Lewis DJM, Lythgoe MP. Application of “System Vaccinology” to evaluate inflammation and reactogenicity of adjuvanted preventative vaccines. J Immunol Res. 2015;2015:1–11. doi:10.1155/2015/909406.