
 ?Mathematical formulae have been encoded as MathML and are displayed in this HTML version using MathJax in order to improve their display. Uncheck the box to turn MathJax off. This feature requires Javascript. Click on a formula to zoom.
ABSTRACT
Purpose
To estimate influenza-associated excess mortality rates (EMRs) in Chongqing from 2012 to 2018.
Methods
We obtained weekly mortality data for all-cause and four underlying causes of death (circulatory and respiratory disease (CRD), pneumonia and influenza (P&I), chronic obstructive pulmonary disease (COPD) and ischemic heart disease (IDH)), and influenza surveillance data, from 2012 to 2018. A negative-binomial regression model was used to estimate influenza-associated EMRs in two age groups (<65 years and ≥65 years).
Results
It was estimated that an annual average of 10025 influenza-associated deaths occurred in Chongqing, corresponding to 5.2% of all deaths. The average EMR for all-cause death associated with influenza was 33.5 (95% confidence interval (CI): 31.5–35.6) per 100 000 persons, and in separate cause-specific models we attributed 24.7 (95% CI: 23.3–26.0), 0.8 (95% CI: 0.7–0.8), 8.5 (95% CI: 8.1–9.0) and 5.0 (95% CI: 4.7–5.3) per 100 000 persons EMRs to CRD, P&I, COPD and IDH, respectively. The estimated EMR for influenza B virus was 20.6 (95% CI: 20.3–21.0), which was significantly higher than the rates of 5.3 (95% CI: 4.5–6.1) and 7.5 (95% CI: 6.7–8.3) for A(H3N2) and A(H1N1) pdm09 virus, respectively. The estimated EMR was 152.3 (95% CI: 136.1–168.4) for people aged ≥65 years, which was significantly higher than the rate for those aged <65 years (6.8, 95% CI: 6.3–7.2).
Conclusions
Influenza was associated with substantial EMRs in Chongqing, especially among elderly people. Influenza B virus caused a relatively higher excess mortality impact compared with A(H1N1)pdm09 and A(H3N2). It is advisable to optimize future seasonal influenza vaccine reimbursement policy in Chongqing to curb disease burden.
KEYWORDS:
Introduction
Globally, seasonal influenza has been associated with substantial morbidity and mortality every year. At the global level, influenza has been estimated to cause approximately 290 000–650 000 respiratory deaths annually,Citation1 which was higher than previous estimates-roughly 250 000–500 000 respiratory and circulatory deaths each year.Citation2
Estimation of influenza-associated mortality burden is important for understanding the epidemiology of influenza, guiding vaccination programs, evaluating the use of diagnostic tests and antiviral drugs, and planning for seasonal epidemics and future pandemics. However, estimating the mortality burden associated with influenza remains challenging due to the following challenges: first, influenza diagnosis is usually based on symptoms and laboratory confirmation is not routinely conducted in hospitals; second, many deaths that may be caused by influenza occur after virus can be detected; third, influenza is rarely recorded as the cause of death in the death registration system. Therefore, directly counting influenza deaths usually grossly underestimate the mortality burden of influenza. To overcome underestimation of influenza-related deaths, various statistical models have been employed to estimate the mortality burden associated with influenza,Citation1,Citation3,Citation4 among which negative-binomial regression model has been widely used.Citation5,Citation6 The rationale for the modeling approach was to estimate influenza-associated excess mortality rate (EMR), which was defined as the difference between observed and expected mortality based on the regression model in the absence of influenza.
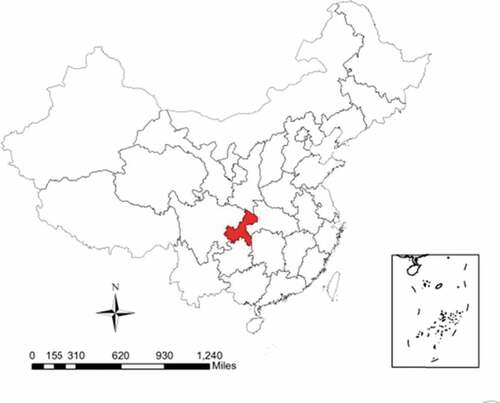
Considering the diverse seasonality patterns, income levels, and healthcare access, influenza mortality burden varies across geographical locations.Citation1,Citation4,Citation7 With the latitude of 29.6°N and a subtropical climate with four distinct seasons, Chongqing is the largest municipality with over 30 million registered inhabitants, which is located in Southwestern China (). Previous study demonstrated that influenza virus circulated throughout the year and showed two possible peaks.Citation8 However, little is known about the impact of influenza on death in this area.
Figure 1. The geographical location of Chongqing, China.
To address this gap, we applied a negative-binomial model to the weekly counts of deaths and influenza viral data to estimate the mortality burden of influenza in Chongqing by death category, age group, and influenza type/subtypes during the period of 2012–2018.
Materials and methods
Mortality data and population denominators
According to China Center for Disease Control and Prevention (CDC), every individual death certificate in China is required to be registered in the death registration system. The causes of mortality are coded according to the International Classification of Diseases, the 10th version (ICD-10). Coding practices are based on a standardized protocol, and quality control is conducted routinely by staff from the local CDC. We obtained separate data for five underlying causes of death in Chongqing from 2012 to 2018: circulatory and respiratory disease (CRD, ICD-10: J00-J99 or I00-I99), pneumonia and influenza (P&I, ICD-10: J10-J18), chronic obstructive pulmonary disease (COPD, ICD-10: J40-J47), ischemic heart disease (IHD, ICD-10: I20-I25), as well as total deaths.
The annual population data were obtained from the Household Registration Department of Chongqing Municipal Statistic Bureau. EMR was stratified by death category, influenza type/subtypes and two age-groups (0–64, and ≥65 years).
Influenza virological surveillance
Influenza surveillance was conducted in seven sentinel hospitals throughout the year in Chongqing from 2012 to 2018. The seven sentinel hospitals were selected based on high accessibility among patients, high qualification of medical staff, adequate specimen storage capacity, and the desire of the physicians and nurses to participate voluntarily in the surveillance program. Surveillance is conducted in sentinel hospital emergency rooms and internal medicine and pediatric outpatient departments. The influenza surveillance protocol in Chongqing is in accord with the national influenza surveillance protocol and has been stated in a previous study.Citation8 We obtained influenza virological surveillance data from seven sentinel hospitals in Chongqing, including weekly numbers of specimens tested positive for influenza A(H1N1)pdm09, influenza A(H3N2), influenza B, and calculated weekly positive rate using weekly number of specimens as the denominator. An influenza type or subtype was considered dominant when it accounted for at least 50% of all influenza-positive specimens.
Estimating of influenza-associated EMRs
Given over-dispersion in mortality data, we applied negative-binomial regression models to estimate EMRs, using weekly mortality counts as the outcome and weekly proportions of specimens testing positive for influenza A(H1N1)pdm09, A(H3N2) and B as the explanatory variables.
The negative-binomial model was applied to each of the five disease categories (CRD, P&I, COPD, IHD and all-cause) and two age groups (age <65 years and ≥65 years) using a log link function. The model used was as follows:
where Y(ti) is the number of death for week ti, β0 represents the intercept, β1 and β2 represents the linear and nonlinear time trends, respectively, β3, β4, β5 and β6 account for seasonality, and β7 through β9 accounts for the percentage of specimens testing positive for week ti. Based on correlation between mortality outcomes and viral surveillance data at different lags (range 0–3 weeks), we used 3-week lag which had the most significant association with mortality.
The number of deaths attributable to influenza was calculated as the difference between the prediction from the full model and the predictions from the models when parameters for every influenza type/subtype were set to zero, assuming there was no influenza virus circulating. Influenza-associated excess deaths were estimated for influenza A(H1N1) pdm09, A(H3N2) and B virus, separately. EMRs associated with influenza type/subtypes were calculated by dividing the excess deaths to the registered population size. The 95% confidence intervals (CIs) were obtained by bootstrapping the residual 1000 times and fitting the negative-binomial regression models.Citation9 The influenza-associated excess mortality rates for influenza A(H1N1) pdm09, A(H3N2) and B virus were compared based on Poisson distribution model.
All analyses were conducted using R version 3.5.1 (R Foundation for Statistical Computing, Vienna, Austria). A P-value of <0.05 was considered indicative of a statistically significant difference.
Ethics approval
Study approval was obtained from the Chongqing CDC Ethics Committee.
Results
Annual deaths by underlying diagnosis
In the study period 2012–2018, an annual mean of 193 757 deaths were recorded in Chongqing, including 117 503 coded as CRD, 3163 coded as P&I, 33 326 coded as COPD and 23 903 coded as IHD, representing 60.6%, 1.6%, 17.2% and 12.3% of all deaths, respectively (). Adults aged ≥65 years accounted for 73.9% of all-cause deaths. The proportion of deaths coded as CRD, P&I, COPD, and IHD as well as all causes were 83.9%, 82.0%, 89.4%, 81.9%, and 85.3% for people age ≥65 years, respectively.
Table 1. Annual number of deaths in Chongqing, China, 2012–2018.
Annual influenza virological surveillance
showed the influenza surveillance data in Chongqing during 2012–2018. Overall, 27 036 specimens from ILI cases were collected for virus detection. Among tested specimens, 10.9% (2947/27036) were positive for influenza virus by reverse transcription-polymerase chain reaction. Influenza A (H1N1)pdm09, A (H3N2), and B virus comprised 23.1%, 36.6% and 40.3% of the positive influenza isolated, respectively.
Table 2. Annual sum of total specimens tested and specimens positive for influenza by type/subtypes in Chongqing, 2012–2018.
Influenza A(H3N2) was the predominant virus in 2012 and 2014, while A(H1N1)pdm09 predominated in 2013 and 2018, influenza B predominant in 2015 and 2016, and influenza A(H1N1)pdm09, A(H3N2) and B co-circulated in 2017 ().
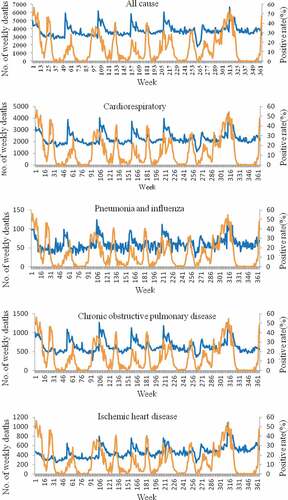
Weekly number of influenza-associated death per five causes and the proportion of influenza-positive in all age groups () showed that each of the five health outcomes has a similar pattern to that seen with influenza activity.
Figure 2. Weekly number of influenza-associated death per five causes (blue) and the proportion of influenza-positive rate (orange) in Chongqing, 2012–2018.
Influenza-associated EMRs
Influenza was significantly associated with all health outcomes for all age groups. For people aged ≥65 years, the annual average influenza-associated EMR was 152.3(95% CI: 136.1–168.4) per 100 000 persons, which was significantly higher than the rate among those aged <65 years (6.8, 95% CI: 6.3–7.2). Age-stratified analysis revealed that influenza-associated EMRs for CRD, P&I, COPD, and IDH were more than 20-fold higher among people aged ≥65 years than among those aged <65 years ().
Table 3. Influenza-associated EMRs in 2012–2018 estimated by negative-binomial model.
Compared with influenza A virus, influenza B virus showed a significantly higher mortality burden. showed that for all age group influenza B virus accounted for the highest EMR of all-cause mortality (20.6, 95% CI: 20.3–21.0), followed by A(H1N1)pdm09 (7.5, 95% CI: 6.7–8.3) and A(H3N2) (5.3, 95% CI: 4.5–6.1) per 100 000 persons. A similar pattern was also observed for CRD, P&I, COPD and IDH among both those aged ≥65 years and those aged <65 years.
Discussion
This study estimated the mortality burden of seasonal influenza in Chongqing based on robust vital statistics and mortality data during 2012–2018. We estimated an average of 10 025 influenza-associated all causes deaths per year, accounting for 5.2% of all reported deaths from the death registration system. All-cause mortality rate associated with influenza was 33.5 (95% CI: 31.5–35.5) per 100 000 persons, and in separate cause-specific models we attributed 24.7 (95% CI: 23.3–26.0), 0.8 (95% CI: 0.7–0.8), 8.5 (95% CI: 8.1–9.0), and 5.0 (95% CI: 4.7–5.3) per 100 000 persons EMRs to CRD, P&I, COPD and IDH, respectively.
Our estimates were much higher than estimates from Beijing,Citation10 Hefei,Citation11 Yancheng,Citation12 GuangzhouCitation13 in China and other countries such as Thailand,Citation14 United States,Citation15 Singapore, and New Zealand.Citation16,Citation17 For example, a study carried out in Beijing reported that an average of 17.2 (95% CI, 7.2–67.5) per 100 000 persons for all-cause death, 13.5 (95% CI, 5.8–51.7) per 100 000 persons for CRD excess mortality associated with influenza annually from 2007 to 2013.Citation10 Another study conducted by China CDC reported that an average of 11.3 (95% CI, 1.4–50.4) per 100 000 persons for all-cause death, 7.8 (95% CI, 1.8–50.4) per 100 000 persons for CRD, 0.5 (95% CI, 0.1–2.3) per 100 000 persons for P&I, 1.0 (95% CI, 0.1–7.0) per 100 000 persons for IDH and 3.0 (95% CI, 0.7–12.0) per 100 000 persons for COPD excess mortality associated with influenza annually in five south cities (Shanghai, Wuhan, Yichang, Ningbo, and Guangzhou) from 2003 to 2008.Citation5 The possible explanations for the differences might be associated with the regional variation in socioeconomic and demographic factors, different models used and different study periods. Furthermore, differences in successful implementation of seasonal influenza vaccination might also have played an important role. The influenza vaccination subsidy policy was quite different in different regions. Many high-income countries conducted influenza vaccination program in older adults with the goal of reducing the influenza-associated mortality in this high-risk group. China in general has low vaccination coverage in the population,Citation18 and only in a few regions such as Beijing where the local government fully subsidizes the vaccination in older adults.Citation19 At present, the cost of influenza vaccination is borne using the surplus fund of basic social medical insurance for urban residents individual accounts in Chongqing and many people have to pay for the seasonal influenza vaccine out of pocket,Citation18 which might lead to very low influenza vaccination coverage in this area.
Overall, the impact of influenza on mortality in Chongqing disproportional affected people aged ≥65 years, which is consistent with the findings of previous studies.Citation5,Citation16,Citation20–Citation22 According to the 2010 census results in China, the proportion of people ≥65 years old in Chongqing was the highest in China, which has reached the average level of developed countries.Citation23 Given the high excess mortality among elderly people and the serious aging problem in Chongqing, great efforts should be made to increase seasonal influenza vaccination coverage in this population.
It is not surprising that CRD was the major contributor to total influenza-associated deaths, as CRD was the primary cause in Chongqing. Our data also suggested a significant association between influenza and COPD death. This finding was not unexpected given multiple reports relating the association between COPD death and seasonal influenza. The relation may be explained by the dysfunction of innate immune defenses and destruction of the lung parenchyma or airway remodeling by acute virus infections.Citation24 In China, COPD was the third leading cause of death and accounted for more 965.9 thousand deaths in 2017.Citation25 There was accumulating evidence suggesting that influenza vaccination was associated with a reduced risk of mortality in COPD patients and seasonal influenza vaccination was recommended by international and national health organizations; nonetheless coverage remains sub-optimal compared to recommended targets.Citation26
Notably, our study observed that influenza B caused the highest-burden compared with A(H1N1)pdm09 and A(H3N2). This mortality pattern is consistent with those described in studies conducted by China CDC,Citation5 Beijing CDC and Guangzhou CDC,Citation6,Citation10 but differs from studies conducted in other regions and countries such as Yancheng,Citation12 Hefei,Citation11 Hong Kong,Citation9 Singapore,Citation16 South Korea,Citation27 United States,Citation15 and New Zealand,Citation17 where the highest EMR was associated with influenza A(H3N2). The inconsistent severity profile of influenza type/subtypes warrants further investigation in more locations in future studies.
Despite providing insightful estimates of influenza-associated disease burden in Chongqing, this study has several limitations. Firstly, this was an ecological study with aggregated data, so ecologic fallacy was inevitable. Secondly, it was not possible to adjust for other co-circulating respiratory viruses such as respiratory syncytial virus, adenovirus, and parainfluenza virus, which may have confounded the results. In future, the establishment of such surveillance system may improve the accuracy of influenza-associated mortality burden. Thirdly, our results were dependent on the coding and registration of deaths, errors including possible underreporting and misclassification of deaths could lead to the underestimation of influenza-associated excess mortality, especially for disease-specific mortality indicators. Finally, we only examined the impact of influenza epidemics on excess mortality. In future, a more comprehensive assessment including hospitalization, year-of-life lost and economic burden of influenza would help to fully assess the disease burden of influenza in Chongqing.
Conclusions
Our study demonstrated a substantial influenza-related mortality burden in the largest municipality in China from 2012 to 2018, primarily associated with CRD and COPD deaths in the elderly. Influenza B virus caused a relatively higher excess mortality impact compared with A (H1N1)pdm09 and A(H3N2). This study supported the recent recommendation by the National Immunization Advisory Committee on “Technical guidelines for seasonal influenza vaccination in China (2018–2019)” for elderly people and individuals with chronic underlying conditions, such as COPD, CVD or diabetes, be treated as priority groups for seasonal influenza vaccination.Citation28 It is advisable to optimize future seasonal influenza vaccine reimbursement policy in Chongqing to curb disease burden.
Disclosure of potential conflicts of interest
No potential conflicts of interest were disclosed.
Acknowledgments
The authors would like to thank all study participants, all discussion facilitators and all consultants who contributed to this study.
Additional information
Funding
References
- Iuliano AD, Roguski KM, Chang HH, Muscatello DJ, Palekar R, Tempia S, Cohen C, Gran JM, Schanzer D, Cowling BJ, et al. Estimates of global seasonal influenza-associated respiratory mortality: a modelling study. Lancet. 2018;391:1285–300. doi:10.1016/S0140-6736(17)33293-2.
- Influenza (seasonal) fact sheet; 2016 [accessed 2016 May 10]. http://www.who.int/mediacentre/factsheets/fs211/en/.
- Newall AT, Viboud C, Wood JG. Influenza-attributable mortality in Australians aged more than 50 years: a comparison of different modelling approaches. Epidemiol Infect. 2010;138:836–42. doi:10.1017/S095026880999118X.
- Li L, Wong JY, Wu P, Bond HS, Lau EHY, Sullivan BJ. Heterogeneity in estimates of the impact of influenza on population mortality: a systematic review. Am J Epidemiol. 2018;187:378–88. doi:10.1093/aje/kwx270.
- Feng L, Shay DK, Jiang Y, Zhou H, Chen X, Zheng Y, Jiang L, Zhang Q, Lin H, Wang S, et al. Influenza-associated mortality in temperate and subtropical Chinese cities, 2003-2008. Bull World Health Organ. 2012;90:279–88B. doi:10.2471/BLT.11.096958.
- Wang H, Fu C, Li K, Lu J, Chen Y, Lu E, Xiao X, Di B, Liu H, Yang Z, et al. Influenza associated mortality in southern china, 2010-2012. Vaccine. 2014;32(8):973–78. doi:10.1016/j.vaccine.2013.12.013.
- Yu H, Alonso WJ, Feng L, Tan Y, Shu Y, Yang W, Viboud C. Characterization of regional influenza seasonality patterns in China and implications for vaccination strategies: spatio-temporal modeling of surveillance data. PLoS Med. 2013;10:e1001552. doi:10.1371/journal.pmed.1001552.
- Qi L, Xiong Y, Xiao B, Tang W, Ling H, Long J, Xiao D, Zhao H, Ye S, Chen S, et al. Epidemiological and virological characteristics of influenza in Chongqing, China, 2011-2015. PLoS One. 2016;11:e0167866. doi:10.1371/journal.pone.0167866.
- Wu P, Goldstein E, Ho LM, Yang L, Nishiura H, Wu JT, Ip DKM, Chuang S-K, Tsang T, Cowling BJ, et al. Excess mortality associated with influenza A and B virus in Hong Kong, 1998-2009. J Infect Dis. 2012;206:1862–71. doi:10.1093/infdis/jis628.
- Wu S, Wei Z, Greene CM, Yang P, Su J, Song Y, Iuliano AD, Wang Q. Mortality burden from seasonal influenza and 2009 H1N1 pandemic influenza in Beijing, China, 2007-2013. Influenza Other Respi Viruses. 2018;12:88–97. doi:10.1111/irv.2018.12.issue-1.
- Liu XX, Qin G, Li X, Zhang J, Zhao K, Hu M, Wang X-L. Excess mortality associated with influenza after the 2009 H1N1 pandemic in a subtropical city in China, 2010-2015. Int J Infect Dis: IJID: off Publ Int Soc Infect Dis. 2017;57:54–60. doi:10.1016/j.ijid.2017.01.039.
- Zhang H, Xiong Q, Wu P, Chen Y, Leung NHL, Cowling BJ. Influenza-associated mortality in Yancheng, China, 2011-15. Influenza Other Respi Viruses. 2018;12:98–103. doi:10.1111/irv.2018.12.issue-1.
- Yang L, Wong CM, Chan KP, Chau PY, Ou CQ, Chan KH, Peiris JM. Seasonal effects of influenza on mortality in a subtropical city. BMC Infect Dis. 2009;9:133. doi:10.1186/1471-2334-9-133.
- Aungkulanon S, Cheng PY, Kusreesakul K, Bundhamcharoen K, Chittaganpitch M, Margaret M, Olsen S. Influenza-associated mortality in Thailand, 2006-2011. Influenza Other Respi Viruses. 2015;9:298–304. doi:10.1111/irv.12344.
- Matias G, Taylor R, Haguinet F, Schuck-Paim C, Lustig R, Shinde V. Estimates of mortality attributable to influenza and RSV in the United States during 1997-2009 by influenza type or subtype, age, cause of death, and risk status. Influenza Other Respi Viruses. 2014;8:507–15. doi:10.1111/irv.2014.8.issue-5.
- Angela C, Stefan M, Ai EL, Suok KC. Influenza-associated deaths in Tropical Singapore. Emerging Infect Dis. 2006;12:114–18. doi:10.3201/eid1201.050826.
- Kessaram T, Stanley J, Baker MG. Estimating influenza-associated mortality in New Zealand from 1990 to 2008. Influenza Other Respi Viruses. 2015;9:14–19. doi:10.1111/irv.2014.9.issue-1.
- Yang J, Atkins KE, Feng L, Pang M, Zheng Y, Liu X, Cowling BJ, Yu H. Seasonal influenza vaccination in China: landscape of diverse regional reimbursement policy, and budget impact analysis. Vaccine. 2016;34:5724–35. doi:10.1016/j.vaccine.2016.10.013.
- Lv M, Fang R, Wu J, Pang X, Deng Y, Lei T, Xie Z. The free vaccination policy of influenza in Beijing, China: the vaccine coverage and its associated factors. Vaccine. 2016;34:2135–40. doi:10.1016/j.vaccine.2016.02.032.
- Yang L, Ma S, Chen PY, He JF, Chan KP, Chow A, Ou CQ, Deng AP, Hedley AJ, Wong CM, et al. Influenza associated mortality in the subtropics and tropics: results from three Asian cities. Vaccine. 2011;29:8909–14. doi:10.1016/j.vaccine.2011.09.071.
- Nguyen AM, Noymer A, Cowling BJ. Influenza mortality in the United States, 2009 pandemic: burden, timing and age distribution. PLoS One. 2013;8:e64198. doi:10.1371/journal.pone.0064198.
- Wu P, Presanis AM, Bond HS, Lau EHY, Fang VJ, Cowling BJ. A joint analysis of influenza-associated hospitalizations and mortality in Hong Kong, 1998-2013. Sci Rep. 2017;7:929. doi:10.1038/s41598-017-01021-x.
- Fang Feng ZH, Xu D. Population aging in Chongqing and it’s influence on Chongqing’s economic growth. China Popul Resour Environ. 2015;25:47–49.
- Sethi S. Infection as a comorbidity of COPD. Eur Respir J. 2010;35:1209–15. doi:10.1183/09031936.00081409.
- Wen H, Xie C, Wang L, Wang F, Wang Y, Liu X, Yu C. Difference in long-term trends in COPD mortality between China and the U.S., 1992–2017: an Age–Period–cohort analysis. Int J Environ Res Public Health. 2019;16:1529. doi:10.3390/ijerph16091529.
- Bekkat-Berkani R, Wilkinson T, Buchy P, Dos Santos G, Stefanidis D, Devaster JM, Meyer N. Seasonal influenza vaccination in patients with COPD: a systematic literature review. BMC Pulm Med. 2017;17:79. doi:10.1186/s12890-017-0420-8.
- Park M, Wu P, Goldstein E, Joo Kim W, Cowling BJ. Influenza-associated excess mortality in South Korea. Am J Prev Med. 2016;50:e111–e9. doi:10.1016/j.amepre.2015.09.028.
- Technical guidelines for influenza vaccination in China (2018–2019); 2018. [accessed 2018 Sep 29]. http://www.chinacdc.cn/yw_9324/201809/t20180929_194396.html.