
ABSTRACT
In a sub-study of a clinical trial (NCT01737710) investigating the immunogenicity of trivalent inactivated influenza vaccine (IIV3) administered intradermally or intramuscularly to individuals with atopic dermatitis (AD), we assessed T cell and antigen-presenting cell (APC) responses to influenza B in AD and Non-AD controls. The comparison of IFN-γ ELISpot in 58 AD and 31 Non-AD showed lower responses in AD pre-vaccination. Pre-vaccination, AD also had lower Th2 responses and less inflammatory cytokine production by APC measured by flow cytometry and cytokine levels in culture supernatants. AD also had lower Th1 and Th2 responses to nonspecific anti-CD3/anti-CD28-stimulation, but these were not significantly correlated with the influenza-specific responses, suggesting a primary role for the APC in the decreased influenza-specific T cell responses. Multivariate modeling of influenza-specific responses pre-vaccination with influenza-specific antibody titers and IFN-γ ELISpot as outcome measures identified several T cell and APC subsets that negatively or positively predicted protective responses to the vaccine. However, none of the functional differences between AD and Non-AD had high predictive value on adaptive responses to influenza vaccine, which was in agreement with the overall similar responses to the vaccine in the parent clinical trial.
Introduction
Influenza causes seasonal disease in temperate climate areas. It is estimated that 5–20% of the population of the U.S. becomes infected with influenza yearly; > 200,000 individuals are hospitalized with severe complications; and about 36,000 individuals die annually from influenza-related illness.Citation1 Seasonal influenza vaccines are the mainstay of protection against the influenza and its complications.
The efficacy of the seasonal influenza vaccines depends primarily on the match between the vaccine and the circulating viruses, although heterotypic cross reactivity has been documented .Citation2 In addition, factors related to the host and vaccine preparation also contribute to the immunogenicity and efficacy of the influenza vaccines. Recent studies have found that intradermal vaccination is more immunogenic than systemic vaccination in normal skin.Citation3–5 However, in a study in individuals with atopic dermatitis (AD) performed by the Atopic Dermatitis Research Network (ADRN) (NCT01737710), we did not verify increased immunogenicity of intradermal compared with intramuscular administration of the trivalent inactivated influenza vaccine (IIV3) in AD participants.Citation6 In fact, compared with intramuscular administration, intradermal administration of IIV3 to AD participants with S. aureus colonization resulted in 1) lower seroprotection and seroconversion rates and lower hemagglutination inhibition (HAI) antibody fold-increases against influenza B (Flu B) and 2) lower seroconversion rates against influenza H1N1 compared with non-colonized AD participants. It is important to note that AD is the most common chronic skin disease in the general population affecting more than 15% of children, half of whom persist into adulthood.Citation7 Moreover, AD develop severe and extensive cutaneous reactions to herpes simplex infections in association with decreased T cell and antigen-presenting cell responses to the virus.Citation8
The objectives of this post-hoc analysis were to characterize the T cell responses to Flu B in AD with intradermal and intramuscular IIV3 by comparison with Non-AD with intradermal IIV3 and identify predictors of Flu B protective responses to IIV3.
Participants and methods
Participants and study design
Participants aged 18–64 years received open-label vaccination at National Jewish Health upon approval from the institutional review board. Participants with AD had active, moderate to severe skin lesions as per the Rajka-Langeland Severity Score.Citation9 Non-AD had no personal or first-degree family history of AD, asthma, allergic rhinitis, or food allergy.
Participants with moderate/severe AD were randomized 1:1 to receive intradermal or intramuscular administration of the 2012–2013 seasonal influenza vaccine. Non-AD participants were randomized 3:2 to intradermal or intramuscular vaccination until 23 participants received intramuscular vaccination. Thereafter, remaining Non-AD participants received intradermal vaccination. The 23 Non-AD participants receiving intramuscular vaccination are not included in analyses for this publication. Stratified block randomization was used to balance gender and AD severity between vaccination routes by clinical site.
Flow cytometry
Cryopreserved peripheral blood mononuclear cells (PBMC) were thawed in serum-free media (AIM V, Gibco) supplemented with benzonase (50 units/mL, Millipore) and counted.
For the proliferation assay, 3 million cells were labeled with CellTrace Violet (Life Technologies) and stimulated in a 48-well plate with either media only, Flu B (ATCC; 1:20 dilution of Influenza B control Ag B/Wisconsin/1/2010-like, Yamagata) for 6 days in 1 ml serum-free media +10% of the subject’s serum. Brefeldin A and Monensin (5 µg/ml each, SIGMA) were added for the last 4 hours of culture. Cells were stained with Zombie Yellow viability dye (Biolegend), CLA PE, CD8 PE-CF594, CD4 PerCP-Cy5.5 and CD3 AlexaFluor700 (BD Biosciences). Cells were then treated with BD lysing solution and BD Perm2 solution and stained for IL-13 FITC (eBiosciences), IL-10 PE-Cy7, IL-21 antigen-presenting cells (APC) and IFN-γ APC-Cy7 (Biolegend). The gating strategy is shown in .
Figure 1. Gating strategies. Panel A shows T cell gating; Panel B shows the antigen presenting cell gating
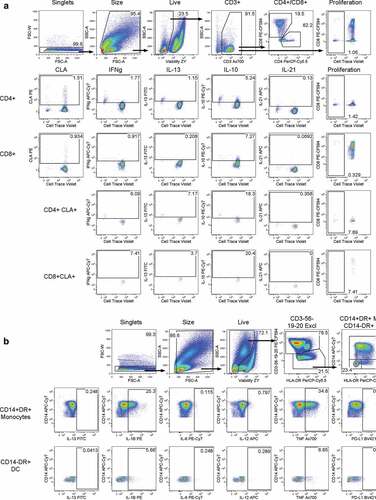
For the cytokine production assay, 1 million cells were added per well of a 96-well polypropylene plate and rested overnight in serum-free media + 10% serum from the same subject. The next day, stimulants were added (Media or Flu B, same concentrations as above) along with Brefeldin A and Monensin for 6 hours. Cells were surface-stained with Zombie Yellow viability dye (Biolegend), CD3, CD56, CD19 and CD20 PE-CF594, HLA-DR PerCP-Cy5.5, CD14 APC-Cy7 (BD Biosciences) and PD-L1 BV421 (Biolegend). Cells were then treated with BD lysing solution and BD Perm2 solution followed by intracellular staining of IL-13 FITC, IL-6 PE-Cy7 (eBiosciences), IL-1B PE, IL-12 APC (BD Biosciences) and TNF AlexaFluor700 (Biolegend). The gating strategy is shown in .
ELISpot
Cryopreserved PBMC were thawed in AIM V serum-free media supplemented with benzonase, counted and rested overnight at 2*106 cells/ml in an incubator (37°C, 5% CO2). Cells were washed, counted and incubated with media only, Flu B (1:1600) or PHA (Sigma; 5 µg/ml) in IFN-γ ELISpot plates (Mabtech). The rest of the assay was performed per manufacturer’s instructions. Spot forming cells (SFC) were counted with Immunospot II (CTL). Results were reported as the mean SFC/106 PBMC in Flu B wells after subtraction of media controls.
Cytokine secretion measured by luminex
Cell supernatant was collected after 48-hour stimulation with Flu B (1:1600), CD3/CD28 (0.1 µg/ml each in suspension), or media control. The ProcartaPlex Immunoassay Kit (eBiosciences) was used to detect cytokines as per manufacturer’s instructions. A 7-point standard curve was run in duplicate, and two wells were used for blanks in each run. A sample control was included in each plate to verify reproducibility. Sample data were collected using the Bio-Plex 200 system (Bio-Rad), and Bio-Plex Manager software (Bio-Rad) was used for standard curve optimization and data analysis. Among all measured cytokines, IFN-γ, IFN-α, IL-10, IL-13, and IL-29 were detected in PBMC cultures and induced by Flu B stimulation, which allowed us to include them in the statistical analysis.
Statistical analysis
Demographics and other baseline characteristics of the study population were compared between AD participants who received intradermal vaccination (AD-ID) and both participants without AD who received intradermal vaccination (Non-AD-ID) and AD participants who received intramuscular vaccination (AD-IM) using chi-square tests for categorical variables and Kruskal-Wallis tests for continuous variables. In all of the subsequent analyses, the AD-ID and AD-IM groups were combined into one group (AD). A linear regression model was used to assess differences between groups in the Flu B-specific ELISpot responses at baseline and day 28. The baseline model was adjusted for age, gender, and atopic status (AD or NA) and the model for day 28 was adjusted for age, gender, baseline Flu B specific ELISpot response, and atopic status (AD or Non-AD). All ELISpot values were log transformed. Pairwise group comparisons of least squares means were performed using t-tests. The geometric mean and 95% confidence interval were calculated for each T Cell cytokine measured in the AD and Non-AD groups. For all measures of cytokine levels, linear regression models of log-transformed values were fit adjusting for gender and age. Some models also adjusted for unstimulated response, as indicated in tables, when differences in unstimulated response were detected between groups (data not shown). Adjusted geometric means and 95% confidence intervals are reported in addition to geometric mean ratios and 95% confidence intervals. The Pearson correlation, R, was calculated between cytokine secretion in PBMCs stimulated with Flu B and CD3/CD28. Lasso and elastic-net regularized generalized linear models were fit in order to select the most relevant cytokines for distinguishing HAI and IFN-γ levels using the glmnet procedure.Citation10 The elastic-net penalty is a combination of lasso and ridge regression penalties. This technique is particularly efficient for feature selection in data with collinearity and/or many features. Repeated 5-fold cross validation was used to prevent overfitting and select the best penalty parameters. R version 3.5.1 was used for analyses. Univariate correlations between each predictor and outcome were calculated and the coefficient of determination, R2, was reported.
Results
Characteristics of the study participants
The cell-mediated immunity (CMI) sub-study included 89 participants roughly equally distributed across Non-AD-ID, AD-ID and AD-IM groups (). At entry, the majority of participants were white and non-Hispanic with a mean age of 37.5, 34.3, and 37.6 years in Non-AD-ID, AD-ID, and AD-IM, respectively. The rate of Flu B seroprotection at baseline, defined by HAI titers ≥ 1:40, was 6.5% in Non-AD-ID, 6.7% in AD-intradermal and 3.6% in AD-IM. Corresponding rates 28 days after vaccination were 29%, 30%, and 39%, respectively. Seroconversion, defined by ≥4-fold increases in HAI titers 28 days after vaccination compared with baseline, occurred in 29% Non-AD-ID, 30% AD-ID, and 43% AD-IM. AD-ID and AD-IM participants had median Rajka-Langeland total scores of 7.5 and 7, respectively.
Table 1. Characteristics of the study population
Flu B-specific ELISpot responses
Flu B-specific responses were measured before and 28 days after IIV administration in all CMI sub-study participants (). At baseline, AD participants had marginally lower responses (p = .08). However, responses at day 28 after vaccination did not differ among groups. Because no differences were observed in the T cell responses of AD-ID or AD-IM, subsequent analyses combined the data obtained from AD participants regardless of route of administration.
Figure 2. Flu B-specific ELISpot results. Flu B-specific responses before and 28 days after IIV administration in all CMI sub-study participants. A linear regression model was used to assess differences between groups in the Flu B-specific ELISpot responses at baseline and day 28. Geometric means are shown for participants without atopic dermatitis who received intradermal vaccination (Non-AD-ID), participants with atopic dermatitis who received intradermal vaccination (AD-ID), and participants with AD who received intramuscular vaccination (AD-IM) at each time point. Pairwise group comparisons of least squares means were performed on log-transformed values using t-tests. No differences were observed in Flu B response between any of the three groups at Day 28. At baseline, AD participants had marginally lower responses than Non-AD participants (p = .08)
T-cell responses to Flu B measured by flow cytometry
To further understand the differences in Flu B-specific T cell responses before vaccination between AD and NON-AD participants, we used multiparameter flow cytometry to investigate proliferation, cytokine secretion, and expression of skin homing receptors in response to Flu B ex vivo stimulation of PBMC. There were no differences in Flu B-specific proliferation and CLA homing receptor expression between groups (). However, we found marginally lower expression of IFN-γ (p = .07) and IL-13 (p = .05) in CD8 + T cells of AD compared with Non-AD participants.
Table 2. T cell cytokine expression in response to Flu B ex-vivo stimulation
Cytokine secretion in response to Flu B-specific and nonspecific T cell stimulation
Next, we measured a panel of cytokines in the supernatants of Flu B-stimulated PBMC cultures. There was marginally lower IFN-α, IFN-γ, and IL-10 secretion in AD than Non-AD in Flu B-stimulated PBMC (p = .08, p = .07, and p = .1, respectively, ). To verify if differences were specific to responses to Flu B as opposed to a more general T cell characteristic, we also measured cytokine secretion in PBMC stimulated with CD3/CD28. The data showed marginally lower IFN-γ in CD3/CD28-stimulated PBMC of AD compared with Non-AD (p = .08), but no other differences. The correlation between Flu B-specific and CD3/CD28-nonspecific stimulated IFN-γ and IL-10 was relatively low with R values between 0.32 and 0.46 (). There were no significant differences in the correlations between diagnostic groups for IFN-γ or IL-10 (p = .64 and p = .97, respectively).
Table 3. Cytokine production in Flu B- and CD3/CD28-stimulated PBMC
Figure 3. Correlation Analysis of Cytokine Secretion in the Supernatants of PBMC Stimulated with Flu B and CD3/CD28. The Pearson correlation, R, is shown for each diagnostic group. There were no significant differences in the correlation between diagnostic groups for IFN-γ or IL-10 (p = .64 and p = .97, respectively). Note: Y-axis ranges differ by cytokine. Annotations indicate correlations and 95% confidence intervals
Flow cytometric analysis of APC activation and cytokine production in response to flu B ex vivo stimulation
summarizes the differences in APC cytokines and activation markers between AD and Non-AD in response to Flu B ex vivo stimulation. Compared with Non-AD, AD had significantly lower dendritic cell (DC) production of IL-12 (p = .04), and monocyte production of IL-1β and IL-6 (p = .03 and p = .04, respectively). In addition, DC production of IL-1β and IL-6 were marginally lower in AD compared with Non-AD (p = .08 and p = .09, respectively). Overall, responses tended to be reduced both in DC and monocytes of AD compared with Non-AD without always reaching statistical significance.
Table 4. APC responses to Flu B ex vivo stimulation in AD and NA
Predictors of antibody and T cell responses to Flu B in AD and non-AD IIV recipients
We sought to identify the factors associated with protective Flu B responses in Non-AD and AD using predictive modeling. The outcome measures were antibody responses measured by HAI and T cell responses measured by IFN-γ ELISpot, both of which have been previously shown to correlate with protection against influenza infection. The results presented in show that high Flu B-specific HAI titers before vaccination were predicted by low IL-10 production by CD8 + T cells in Flu B-stimulated PBMC cultures. After vaccination, additional significant predictors of high responses were identified, including high Flu B-specific IL-13 secretion in culture supernatants and low CD4 + T cell production of IL-21. CD8 + T cell production of IFN-γ had conflictive results, including high antibody titers being predicted by low production of IFN-γ by CD8+ CLA+ proliferating T cells and by high production of IFN-γ by CD8+ CLA+ total T cells. Predictors of high Flu B-specific ELISpot responses before vaccination were high Flu B-specific IL-10 and IL-13 secretion in culture supernatants and decreased PDL1 expression in monocytes. After vaccination, additional predictors of high ELISpot were high Flu B-specific CD8 + T cell production of IL-21, monocyte production of IL-12 and supernatant concentrations of IL-29. Univariate correlations between each predictor and outcome are included in Supplementary Table 1.
Table 5. Multivariate modeling1 to predict HAI and IFN-γ to Flu B at day 0 and day 28
Discussion
We did not find significant increases in response to IIV in the number of Flu B-specific T cells secreting IFN-γ measured by ELISpot regardless of the route of administration or the AD status of the participants. IIV is not a strong immunogen for T cell immunity, but significant increases after IIV administration have been previously shown in young adults Citation11 Generally, T cell responses to IIV have been more readily demonstrated in vaccinees with low responses before immunization.Citation11 Although AD participants in our study had marginally lower T cell immunity before vaccination compared with NA, we did not observe appreciable differences in responses to the vaccine. It is important to note that the parent study did not show differences in Flu B HAI titers before vaccination between AD and Non-AD participants, suggesting that lower Flu B-specific T cell responses at baseline in AD participants could not be ascribed to lower past exposure to Flu B.Citation6
Flu B-specific T cell responses before vaccination were further confirmed by measuring cytokine secretion in the supernatants of PBMC cultures stimulated with Flu B, which showed marginally lower IFN-γ and IFN-α in AD compared with NA. Nonspecific stimulation of T cells with anti-CD3/CD28 mAbs confirmed the trend in lower IFN-γ production in AD participants, but did not show differences in IFN-α secretion. This was not surprising, since IFN-α is primarily produced by APC, which do not respond to CD3/CD28 stimulation. Notably, the correlation of IFN-γ secretion in Flu B and CD3/CD28 cultures was only moderate. Collectively, these data suggested that APC stimulation in response to Flu B may play a role in the differences between Non-AD and AD T cell responses to Flu B before vaccination.
Additional flow cytometric studies of Flu B-stimulated APC showed significantly lower proportions of IL-12-secreting DC and IL-1β- and IL-6-secreting monocytes and marginally lower proportions of IL-1β- and IL-6-secreting DC in AD compared with NA. This observation further supported the notion that AD had defective APC responses to Flu B. These findings were in accordance with our previous studies comparing AD and Non-AD responses to HSV.Citation8 HSV causes high morbidity erythema multiforme in AD, but not in NA. It had been proposed that defective T cell responses in AD allow the virus to disseminate and cause the typical erythema multiforme skin lesions. However, we showed that APC dysfunction played an important role in attenuating T cell immunity against HSV.
To identify the T cell and APC markers with the highest potential to affect antibody and T cell responses to Flu B, we used a Lasso analysis, which has the ability to select in an unbiased fashion determining variables interdependent or not. The model selected high proportions of IL10-producing CD8+ regulatory T cells (Treg) pre-vaccination as a predictor of low Flu B-specific antibody titers before and after vaccination. This finding underscored the inhibitory role of CD8+ Treg on B cell function. The model also selected high baseline Flu B-specific CD4+ IL21-producing T follicular helper cells (Tfh) and CD8+ IFN-γ-producing Th1 cells as negative predictors of the antibody responses to IIV. IIV generates Th1- and Tfh-dependent B cell responses and, therefore, the negative association was unexpected. Further studies are needed to confirm the results of the Lasso analysis and to understand the feedback loop linking high Th1 and Tfh responses pre-vaccination with low antibody responses to IIV.
For Flu B-specific Th1 responses measured by IFN-γ ELISpot, the model selected IL-10 and IL-13 secretion in Flu B-stimulated PBMC culture supernatants as positive predictors and PDL-1 expression on monocytes as a negative predictor of both pre- and post-vaccination responses. We previously showed that Th1, Th2 and Treg responses after IIV administration are positively correlated.Citation12,Citation13 We interpreted the association of the Flu B specific T cell subsets in this study as further evidence of this association. PDL-1 is a regulatory ligand that binds to PD-1 expressed on T cells and inhibits T cell activation.Citation14 Thus, the negative association of PDL-1 expression and IFN-γ SFC indicated the role of regulatory APC responses inhibiting Th1 responses ex vivo in PBMCs collected pre-vaccination, and also in vivo, by down regulation of Th1 responses to the vaccine. High Flu B-specific IFN-γ SFC after vaccination were also predicted by high IL-29 secretion in Flu B-stimulated culture supernatant and high proportions of Flu B-specific CD8+ Tfh and IL12+ monocytes before vaccination. Both IL-29 and IL-12 are cytokines in the Th1 pathway, and their association with IFN-γ responses after vaccination reflects their stimulatory action in vivo. The positive association of the proportion of Flu B-specific Tfh before vaccination with IFN-γ responses to the vaccine contrasts the negative association with antibody responses suggesting a feed-back loop that needs further investigation.
Our study was limited by the relatively small number of participants, which may have contributed to the difficulty in achieving statistical significance for many of the immune function differences between AD and Non-AD.
In conclusion, there were significant differences in APC functionality in AD and Non-AD participants, which may have biological relevance, since APC responses in the Th1 pathway were associated with T cell responses to vaccination in AD and Non-AD individuals. Differences in APC function between AD and Non-AD individuals may extend to responses to other vaccines and/or infections and may also contribute to the AD pathogenesis.
Disclosure of potential conflicts of interest
No potential conflicts of interest were disclosed.
Supplemental Material
Download MS Word (30.6 KB)Acknowledgments
Dr. Donald Y.M. Leung, Stephanie Lussier, and Brett Jepson had full access to all of the data in the study and take responsibility for the integrity of the data and the accuracy of the data analysis. Study concept and design: Donald Leung, Gloria David, Margarita Gomez Lorenzo, Jon Hanifin, and Adriana Weinberg. Acquisition, analysis, and interpretation of data: Donald Leung, Stephanie Lussier, Agustin Calatroni, Brett Jepson, Gloria David, and Adriana Weinberg. Drafting of the manuscript: Emile Jalbert, Donald Leung, Brett Jepson, Gloria David, Agustin Calatroni, Stephanie Lussier, and Adriana Weinberg. Critical revision of the manuscript for important intellectual content: Donald Leung and Adriana Weinberg. Statistical analysis: Brett Jepson, Stephanie Lussier, Agustin Calatroni, Emilie Jalbert, and Adriana Weinberg. Obtained funding: Donald Leung. Administrative, technical, or material support: Donald Leung, Jennifer Canniff, Margarita Gomez Lorenzo, Jon Hanifin, and Amy Paller. Study supervision: Donald Leung, Lisa Beck, Gloria David, Jon Hanifin, Amy Paller, Lynda Schneider and Adriana Weinberg. The authors acknowledge Joy Laurienzo Panza, RN, NIAID project manager to this study; Marshall Plaut, MD, NIAID project scientist and reviewer; Meghan McGinn at Rho, Inc. for study coordination; Barbara Jane Bate at University of Colorado Denver for laboratory analyses; and the following study coordinators for their hard work in recruiting human participants for this study: at National Jewish Health, Patricia Taylor, FNP-C, Gayle Spears, PA-C/CHA, Caroline Bronchick, RN, and Trudi Madigan, RN (supported in part by NIH/NCATS Colorado CTSI Grant number UL1 TR002535); at University of Rochester Medical Center, Jean Sauvain, Caitlyn Eberle and Kristopher Denby, MD; at Boston Children’s Hospital, Irene Borras-Coughlin; at Oregon Health & Sciences University, Emma Hill, and at Northwestern University Feinberg School of Medicine, Victoria Godinez-Puig; and the nurses at Clinical Trial Research Centers. Clinical Trial Research Centers are supported in part by the Colorado Clinical and Translational Science Award/Colorado Clinical & Translational Sciences Institute grant UL1 RR025780 from National Center for Research Resources/NIH and from NIH/National Center for Advancing Translational Sciences (grant UL1 TR000154). Additionally, the authors wish to acknowledge The Edelstein Family Foundation for their generous support of our work. This work was conducted with support from Harvard Catalyst | The Harvard Clinical and Translational Science Center (National Center for Research Resources and the National Center for Advancing Translational Sciences, NIH Award UL1 TR001102) and financial contributions from Harvard University and its affiliated academic healthcare centers. The content is solely the responsibility of the authors and does not necessarily represent the official views of Harvard Catalyst, Harvard University and its affiliated academic healthcare centers, or the NIH.
Supplementary material
Supplemental data for this article can be accessed online at http://dx.doi.org/10.1080/21645515.2020.1747374.
Additional information
Funding
References
- Centers for Disease C, Prevention. Estimates of deaths associated with seasonal influenza — United States, 1976-2007. MMWR Morbidity Mortality Weekly Rep. 2010;59:1057–62.
- Belshe RB, Gruber WC, Mendelman PM, Cho I, Reisinger K, Block SL, Wittes J, Iacuzio D, Piedra P, Treanor J, et al. Efficacy of vaccination with live attenuated, cold-adapted, trivalent, intranasal influenza virus vaccine against a variant (A/Sydney) not contained in the vaccine. J Pediatr. 2000;136(2):168–75. doi:10.1016/S0022-3476(00)70097-7.
- Hickling JK, Jones KR, Friede M, Zehrung D, Chen D, Kristensen D. Intradermal delivery of vaccines: potential benefits and current challenges. Bull World Health Organ. 2011;89:221–26. doi:10.2471/BLT.10.079426.
- Kenney RT, Frech SA, Muenz LR, Villar CP, Glenn GM. Dose sparing with intradermal injection of influenza vaccine. N Engl J Med. 2004;351:2295–301. doi:10.1056/NEJMoa043540.
- Roukens AH, Vossen AC, Bredenbeek PJ, van Dissel JT, Visser LG. Intradermally administered yellow fever vaccine at reduced dose induces a protective immune response: a randomized controlled non-inferiority trial. PLoS One. 2008;3:e1993. doi:10.1371/journal.pone.0001993.
- Leung DYM, Jepson B, Beck LA, Hanifin JM, Schneider LC, Paller AS, Monti K, David G, Canniff J, Lorenzo MG, et al. A clinical trial of intradermal and intramuscular seasonal influenza vaccination in patients with atopic dermatitis. J Allergy Clin Immunol. 2017;139(5):1575–82 e8. doi:10.1016/j.jaci.2016.12.952.
- Shaw TE, Currie GP, Koudelka CW, Simpson EL. Eczema prevalence in the United States: data from the 2003 national survey of children’s health. J Invest Dermatol. 2011;131:67–73. doi:10.1038/jid.2010.251.
- Leung DY, Gao PS, Grigoryev DN, Rafaels NM, Streib JE, Howell MD, Taylor PA, Boguniewicz M, Canniff J, Armstrong B, et al. Human atopic dermatitis complicated by eczema herpeticum is associated with abnormalities in IFN-gamma response. J Allergy Clin Immunol. 2011;127(965–73):e1–5. doi:10.1016/j.jaci.2011.02.010.
- Rajka G, Langeland T. Grading of the severity of atopic dermatitis. Acta Derm Venereol Suppl (Stockh). 1989;144:13–14.
- Friedman J, Hastie T, Tibshirani R. Regularization paths for generalized linear models via coordinate descent. J Stat Softw. 2010;33(1):1–22. http://www.jstatsoft.org/v33/i01/.
- Hammitt LL, Bartlett JP, Li S, Rahkola J, Lang N, Janoff EN, Levin MJ, Weinberg A. Kinetics of viral shedding and immune responses in adults following administration of cold-adapted influenza vaccine. Vaccine. 2009;27(52):7359–66. doi:10.1016/j.vaccine.2009.09.041.
- Weinberg A, Muresan P, Fenton T, Richardson K, Dominguez T, Bloom A, Petzold E, Anthony P, Cunningham CK, Spector SA, et al. High proportions of regulatory B and T cells are associated with decreased cellular responses to pH1N1 influenza vaccine in HIV-infected children and youth (IMPAACT P1088). Hum Vaccin Immunother. 2013;9(5):957–68. doi:10.4161/hv.23774.
- Curtis DJ, Muresan P, Nachman S, Fenton T, Richardson KM, Dominguez T, Flynn PM, Spector SA, Cunningham CK, Bloom A, et al. Characterization of functional antibody and memory B-cell responses to pH1N1 monovalent vaccine in HIV-infected children and youth. PLoS One. 2015;10(3):e0118567. doi:10.1371/journal.pone.0118567.
- Duraiswamy J, Kaluza KM, Freeman GJ, Coukos G. Dual blockade of PD-1 and CTLA-4 combined with tumor vaccine effectively restores T-cell rejection function in tumors. Cancer Res. 2013;73:3591–603. doi:10.1158/0008-5472.CAN-12-4100.