
ABSTRACT
The manufacture of the UK Anthrax vaccine (AVP) focuses on the production of Protective Antigen (PA) from the Bacillus anthracis Sterne strain. Although used for decades, several of AVP’s fundamental properties are poorly understood, including its exact composition, the extent to which proteins other than PA may contribute to protection, and whether the degree of protection varies between individuals.
This study involved three innovative investigations. Firstly, the composition of AVP was analyzed using liquid chromatography tandem mass-spectrometry (LC-MS/MS), requiring the development of a novel desorption method for releasing B. anthracis proteins from the vaccine’s aluminum-containing adjuvant. Secondly, computational MHC-binding predictions using NetMHCIIpan were made for the eight most abundant proteins of AVP, for the commonest HLA alleles in multiple ethnic groups, and for multiple B. anthracis strains. Thirdly, antibody levels and toxin neutralizing antibody (TNA) levels were measured in sera from AVP human vaccinees for both PA and Lethal Factor (LF).
It was demonstrated that AVP is composed of at least 138 B. anthracis proteins, including PA (65%), LF (8%) and Edema Factor (EF) (3%), using LC-MS/MS. NetMHCIIpan predicted that peptides from all eight abundant proteins are likely to be presented to T cells, a pre-requisite for protection; however, the number of such peptides varied considerably between different HLA alleles.
These analyses highlight two important properties of the AVP vaccine that have not been established previously. Firstly, the effectiveness of AVP within humans may not depend on PA alone; there is compelling evidence to suggest that LF has a protective role, with computational predictions suggesting that additional proteins may be important for individuals with specific HLA allele combinations. Secondly, in spite of differences in the sequences of key antigenic proteins from different B. anthracis strains, these are unlikely to affect the cross-strain protection afforded by AVP.
1. Introduction
Bacillus anthracis is a highly virulent bacterium that is responsible for causing anthrax. Anthrax spores survive in the environment for a long time, are easily transmitted, and are associated with high rates of morbidity and mortality. For these reasons, anthrax has gained increasing attention as a potential bioterrorism agent. As a consequence, government agencies are interested in stockpiling anthrax vaccines that exhibit long-term stability and efficacy as a means to safeguard public health through mass immunization, should the need arise.
There are two widely used vaccines against anthrax: the US Anthrax Vaccine Adsorbed (AVA) vaccine, and the UK Anthrax Vaccine Precipitate (AVP) vaccine. AVP, which has been in production since the 1950s and is manufactured by Porton Biopharma Ltd (PBL), is the focus of this research. AVP is an alum precipitate of a sterile culture filtrate of the B. anthracis Sterne (34F2) strain. Previous proteomic studiesCitation1,Citation2 have shown that AVP contains at least 21 proteins including Protective Antigen (PA), Lethal Factor (LF) and Edema Factor (EF). However, the exact composition of AVP remains unknown, although – perhaps significantly – it is thought to contain more LF than AVA, based on antibody titers measured in sera from both animal and human studies.Citation3–5
Numerous studies have confirmed that PA is the principal immunogen of both AVP and AVA, with anti-PA antibody and Toxin Neutralizing Antibody (TNA) levels generally accepted as correlates of protection when measuring vaccine efficacy.Citation3,Citation6,Citation7 However, several studies have also highlighted the additional protective role of LF, either because it enhances the PA-specific antibody response,Citation3,Citation8,Citation9 or via the independent protective role of anti-LF antibodies.Citation3,Citation10,Citation11 Additionally, EF has been shown to protect against B. anthracis spore challenge in animal studies,Citation12,Citation13 and it is known that anti-EF antibodies can neutralize Edema Toxin (ET).Citation14 Other B. anthracis proteins such as cell wall proteins have also been shown to trigger a protective immune response against anthrax in mice.Citation15 However, it is currently unknown whether AVP proteins other than PA have a significant protective role in humans.
In anthrax research, there has been a heavy reliance on animal studies, owing to the life-threatening nature of B. anthracis and the low rates of human infection. Large-scale studies of human AVA vaccinees are possible because of previous mandatory US military vaccination programs, whereas comparable studies for AVP are infeasible, given the comparatively smaller number of AVP vaccinees. One AVA study involving 1000 vaccinated individuals concluded that African Americans have lower toxin neutralizing antibodies than European Americans,Citation16 raising the possibility that genetic differences play a role in the immune response to AVA and calling into question the relevance of non-human studies. Given their known associations with ethnicity and with differential responses to vaccination, HLA haplotypes are prime candidates as potential genetic factors underpinning the stratification of human responses to anthrax vaccines.
A multi-stranded investigation of AVP is presented here. Firstly, the composition of AVP was determined using a label-free quantitative proteomic liquid chromatography tandem mass-spectrometry (LC-MS/MS) approach. This required the development of a novel desorption method for releasing B. anthracis proteins from the vaccine’s aluminum-containing adjuvant. Adjuvants are used to enhance the immune response and increase vaccine stability,Citation17–21 with potassium aluminum sulfate (alum) used as an adjuvant in AVP. During the final steps of the AVP manufacturing process, the proteins in sterile Culture Filtrate (CF) are precipitated under gravity by adding aluminum potassium sulfate solution. The supernatant is discarded such that the bulk vaccine precipitate is 15x concentrated. The bulk vaccine concentrate is diluted with sterile saline to achieve 5x concentrated final product (Unpublished information).
Secondly, a computational investigation of AVP immunogenicity was carried out. Computational MHC-binding predictions using NetMHCIIpan were made for the eight most abundant proteins from AVP (as determined using LC-MS/MS studies), for the commonest HLA alleles in multiple ethnic groups, and for multiple B. anthracis strains. Thirdly, a small proof-of-concept in vitro study was designed to characterize the immune response from PA and LF in human AVP vaccinees. Antibody levels and toxin neutralizing antibody (TNA) levels were measured in sera from AVP human vaccinees for both PA and LF.
2. Materials and methods
2.1. Desorption methods
Proteins bound to alum are not suitable for liquid chromatography tandem mass-spectrometry (LC-MS/MS) proteomic analysis, as alum would interfere and suppress the signal observed during the MS analysis. Hence, a desorption method was developed to release or desorb proteins in AVP from alum. AVP was obtained from PBL, nine desorption methods using salts and surfactants were assessed for recovery of proteins using the Micro BCA assay (Thermo Fisher, UK) and a size-based separation using 1D gel electrophoresis. Sodium hydroxide (NaOH), sodium citrate, succinic acid, sodium phosphate dibasic, guanidine hydrochloride, urea, ammonium sulfate, cetylpyridinium chloride (CPC) and ethylenediaminetetraacetic acid (EDTA) were purchased from Sigma Aldrich, UK. RapiGest™ SF surfactant was purchased from Waters, UK and ProteaseMAX™ surfactant was purchased from Promega, UK. Regenerated cellulose centrifugal concentrators were purchased from Merck Millipore, UK. Protein estimation Micro BCA kit was purchased from ThermoFisher, UK.
An identical volume of AVP (600 µL) was used to investigating the following nine desorption methods:
1) 5 µL of 10 M sodium hydroxide was added. The solution was vortexed for 30 seconds until it turned clear. In order to neutralize the solution, 10 µL of 3 M sodium citrate was added immediately; 2) 500 µL of 250 mM succinic acid, pH 3.5 was added and incubated for 30 min at room temperature (RT) shaking;Citation20 3) 500 µL of 0.66 M sodium phosphate dibasic, 3 mM EDTA, pH 7.0 was added and incubated for 3 hours at 37°C, shaking;Citation22 4) 1 mg of RapiGest™ SF surfactant was dissolved in AVP and incubated at 37°C for 24 hours; 5) 1 mg of ProteaseMAX™ surfactant was dissolved in AVP and incubated at 37°C for 24 hours; 6) 500 µL of 4 M guanidine hydrochloride, pH 7.0 was added and incubated for 24 hours at RT, shaking; 7) 500 µL of 8 M urea, pH 7.0 was added and incubated for 24 hours at RT, shaking; 8) 500 µL of 1 M ammonium sulfate, 27 mM CPC, pH 7.0 was added and incubated for 24 hours at RT, shaking ;Citation21 9) 500 µL of 0.66 M sodium phosphate dibasic, 3 mM EDTA, pH 7.0 and 1 mg of RapiGest™ SF surfactant was added and incubated for 3 hours at RT, shaking.Citation22
After the desorption process was completed, each solution was centrifuged at 14,000xg for 2 min. The supernatants were transferred into regenerated cellulose centrifugal filter units and concentrated to ~100 µL by centrifuging at 14,000xg. The solutions were buffer exchanged into phosphate buffer saline (PBS – 100 mM Sodium Phosphate and 150 mM NaCl, pH 7.2) five times by adding 400 µL of PBS each time. The final volume of each sample was ~100 µL. The protein concentration of each sample was determined by Micro BCA kit using the manufacturer’s recommended procedure. Desorbed proteins were analyzed by 1D gel electrophoresis. The samples for 1D gel electrophoresis were treated as follows: 10 µL of 4x LDS was added to 30 µL of sample and incubated at 70°C for 10 min. Twenty microliters of each sample was loaded on 4–12% bis-tris gel and run for 45 minutes at 200 V using MES running buffer. The gel was stained using Coomassie blue stain.
Recovery of desorbed proteins was calculated by subtracting the discarded supernatant concentration from culture filtrate giving a theoretical estimate of the concentration of AVP precipitate. The percentage of recovery of desorbed proteins was calculated by measuring the difference between the estimated and quantified protein concentrations.
2.2. Proteomics
2.2.1. Sample preparation
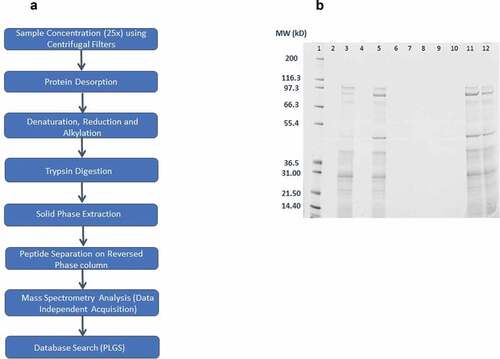
The composition of Culture Filtrate (CF) and desorbed AVP was determined using a label-free quantitative proteomic LC-MS/MS approach. CF and AVP samples were obtained from PBL. shows the workflow of sample preparation and LC-MS/MS analysis for CF and AVP. In summary, AVP was desorbed using 0.66 M Sodium Phosphate, 1 mM EDTA, pH 7.0 buffer for 3 hours at 37°C. The samples were incubated with 8 M urea in 50 mM Ammonium Bicarbonate (Sigma Aldrich, UK), at 40°C for 10 minutes shaking. Subsequently, the samples were treated with 10 mM DTT (Sigma Aldrich, UK) at 56°C for 30 minutes, shaking; and 20 mM Iodoacetamide (IAA) (Sigma Aldrich, UK) in the dark at RT for 30 minutes. The samples were diluted in 50 mM Ammonium Bicarbonate solution such that final urea concentration reduced from 8 M to 1 M. The solubilized samples were digested by incubating with sequencing-grade modified trypsin (Promega, UK) at 1:50 trypsin: protein concentration at 37°C for 16 hours, with shaking. The samples were dried in SpeedVac system at 35°C. The samples were then desalted using Empore SPE Disks C18, diam. 47 mm (Sigma, UK), then dried in SpeedVac system at 35°C. The dried samples were resuspended in LC-MS running buffer (3% acetonitrile, 0.1% formic acid in LC-MS grade water; all from Thermo Fisher, UK). An internal standard of trypsin digested BSA (125 fmoles) (ThermoFisher, UK) was spiked into the samples.
Figure 1. (A) Workflow of sample preparation and LC-MS/MS analysis for CF and AVP; (B) Comparison of Desorption methods – size-based separation of desorbed AVP proteins on 1D gel electrophoresis (Lane 1– Molecular Weight Std, Lane 2 – Blank, Lane 3 – Sodium Hydroxide and Sodium Citrate method, Lane 4 – Succinic Acid method, Lane 5 – Sodium phosphate dibasic, EDTA method, Lane 6 – RapiGest™ SF surfactant method, Lane 7 – ProteaseMAX™ surfactant method, Lane 8 – Guanidine hydrochloride method, Lane 9 – Blank, Lane 10 – Urea method, Lane 11 – Ammonium sulfate, CPC method, Lane 12 – RapiGest™ SF surfactant, EDTA method)
2.2.2. Liquid chromatography–tandem mass spectrometry
Separation of peptides was performed using a Waters NanoAcquity Ultra-Performance Liquid Chromatography system and data acquired in MSE based Data Independent Acquisition (DIA) mode.Citation23 In summary, the samples were desalted using a reverse-phase SYMMETRY C18 trap column (180μm internal diameter, 20mm length, 5μm particle size, Waters, UK) at a flow rate of 8μL/min for 2 minutes. Peptides were separated by a linear gradient (0.3μL/min, 35°C column temperature; 97-60% Buffer A over 60 minutes) using a custom-made Acquity UPLC M-Class Peptide BEH C18 column (130Å pore size, 75μm internal diameter, 400mm length, 1.7μm particle size, Waters, UK). [Glu1]-fibrinopeptide B (GFP, Waters, UK) was used as lockmass at 100fmol/µL. Lockmass solution was delivered from an auxiliary pump operating at 0.5µL/min to a reference sprayer sampled every 60 seconds.
The nanoLC was coupled online through a nanoflow sprayer to a Q-ToF hybrid mass spectrometer (HDMS Synapt G2-Si; Waters, UK). The instrument was operated in positive ion mode and tuned to a mass resolution of ~20,000 (full width at half maximum). The ToF analyser was externally calibrated with fragment ions of [Glu1]-fibrinopeptide B (GFP, Waters, UK) for m/z range of 175.11 to 1285.54.
Data were lockmass-corrected with the monoisotopic mass of the doubly charged precursor of GFP (785.8426 m/z), post-acquisition. Accurate mass measurements were made using a data-independent mode of acquisition.Citation24 Briefly, energy in the collision cell was alternated between low energy (4 eV) and high energy (energy ramp from 16 to 38 eV) modes every 0.6 seconds to acquire precursor and fragment ion spectra for retention time alignment and peptide sequencing during database processing. Measurements were made over an m/z range of 50–2000 Da. Each sample was analyzed in technical triplicates.
2.2.3. Database processing
Raw data were searched using PLGS v3.0.2 (Waters, UK). The raw data were lockmass-corrected, smoothed, background subtracted and deisotoped. The peptide and fragment ion retention times were aligned.Citation25 Data were searched against Uniprot complete protein database for Bacillus anthracis Sterne 34F2 strain. Carbamidomethyl-C and oxidation were specified as fixed and variable modifications, respectively. A maximum of two missed cleavages of the protease were allowed for semi-tryptic peptide identification. For peptide identification, three corresponding fragment ions were set as a minimum criterion whereas for protein identification a minimum of two corresponding peptide identification and seven fragment ions were required. Protein level FDR rate was maintained at 1% estimated based upon the number of proteins identified from a decoy database. The proteins were quantified using the Hi3 quantification method.Citation26
2.3. Computational studies
2.3.1. MHC class II epitope prediction
MHC class II predictions were carried out to identify 15-mer epitopes in eight proteins in AVP, using NetMHCIIpan 3.2.Citation27 The alleles for MHC II predictions were selected based on the data published by Wang et al.;Citation28 the 25 alleles result in >99% human population coverage. Python scripts were written to enable automation (supplemental information). Binding affinities of peptides with IC50 ≤ 50 nM cut off and ≤500 nM cut off were used to select strong and medium binding epitopes, respectively.Citation29
2.3.2. B. anthracis strain data
The PA, LF and EF protein sequences from known 33 B. anthracis strains were analyzed for identifying mutations using MegAlign software.Citation30 The list of all B. anthracis strains evaluated in the study are detailed in supplemental information, the genomic sequence data were obtained from the NCBI database.Citation31 Substitutions were then analyzed in the context of the MHC class II to see whether they changed the immunogenic properties of these proteins.
2.4. In vitro studies
2.4.1. Blood collection
Eight AVP vaccinated volunteers and two non-vaccinated control volunteers were recruited for the study. A total of 29 ml of blood was collected from each volunteer. Although the volunteers were not recruited based on their vaccination dates, details of their AVP vaccination history were taken.
2.4.2. Ethics statement
Human AVP vaccinees and healthy control volunteers based at PBL, Porton Down, participated in the context of a study protocol (Ref: R&D 325) approved by the PHE Independent ethics committee, UK; the subjects were all adults (both male and female) aged over 18 y and all provided written, informed consent.
2.4.3. HLA tissue typing
HLA Tissue typing analysis was contracted to Proimmune Ltd, UK. Blood (4 ml) was collected in K2EDTA tubes (Midmeds, UK) and stored at −80°C. The MHC II alleles for each donor for the 6x loci (2 x DRB1, 2 x DQB1 and 2 x DPB1) were reported.
2.4.4. Anti-PA and anti-LF IgG ELISA assay
Blood (5 ml) that was collected in clot activator coated tubes (Midmeds, UK) was centrifuged at 2,000 x g for 10 minutes. The supernatant was recovered and stored at −80°C for Anti-PA and Anti-LF IgG ELISA and TNA assay.
These tests were performed by Medical Interventions Group (MIG) at Public Health England (PHE), Porton Down. Briefly, 96-well plates (NUNC flat bottomed wells, ThermoFisher, UK) were coated overnight with 0.5 µg/mL of either purified rPA (E.coli derived, PHE, Porton Down) or rLF (B. anthracis derived, PHE, Porton Down), before addition of serial diluted human serum samples and reference (PHE, Porton Down). The reference serum was prepared by conversion of plasma collected from AVP vaccinated individuals (not originating from this study). Anti-human IgG Fcγ specific antibody conjugated to Alkaline Phosphatase (Jackson Immunoresearch, UK) was used to produce a colorimetric response proportional to the amount of PA or LF specific antibody when substrate (AP Yellow, BioFX & surmodics, UK) was added. Plates were read using a Versamax plate reader with SoftMax Pro 5.2 analysis software (Molecular Devices, UK). Each sample was assigned a titer against a five-parameter logistic human sera reference curve. The reference sera was assigned heuristic values of 960 U/ml (PA) and 500 U/ml (LF) based on the mean ED50 value (median effective dose) of multiple runs on previous occasions.
2.4.5. Toxin neutralization assay
Sera were serially diluted and incubated with Lethal Toxin (LT – formed by the association of PA and LF) (PHE, Porton Down) at a controlled concentration. This was transferred to 96-well plates seeded with a mouse macrophage cell line (J774A.1) known to be sensitive to anthrax toxin-mediated cytotoxicity. Cell survival was assessed through uptake of methylthiazolyldiphenyl-tetrazolium bromide (MTT, Sigma, UK) by surviving cells; this provided a colorimetric readout of survival. Plates were read using a Versamax plate reader with SoftMax Pro 5.2 analysis software (Molecular devices, US). Sample ED50 values (the dilution of serum required for a 50% reduction in cytotoxicity) were compared to a reference serum (PHE, Porton Down), which allows an NF50 (50% Neutralization Factor) value to be calculated for each sample. The reference serum was prepared by conversion of plasma collected from AVP vaccinated individuals (not originating from this study).
3. Results
3.1. Desorption methods
Several different salts and surfactants were investigated for the desorption of proteins from alum in AVP. shows the size-based separation of desorbed AVP proteins on 1D gel electrophoresis, using nine different desorption methods. The desorption methods with NaOH (Lane 3, ), EDTA (Lane 5, ), ammonium sulfate and CPC (Lane 11, ) and combination of RapiGest™ SF surfactant and EDTA (Lane 12, ) gave good recovery of desorbed proteins; the measured protein concentration of recovered proteins was 27.1, 18.6, 11.6 and 18.1 µg/mL using Micro BCA assay, respectively. The desorption methods with succinic acid (Lane 4, ), RapiGest™ SF surfactant (Lane 6, ), ProteaseMAX™ surfactant (Lane 7, ), guanidine hydrochloride (Lane 8, ) and urea (Lane 10, ) did not desorb AVP proteins from alum. This corroborated with the Micro BCA assay results.
Although the maximum desorption of proteins from alum in AVP was using the NaOH method, the higher molecular weight bands on the 1D gel (Lane 3, ) were faint in comparison to other methods. This confirms that the harsh conditions associated with NaOH degrades proteins. Hence, this method was not taken forward. The EDTA desorption reagent (Lane 5, ) gave good recovery of proteins. EDTA is probably responsible for chelating aluminum ions, thus enabling desorption of proteins from alum. The ammonium sulfate and CPC method produced a pellet in the sample after the desorption process. Although, the recovery of proteins was good from this method (11.6 µg/mL using Micro BCA method) and the protein bands are comparably dark on the gel (Lane 11, ); the method was thought to create repeatability issues due to pellet formation; hence, this method was not taken forward. The combination of RapiGest™ SF surfactant and EDTA (Lane 12, ) did not enhance the recovery of proteins in comparison to EDTA alone (Lane 5, ); hence, this method was also not taken forward.
Based on size-based separation of desorbed proteins () and Micro BCA assay results, 0.66 M Sodium Phosphate Dibasic, 3 mM EDTA, pH 7.0 was found to be the optimum desorption reagent for proteins in AVP. Nevertheless, further studies (comparing protein concentration of CF, discarded supernatant and desorbed AVP) revealed that the recovery of desorbed proteins from AVP using this method was between 40% and 60%.
3.2. Proteomics studies
3.2.1. Identification of proteins in CF and AVP
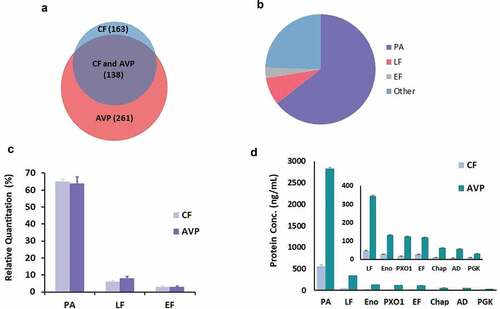
Based on the analysis of LC-MS/MS data using the B. anthracis proteome, a total of 163 and 261 proteins were identified in CF and AVP, respectively (). The complete list of proteins identified in CF and AVP is given in the supplemental information. A total of 138 proteins were found to be common to both CF and AVP. Two biological replicates were prepared from two batches of CF and AVP, with each sample analyzed by LC-MS/MS in triplicate. A maximum precision of 11% and 19% coefficient of variation (CV) was measured for the identification of proteins in the two batches of CF and AVP, respectively, including the biological replicates. More proteins were identified in AVP in comparison to CF, because AVP is five times more concentrated than CF, due to the alum precipitation step during AVP manufacture. Hence, low abundance proteins were identified in AVP that were not identified in CF. AVP samples had more variability in replicates, potentially due to the variability in the desorption process.
Figure 2. (A) Comparison of the number of proteins identified in two batches of AVP and CF using LC-MS/MS. 261 proteins were found in AVP, 163 proteins were found in CF, 138 proteins were found common in CF and AVP (Two biological replicates and three analytical replicates were performed); (B) Composition of AVP (PA was the principle component of the vaccine (64%), LF was found to be 8% and EF was found to be 3%, 258 proteins were found in lower abundances, comprising the other 25%) (Venn 2019); (C) Relative quantitation of PA, LF and EF was found similar in CF and AVP (Two biological replicates and three analytical replicates were performed). Error bars represent ± 1 Standard Deviation about the mean; (D) Top 8 most abundant proteins in CF and AVP (PA – Protective Antigen, LF – Lethal Factor, Eno – Enolase, PX01-90, EF – Edema Factor, Chap – Chaperonin 60, AD – Alcohol Dehydrogenae, PGK – Phosphoglycerate Kinase). Error bars represent ± 1 Standard Deviation about the mean
3.2.2. Relative quantitation of PA, LF and EF in CF and AVP
PA was found to be the most abundant protein in CF and AVP, followed by LF and EF (). For CF and AVP, PA accounted for 65% and 64% of total protein, respectively, LF accounted for 6% and 8%, respectively, and EF accounted for 3% of total protein in both. Repeatability for relative quantitation of PA, LF and EF proteins in two batches of CF and AVP was good, a maximum CV of 18% was measured, including two biological replicates and triplicate LC-MS/MS analysis ().
3.2.3. Absolute quantitation of proteins in CF and AVP
PA was found to be the most abundant protein in CF and AVP, followed by LF, enolase, PX01-90, EF, 60kD chaperonin, alcohol dehydrogenase and phosphoglycerate kinase. PA was measured to be 615 and 2831 ng/mL in CF and AVP; LF was measured to be 52 and 345 ng/mL in CF and AVP; EF was measured to be 30 and 119 ng/mL in CF and AVP, respectively (). A maximum of 25% CV was measured for the quantification of abundant proteins in two batches of CF, including two biological replicates. The repeatability of AVP biological replicates was poor and a CV of 15% was measured for PA (the most abundant protein in AVP), and approx. 40% for less abundant proteins. AVP samples had more variability in biological replicates, possibly due to the variability in the desorption process. The repeatability of the triplicate analysis of each AVP sample was <20%.
3.3. Computational studies
3.3.1. MHC II epitope prediction
MHC II epitopes were predicted using NetMHCIIpan for the eight most abundant proteins in AVP (identified by MS studies) and for 25 class II HLA alleles in order to assess the impact of allelic differences in human populations. Given the reasonable assumptions that a) epitope binding affinity is correlated with the strength of the immune response, and b) a larger proportion of peptides predicted to bind with moderate to high affinity (≤500 nM) are likely to be true epitopes than those predicted to bind with low affinity (≤5000 nM), only predicted epitopes with high and intermediate binding affinity were taken forward for analysis. Two IC50 binding thresholds advocated by the Immune Epitope Database (IEDB),Citation29 ≤50 nM and ≤500 nM, were adopted for predicted epitopes with high binding affinities (strong binders) and intermediate binding affinities (medium binders), respectively. The number of strong and medium-plus-strong binders for eight AVP proteins and 25 HLA alleles are shown in , respectively.
Table 1. Predicted number of strong binding MHC II epitopes, derived using NetMHCIIpan (IC50 cutoff of ≤50 nM)
Table 2. Predicted number of medium-plus-strong binding MHC II epitopes, derived using NetMHCIIpan (IC50 cutoff of ≤500 nM)
With respect to the eight AVP proteins and 25 HLA alleles investigated, LF and EF had the highest number of predicted class II strong binding epitopes overall, including the highest numbers for 8 and 6 of the 25 alleles, respectively (). PA, LF and EF proteins were predicted to have >5 strong binding epitopes for between 7 and 10 of the HLA alleles. The other five abundant proteins were predicted to have >5 strong binding epitopes for between 3 and 7 of the HLA alleles. This data suggests that different proteins in AVP may be contributing to a protective T cell response in different HLA alleles. For example, in individuals having HLA-DQA1*0501-DQB1*0301 allele, only four proteins (60 kDa chaperonin, alcohol dehydrogenase, enolase and phosphoglycerate kinase) have >5 strong binding epitopes ().
Additionally, PA, LF and EF were predicted to have >5 medium-plus-strong epitopes for all HLA alleles investigated, except alleles HLA-DQA1*0301-DQB1*0302 and HLA-DQA1*0401-DQB1*0402. It is notable that the 60 kDa chaperonin protein had a much higher number of predicted epitopes for both of these alleles (15 and 29 epitopes, respectively) (). Once again, LF and EF had the highest number of predicted class II strong-plus-medium binding epitopes overall, including the highest numbers for 13 and 6 of the 25 alleles, respectively ().
3.3.2. Efficacy of AVP against different B. anthracis strains
Multiple sequence alignments of PA, LF and EF protein sequences from 33 known B. anthracis strains were generated. These alignments revealed 3, 4 and 6 single amino acid differences for PA, LF and EF, respectively, between the vaccine (Sterne) strain and the other strains. NetMHCIIpan was used to make medium-plus-strong 15-mers epitope predictions spanning each of these substitutions. These predictions indicate that specific epitopes in the Sterne strain may be absent (i.e. the corresponding peptides occur as non-binders) or changed (i.e. the corresponding peptides contain a modified set of TCR-facing amino-acid residues) in other B. anthracis strains; and other B. anthracis strains may contain epitopes not present in the Sterne strain (i.e. with the corresponding Sterne strain peptides occurring as non-binders). The results are summarized in .
Table 3. Predicted medium-plus-strong binding MHC II epitope differences between the Sterne (vaccine) strain and other B. anthracis strains, derived using NetMHCIIpan (IC50 cutoff of ≤500 nM)
3.4. In vitro studies
The HLA types and immunization history of patients are shown in , and anti-PA antibody, anti-LF antibody and TNA levels are shown in .
Table 4. Patient HLA types immunization history
Table 5. Average anti-PA and anti-LF antibody titers, and TNA levels in blood sera of AVP vaccinees
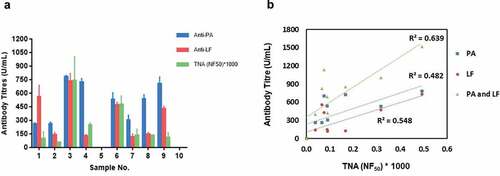
Anti-PA and anti-LF antibody titers and TNA levels measured in AVP vaccinees are highly variable (). As expected, the antibody titer and TNA levels in the control samples were below the detection limit (). An analysis of the vaccinee data in shows that there is no clear correlation between vaccinee immunization history (whether the number and/or timing of vaccinations) and antibody titer (whether anti-PA and/or anti-LF antibody titer), nor between anti-PA and/or anti-LF antibody titer and TNA level. Linear regression analysis showed positive correlation between PA, LF and PA+LF antibody titers and TNA levels in sera of AVP vaccinees – 0.482, 0.548 and 0.639, respectively ().
Figure 3. (A) End-point titers of serum IgG to recombinant Protective Antigen (PA) and recombinant Lethal Factor (LF) measured against a five-parameter logistic human sera reference curve and 50% neutralization factor (NF50) values for serum neutralization of Lethal Toxin compared to the reference serum determined in a J774A.1 macrophage-based Lethal Toxin neutralization assay (TNA) in AVP vaccinees (n = 10). Measurement of antibody levels was performed with at least four replicates, TNA levels were measured in duplicates. Data has been plotted with 95% confidence interval of the mean. Sample 5 and 10 are from control volunteers; (B) Linear regression showing correlation between serum PA, LF and PA+LF Antibody titers and TNA levels in AVP vaccinees was 0.482, 0.548 and 0.639 respectively
4. Discussion
4.1. Desorption of proteins from AVP
Nine different salt- and surfactant-based desorption methods were investigated for desorption of proteins from alum in AVP. The desorption method using 0.66 M Sodium Phosphate Dibasic, 3 mM EDTA, pH 7.0 was found to be the optimum desorption reagent for AVP. However, even this method only recovered between 40% and 60% of proteins from AVP. The low recovery of proteins from AVP is corroborated by similar findings by other groups investigating desorption of proteins from the closely related aluminum-based adjuvant Alhydrogel® (Brenntag Biosector, Denmark) (aluminum hydroxide). Alhydrogel adjuvants are more widely used; hence, several studies have reported the stability profile of Alhydrogel-based vaccines. Vassely et al.Citation20 have reported that due to chemical and physical changes in proteins adsorbed to Alhydrogel, the desorption of proteins from Alhydrogel is difficult. Another study has shown that the strength of the protein bound to Alhydrogel increases with time, and harsh desorption buffer conditions are required to recover proteins.Citation21 Our study also highlights the difficulty of analyzing alum-adsorbed vaccines.
4.2. Proteomic LC-MS/MS studies
Proteomic LC-MS/MS studies demonstrated that AVP is composed of 261 proteins, including PA (65%), LF (8%) and EF (3%). This method had showed good repeatability for relative quantitation of PA, LF and EF in complex AVP samples. A maximum CV of 18% was measured in AVP, including two biological replicates and triplicate LC-MS/MS analysis. Several other Hi3 quantitation studies have reported similar CVs for complex samples.Citation26,Citation32,Citation33 Further, out of the 21 proteins previously identified in AVP using 2D DIGE and MS studies by the NIBSC group,Citation1 17 proteins were common to proteins identified in this study.
In this study, PA was measured to be 615 and 2831 ng/mL in CF and AVP; LF was measured to be 52 and 345 ng/mL in CF and AVP, respectively. Previously, the average concentration of PA and LF was reported to be 3710 and 990 ng/ml, respectively, in culture supernatant, determined by ELISA (Unpublished data). The quantitation data for PA and LF using ELISA are significantly different from LC-MS/MS data in the present study. Although Hi3 label-free quantitation is deemed reliable for absolute quantitation of proteins,Citation26,Citation32 sample preparation steps involving desorption, sample concentration using centrifugal filters and solid phase extraction steps using C18 disks resulted in loss of proteins. Calculations showed that only 20% of the sample was recovered from LC-MS/MS experiment, based on the total protein estimation by Micro BCA assay. Sample manipulations in standard polypropylene eppendorfs also resulted in loss of protein; hence, Eppendorf LoBind microcentrifuge tubes were used. These losses explain the significant differences in absolute quantitation of CF using ELISA and LC-MS/MS methods. Ideally, sample preparation steps without desorption, concentration step and solid phase extraction should have been used to minimize the losses; however, this proved to be infeasible, as CF contains interfering substances that needed to be removed in order to achieve a reproducible LC-MS/MS analysis.
4.3. Computational studies
4.3.1. MHC II epitope prediction
In this study, we undertook a broad analysis of MHC class II binding spanning multiple B. anthracis strains and proteins, and multiple HLA alleles. It is important to be cautious when interpreting this data, as MHC-peptide binding affinity is just one of the many factors contributing to the T cell response, whereas MHC-peptide binding can be predicted with reasonable accuracy, in the present context there is no information about other important factors such as T cell precursor frequencyCitation34-36 and the breadth of T cell response.Citation37 The emerging picture from many independent research studies is a highly complex one; hence, within a given individual, specific epitopes may be protective whereas others may have a negative impact, for example, by blocking or slowing down the T cell response,Citation38,Citation39 or by inducing autoimmunity.Citation34,Citation39,Citation40 In principle and presumably in practice, the same epitope may lead to different outcomes in different individuals.
Further, NetMHCIIpan may be prone to either over- and under-prediction in specific cases. It has been observed, for example, that standard computational tools predict a subset of experimentally verified immunodominant peptides to bind too weakly to form epitopes.Citation41 However, in the context of this study, computational methods are of sufficient accuracy (with an area under the receiver operating characteristics curve [AUC] commonly greater that 0.8Citation27) to provide insights into the protective potential of distinct combinations of human HLA alleles and B. anthracis proteins – a combination that poses an unsolved challenge to experimental approaches.
Bearing these points in mind, there are nevertheless cautious but potentially important conclusions that can be drawn from the MHC II-peptide binding prediction. In interpreting these results, the confidence that a given antigen is likely to be protective with respect to a given HLA allele depends on the number of predicted epitopes, and in particular the number of epitopes predicted to bind with at least moderate strength. If the number of medium-plus-strong epitopes is low, there is a greater possibility that an individual will lack TCRs capable of binding to any of the peptide-MHC complexes associated with that combination of antigen and HLA allele.
NetMHCIIpan predicted that peptides from all eight proteins are likely to be presented to T cells; however, the number of such peptides varied considerably between different proteins and different HLA alleles ().
The “core” vaccine components PA, LF and EF were associated with >5 medium-plus-strong class II epitopes for all but two alleles, with LF having the largest number of epitopes overall (). The two notable exceptions were common HLA-DQ alleles HLA-DQA1*0301-DQB1*0302 and HLA-DQA1*0401-DQB1*0402; in both these cases, a much higher number of medium-plus-strong epitopes were associated with the 60 kDa Chaperonin protein (15 and 29 epitopes, respectively).
Given that individuals have multiple class II HLA alleles, the data in suggest that most individuals vaccinated with AVP have the potential to undergo a protective T cell response, although the proteins involved may vary between individuals. At the same, it appears that the efficacy of PA alone is not guaranteed for all individuals and that the presence of additional proteins may enhance the prospects that AVP affords broad protection. These results indicate the potential value of large-scale computational studies: even though individual predictions require validation; such studies are faster, cheaper and potentially more relevant than traditional animal studies.
4.3.2. Efficacy of AVP against different B. anthracis strains
Amino-acid differences in PA, LF and EF proteins between 33 B. anthracis strains and the vaccine (Sterne) strain were identified, and predictions were made using NetMHCIIpan to access their potential impact on MHC class II epitopes. Our analysis shows that a number of medium-plus-strong epitopes are missing, added or changed as a result of these differences (); however, the number of these predicted epitope transformations is very small in comparison to the total number of predicted Sterne strain epitopes for each of these proteins (). Consequently, we conclude that the differences between B. anthracis strains are unlikely to impact the cross-strain efficacy of the T cell response induced by the vaccine, although there remains a slim possibility that an individual’s immunodominant vaccine-induced response may be comparatively ineffective against a different strain if one or more critical epitopes are absent or changed within that strain.
4.4. In vitro studies
The anti-PA and anti-LF antibody titers and TNA levels measured in AVP vaccinees were highly variable (). Positive correlation was measured between PA, LF and PA+LF antibody titers and TNA levels in sera of AVP vaccinees – 0.482, 0.548 and 0.639, respectively ().
Although there is evidence that anti-PA antibodies and TNA levels have good correlation in human studies,Citation7,Citation42,Citation43 strong correlation was not observed in this study, potentially due to the small sample size. Previous studies have shown that antibody and TNA levels can be highly variable in AVA and AVP vaccinees.Citation3,Citation16,Citation43 Hence, it is likely that antibody and TNA levels are modulated by a range of other factors, such as age, gender, T cell and B cell memory, and genetic differences (including HLA allelic differences) in humans could be responsible for variable antibody levels.Citation14,Citation44,Citation45 Pajewski et al.Citation46 had investigated the impact of HLA polymorphisms on anti-PA antibody response in AVA vaccinees and reported that DRB1–DQA1–DQB1 haplotypes *1501–*0102–*0602, *0101–*0101–*0501 and *0102–*0101–*0501 were associated with significantly lower anti-PA antibody levels. However, it was not possible to identify such a correlation in this study.
Nevertheless, it is apparent that, whereas most vaccinees have higher anti-PA antibody titers than anti-LF titers, none of the vaccinees have low levels of anti-LF antibodies. Moreover, the TNA levels do not suggest that any vaccinees have negligible capacity to neutralize the anthrax toxin, although, in the absence of vaccinated humans becoming infected with B. anthracis, it is unclear what TNA levels are necessary to afford protection in humans.
Given the current lack of knowledge about the TNA levels needed to provide protection against B. anthracis in humans, anthrax vaccine studies have inevitable limitations, which are compounded here by the small-scale nature of the in vitro component of this study. Indeed, this represents the major limitation of this work; it is hoped that future studies will incorporate many more vaccinees and will explicitly evaluate the potential importance of HLA and protein specificity highlighted by the computational results presented here.
Notwithstanding these limitations, there are several important and novel conclusions. Although direct comparison with AVA is not possible, notably because of the different cell lines and different reference standard used for the TNA assay, it is interesting to contrast the results here with the large AVA study conducted by James and coworkers.Citation16 In that study, 69% of vaccinees had no detectable anti-LF antibodies, whereas all vaccinees in this study had moderate to high anti-LF titers. Although the composition of AVA is not published, AVA is thought to contain negligible amounts of LF, based on anti-LF antibody levels measured in several animal and human studies.Citation3–5 Additionally, over 40% of the AVA vaccinees were deemed to have low TNA levels; although it is hard to calibrate the TNA levels in this study, there is no evidence of very low TNA activity, with only a single individual having a TNA (NF50)*1000 below 50. Taken together, these observations suggest that anti-LF antibody response from AVP potentially enhances protection, and this is broadly consistent with previous observations about the efficacy of anti-LF antibodies in neutralizing lethal toxin (formed by the association of PA and LF)Citation10,Citation11 and about the speed and extent of the anti-LF antibody response in comparison to the anti-PA response in naturally acquired cutaneous anthrax patients.Citation44
Finally, this work demonstrates that AVP contains many protein components that have not previously been identified and suggests that several proteins not normally considered relevant – notably LF, EF, PX01-90 and 60KD Chaperonin – are reasonably abundant within AVP. Computational studies have shown that all of these proteins have the potential to afford protection for individuals with HLA allele combinations that are predicted to have relatively few PA epitopes. Further work is needed to validate this data experimentally using in vitro MHC molecules and antigen binding studies.
This work also shows the potential importance of considering inter-strain differences and identifies specific epitopes that are modified or absent in a subset of other B. anthracis strains. Further work is needed to identify whether these epitopes are important targets of the protective T cell response induced by the vaccine in some recipients.
Abbreviations
AD –Alcohol Dehydrogenase; AVA – Anthrax Vaccine Adsorbed; AVP – Anthrax Vaccine Precipitated; Chap. – 60 kDa Chaperonin; CF – Culture Filtrate; CPC - Cetylpyridinium Chloride, CV – Coefficient of variation; DIA – Data Independent Acquisition; DTT – Dithiothreitol; EDTA - Ethylenediaminetetraacetic Acid; EF – Edema Factor; ET – Edema toxin; Eno – Enolase; FDR – False Discovery Rate; GFP - [Glu1]-fibrinopeptide B; HLA – Human Leukocyte Antigen, IgG – Immunoglobulin G; IAA – Idoacetamide; LC-MS/MS – Tandem Mass Spectrometry; LF – Lethal Factor; LT – Lethal Toxin; MHC – Major Histocompatibility Complex; MIG – Medical Interventions Group; MTT - methylthiazolyldiphenyl-tetrazolium bromide; NaCl – Sodium Chloride; NaOH – Sodium Hydroxide; NIBSC – National Institute of Biological and Control Standards; PA - Protective Antigen; PBL – Porton Biopharma Ltd.; PBS – Phosphate Buffered Saline; PHE – Public Health England; PGK – Phosphoglycerate Kinase; PX01 – PX01-90, rPA – recombinant Protective Antigen; rLF – recombinant Lethal Factor; RT – room temperature; ToF – Time of Flight; TNA – Toxin Neutralisation Assay.
Disclosure of potential conflicts of interest
No potential conflicts of interest were disclosed.
Supplemental Material
Download MS Word (43 KB)Acknowledgments
We would like to thank Roger Hinton, Managing Director of PBL, for making facilities and funds available for this work. The G2-Si ion mobility mass spectrometer was purchased with a grant from the Wellcome Trust (104913/Z/14/ZBM). We would like to thank Diane Williamson at DSTL, Porton Down, for helpful discussions and guidance for the in vitro studies. Further thanks go to MIG Group in Public Health England for performing ELISA and TNA assays and to the entire Development team at PBL.
Supplementary material
Supplemental data for this article can be accessed online at http://dx.doi.org/10.1080/21645515.2020.1799668.
References
- Whiting G, Wheeler JX, Rijpkema S. Identification of peptide sequences as a measure of Anthrax vaccine stability during storage. Hum Vaccin Immunother. 2014;10:1669–81. doi:10.4161/hv.28443.
- Whiting GC, Rijpkema S, Adams T, Corbel MJ. Characterisation of adsorbed anthrax vaccine by two-dimensional gel electrophoresis. Vaccine. 2004;22:4245–51. doi:10.1016/j.vaccine.2004.04.036.
- Dumas EK, Garman L, Cuthbertson H, Charlton S, Hallis B, Engler RJM, Choudhari S, Picking WD, James JA, Farris AD, et al. Lethal factor antibodies contribute to lethal toxin neutralization in recipients of anthrax vaccine precipitated. Vaccine. 2017;35:3416–22. doi:10.1016/j.vaccine.2017.05.006.
- Turnbull PC. Anthrax vaccines: past, present and future. Vaccine. 1991;9:533–39. doi:10.1016/0264-410x(91)90237-z.
- Turnbull PC, Leppla SH, Broster MG, Quinn CP, Melling J. Antibodies to anthrax toxin in humans and guinea pigs and their relevance to protective immunity. Med Microbiol Immunol. 1988;177:293–303. doi:10.1007/BF00189414.
- Chen L, Schiffer JM, Dalton S, Sabourin CL, Niemuth NA, Plikaytis BD, Quinn CP. Comprehensive analysis and selection of anthrax vaccine adsorbed immune correlates of protection in rhesus macaques. Clin vaccine immunol. 2014;21(11):1512–20. doi:10.1128/CVI.00469-14.
- Reuveny S, White MD, Adar YY, Kafri Y, Altboum Z, Gozes Y, Kobiler D, Shafferman A, Velan B. Search for correlates of protective immunity conferred by anthrax vaccine. Infect Immun. 2001;69(5):2888–93. doi:10.1128/IAI.69.5.2888-2893.2001.
- Chen Z, Moayeri M, Crown D, Emerson S, Gorshkova I, Schuck P, Leppla SH, Purcell RH. Novel chimpanzee/human monoclonal antibodies that neutralize anthrax lethal factor: evidence for possible synergy with anti-pa antibody. Infect Immun. 2009;77:3902–08. doi:10.1128/IAI.00200-09.
- Pezard C, Weber M, Sirard JC, Berche P, Mock M. Protective immunity induced by Bacillus anthracis toxin-deficient strains. Infect Immun. 1995;63:1369–72. doi:10.1128/IAI.63.4.1369-1372.1995.
- Albrecht MT, Li H, Williamson ED, LeButt CS, Flick-Smith HC, Quinn CP, Westra H, Galloway D, Mateczun A, Goldman S, et al. Human monoclonal antibodies against anthrax lethal factor and protective antigen act independently to protect against Bacillus anthracis infection and enhance endogenous immunity to anthrax. Infect Immun. 2007;75(11):5425–33. doi:10.1128/IAI.00261-07.
- Staats HF, Alam SM, Scearce RM, Kirwan SM, Zhang JX, Gwinn WM, Haynes BF. In vitro and in vivo characterization of anthrax anti-protective antigen and anti-lethal factor monoclonal antibodies after passive transfer in a mouse lethal toxin challenge model to define correlates of immunity. Infect Immun. 2007;75(11):5443–52. doi:10.1128/IAI.00529-07.
- Winterroth L, Rivera J, Nakouzi AS, Dadachova E, Casadevall A. Neutralizing monoclonal antibody to edema toxin and its effect on murine anthrax. Infect Immun. 2010;78(6):2890–98. doi:10.1128/IAI.01101-09.
- Leysath CE, Chen K-H, Moayeri M, Crown D, Fattah R, Chen Z, Das SR, Purcell RH, Leppla SH. Mouse monoclonal antibodies to anthrax edema factor protect against infection. Infect Immun. 2011;79(11):4609–16. doi:10.1128/IAI.05314-11.
- Dumas EK, Gross T, Larabee J, Pate L, Cuthbertson H, Charlton S, Hallis B, Engler RJ, Collins LC, Spooner CE, et al. Anthrax vaccine precipitated induces edema toxin-neutralizing, edema factor-specific antibodies in human recipients. Clin vaccine immunol. 2017:24. doi:10.1128/CVI.00165-17.
- Uchida M, Harada T, Enkhtuya J, Kusumoto A, Kobayashi Y, Chiba S, Shyaka A, Kawamoto K. Protective effect of Bacillus anthracis surface protein EA1 against anthrax in mice. Biochem Biophys Res Commun. 2012;421(2):323–28. doi:10.1016/j.bbrc.2012.04.007.
- Crowe SR, Garman L, Engler RJ, Farris AD, Ballard JD, Harley JB, James JA. Anthrax vaccination induced anti-lethal factor IgG: fine specificity and neutralizing capacity. Vaccine. 2011;29(20):3670–78. doi:10.1016/j.vaccine.2011.03.011.
- Marrack P, McKee AS, Munks MW. Towards an understanding of the adjuvant action of aluminium. Nat Rev Immunol. 2009;9:287–93. doi:10.1038/nri2510.
- Wen Y, Shi Y. Alum: an old dog with new tricks. Emerg Microbes Infect. 2016;5:e25. doi:10.1038/emi.2016.40.
- Glenny ATPC, Waddington H, Wallace U. The antigenic value of toxoid precipitated by potassium alum. J Pathol Bacteriol. 1926;3:8–45.
- Vessely C, Estey T, Randolph TW, Henderson I, Cooper J, Nayar R, Braun LJ, Carpenter JF. Stability of a trivalent recombinant protein vaccine formulation against botulinum neurotoxin during storage in aqueous solution. J Pharm Sci. 2009;98(9):2970–93. doi:10.1002/jps.21498.
- Zhu D, Huang S, McClellan H, Dai W, Syed NR, Gebregeorgis E, Mullen GED, Long C, Martin LB, Narum D, et al. Efficient extraction of vaccines formulated in aluminum hydroxide gel by including surfactants in the extraction buffer. Vaccine. 2012;30(2):189–94. doi:10.1016/j.vaccine.2011.11.025.
- Chittineni SPaM SC. Improved method for Hepatitis B vaccine in-vitro potency. Int J Pharm Sci Invention. 2014;3:39–42.
- Patel VJ, Thalassinos K, Slade SE, Connolly JB, Crombie A, Murrell JC, Scrivens JH. A comparison of labeling and label-free mass spectrometry-based proteomics approaches. J Proteome Res. 2009;8(7):3752–59. doi:10.1021/pr900080y.
- Silva JC, Denny R, Dorschel CA, Gorenstein M, Kass IJ, Li G-Z, McKenna T, Nold MJ, Richardson K, Young P, et al. Quantitative proteomic analysis by accurate mass retention time pairs. Anal Chem. 2005;77(7):2187–200. doi:10.1021/ac048455k.
- Li GZ, Vissers JP, Silva JC, Golick D, Gorenstein MV, Geromanos SJ. Database searching and accounting of multiplexed precursor and product ion spectra from the data independent analysis of simple and complex peptide mixtures. Proteomics. 2009;9:1696–719. doi:10.1002/pmic.200800564.
- Silva JC, Gorenstein MV, Li GZ, Vissers JP, Geromanos SJ. Absolute quantification of proteins by LCMSE: a virtue of parallel MS acquisition. Mol Cell Proteomics. 2006;5:144–56. doi:10.1074/mcp.M500230-MCP200.
- Jensen KK, Andreatta M, Marcatili P, Buus S, Greenbaum JA, Yan Z, Sette A, Peters B, Nielsen M. Improved methods for predicting peptide binding affinity to MHC class II molecules. Immunology. 2018;154(3):394–406. doi:10.1111/imm.12889.
- Wang P, Sidney J, Kim Y, Sette A, Lund O, Nielsen M, Peters B. Peptide binding predictions for HLA DR, DP and DQ molecules. BMC Bioinform. 2010;11(1):568. doi:10.1186/1471-2105-11-568.
- IEDB.[ Accessed 2017 Jun]. http://wwwiedborg/
- MegAlign. 2016 Sep. [accessed 2016 Nov 25]. https://www.dnastar.com/t-megalign.aspx
- NCBI. 2016 Jul. [accessed 2016 Dec 05]. https://www.ncbi.nlm.nih.gov/
- Kramer G, Woolerton Y, van Straalen JP, Vissers JP, Dekker N, Langridge JI, Beynon RJ, Speijer D, Sturk A, Aerts JMFG, et al. Accuracy and reproducibility in quantification of plasma protein concentrations by mass spectrometry without the use of isotopic standards. PLoS One. 2015;10(10):e0140097. doi:10.1371/journal.pone.0140097.
- Chevreux G, Tilly N, Bihoreau N. Quantification of proteins by data independent acquisition: performance assessment of the Hi3 methodology. Anal Biochem. 2018;549:184–87. doi:10.1016/j.ab.2018.03.019.
- Jenkins MK, Moon JJ. The role of naive T cell precursor frequency and recruitment in dictating immune response magnitude. J Immunol. 2012;188:4135–40. doi:10.4049/jimmunol.1102661.
- Ford ML, Koehn BH, Wagener ME, Jiang W, Gangappa S, Pearson TC, Larsen CP. Antigen-specific precursor frequency impacts T cell proliferation, differentiation, and requirement for costimulation. J Exp Med. 2007;204(2):299–309. doi:10.1084/jem.20062319.
- Martinez RJ, Andargachew R, Martinez HA, Evavold BD. Low-affinity CD4+ T cells are major responders in the primary immune response. Nat Commun. 2016;7:13848. doi:10.1038/ncomms13848.
- Edwards LJ, Evavold BD. T cell recognition of weak ligands: roles of signaling, receptor number, and affinity. Immunol Res. 2011;50:39–48. doi:10.1007/s12026-011-8204-3.
- Musson JA, Walker N, Flick-Smith H, Williamson ED, Robinson JH. Differential processing of CD4 T-cell epitopes from the protective antigen of Bacillus anthracis. J Biol Chem. 2003;278:52425–31. doi:10.1074/jbc.M309034200.
- Sadegh-Nasseri S, Kim A. Selection of immunodominant epitopes during antigen processing is hierarchical. Mol Immunol. 2018. doi:10.1016/j.molimm.2018.08.011.
- Fontaine M, Vogel I, Van Eycke YR, Galuppo A, Ajouaou Y, Decaestecker C, Kassiotis G, Moser M, Leo O. Regulatory T cells constrain the TCR repertoire of antigen-stimulated conventional CD 4 T cells. Embo J. 2018;37:398–412. doi:10.15252/embj.201796881.
- Gfeller D, Bassani-Sternberg M. Predicting antigen presentation-what could we learn from a million peptides? Front Immunol. 2018;9:1716. doi:10.3389/fimmu.2018.01716.
- Pittman PR, Leitman SF, Oro JG, Norris SL, Marano NM, Ranadive MV, Sink BS, McKee KT. Protective antigen and toxin neutralization antibody patterns in anthrax vaccinees undergoing serial plasmapheresis. Clin Diagn Lab Immunol. 2005;12:713–21. doi:10.1128/CDLI.12.6.713-721.2005.
- Quinn CP, Sabourin CL, Schiffer JM, Niemuth NA, Semenova VA, Li H, Rudge TL, Brys AM, Mittler RS, Ibegbu CC, et al. Humoral and cell-mediated immune responses to alternate booster schedules of anthrax vaccine adsorbed in humans. Clin vaccine immunol. 2016;23:326–38. doi:10.1128/CVI.00696-15.
- Ingram RJ, Metan G, Maillere B, Doganay M, Ozkul Y, Kim LU, Baillie L, Dyson H, Williamson ED, Chu KK, et al. Natural exposure to cutaneous anthrax gives long-lasting T cell immunity encompassing infection-specific epitopes. J Immunol. 2010;184:3814–21. doi:10.4049/jimmunol.0901581.
- Ovsyannikova IG, Pankratz VS, Vierkant RA, Pajewski NM, Quinn CP, Kaslow RA, Jacobson RM, Poland GA. Human leukocyte antigens and cellular immune responses to anthrax vaccine adsorbed. Infect Immun. 2013;81:2584–91. doi:10.1128/IAI.00269-13.
- Pajewski NM, Parker SD, Poland GA, Ovsyannikova IG, Song W, Zhang K, McKinney BA, Pankratz VS, Edberg JC, Kimberly RP, et al. The role of HLA-DR-DQ haplotypes in variable antibody responses to anthrax vaccine adsorbed. Genes Immun. 2011;12:457–65. doi:10.1038/gene.2011.15.