
 ?Mathematical formulae have been encoded as MathML and are displayed in this HTML version using MathJax in order to improve their display. Uncheck the box to turn MathJax off. This feature requires Javascript. Click on a formula to zoom.
ABSTRACT
Background: Hepatitis B (HB) is the most serious and common viral hepatitis in China. Previous studies on HB discrimination mainly have focussed on stratified analysis, and there has been no consideration of the impact of geographical-environmental factors on HB discrimination from a spatial perspective.
Objective: This study conducted a large nationwide village-based survey to test whether there were significant regional differences in HB discrimination, and to explore the relationship between different socio-economic geographical factors and HB discrimination.
Methods: The sample comprised 22618 rural adults, aged over 18 years old, from villages in seven provinces, representing central, southern, and eastern coastal regions of China. Using face-to-face interviews, we surveyed participants’ discrimination against HB patients or carriers. Chi-square tests were used to analyze the effects of the region on differences in proportions between three discrimination levels (low, medium, and high). A geographical detector was used to explore the relationship between different socio-economic and geographical-environmental factors and HB discrimination.
Results: The distribution of HB discrimination levels across the 42 villages was statistically significant. The level of HB discrimination in the central and southern regions was generally low, and the level of HB discrimination in the eastern coastal regions was higher. Both socio-economic and geographic-environmental factors had a significant relationship with HB discrimination. Most of these relationships were not linear.
Conclusions: Developing the economy and accelerating urbanization did not automatically eliminate discrimination against HB. We recommend government HB publicity and education campaigns to inform the population of HB causes and effects, and strengthen the education of students so that they can have a clear and correct understanding of HB from a young age, both of which will address HB discrimination.
1. Introduction
Hepatitis B (HB) is one of the most prominent worldwide public health issues, and also the third-largest communicable disease in China. Worldwide, about 350 million people are chronic carriers of HB, and HB alone contributes to about 700,000 cancer deaths each year from hepatocellular carcinoma.Citation1 In China, there are an estimated 90 million chronic hepatitis B virus (HBV) carriers, accounting for about 7% of the total population and causing 300,000 deaths each year due to HBV infection and HBV-related diseases.Citation2 HB imposes annual direct medical expenses of RMB900 billion on China’s health-care system.Citation3
Vaccination is the most effective way to prevent HBV infection. China’s HBV vaccination strategy has achieved remarkable results with more than 200 million newborn children being vaccinated. After 2005, China’s vaccination policy provided all families with the HBV vaccine free to infants, which has resulted in a high absorption rate. Prior to 2005, families had to pay for HBV vaccination service fees (2002–2004) or both service fees and vaccine dose costs (1992–2001). Due to relatively low uptake rates pre-2001, in 2009 a catch-up HBV vaccination program was implemented for children born between 1994 and 2001.Citation4
Nevertheless, general HBV vaccination for adults is not freely available and HB prevalence in rural China among adults remains problematic. Among adults, the incidence of HBV remains high, with the HBV infection rate increasing with age and the adult HBV vaccination rate dropping sharply with age.Citation5,Citation6 Besides being directly affected by HB, those with HB suffer discrimination in employment and social relationships (including sexual partners), social stigma (including at schools, restaurants, and gyms), and loss of self-esteem.Citation7 Discrimination and social stigma of HB sufferers contributes to the spread of HB. The stigma of HB causes HBV sufferers to conceal their own health status and reduces their willingness to seek HB medical treatment, limiting the prevention and treatment of the HB population.Citation8 Since 2007, the Chinese government has taken measures to eliminate the discrimination against HBV carriers in employment and education,Citation9 but discrimination related to HBV remains widespread, and the comprehensive elimination of discrimination requires large-scale HB information campaigns.
Current research mainly focuses on the cultural values and social cognition factors that affect HB discrimination.Citation10 Various studies explored the factors that may lead to HB discrimination based on the personal attributes of the respondents. Surveys of rural adults in three provinces in China found that high levels of discrimination toward HB sufferers were associated with low income and poor education.Citation11 Surveys of 435 chronic HB patients and 801 controls at Peking University People’s Hospital found that higher stigma was associated with older age and lower education.Citation12 Studies also explored the factors that may lead to discrimination of HB sufferers from the perspective of the respondents’ knowledge and perception of HB-related knowledge. Through face-to-face interviews with 903 over 18 years old rural adults who migrated to Beijing, Anli Leng et al. found that a high discrimination score occurred alongside a low mean knowledge of HBV and there was an inverse relationship between discrimination levels and HBV knowledge, especially knowledge about treatment and transmission routes.Citation13 In addition, it was speculated that the economic development and urbanization can help reduce or even eliminate discrimination against HB patients,Citation14–16 while the degree of development and urbanization can be represented by indices such as average level of education,Citation14 transport infrastructures,Citation15 and household income level.Citation16
Previous studies on HB discrimination mainly relied on stratified questionnaire-based analysis, identifying influencing factors related to HB discrimination from the perspective of the respondents. These studies mainly used general linear regression to explore the relationship between discrimination factors, ruling out possible nonlinearity in the relationship. More importantly, these studies suffered from limited sample sizes, constrained modeling, and the absence of a spatial perspective. A spatial perspective refers to a research method that takes the size of a specific geographical area as its research granularity and explores the differences between geographical areas and the driving forces within each area behind any spatial differences. Compared with stratified analysis, this method can explore more regional attributes that are shared by respondents that may cause spatial differentiation of discrimination, rather than just the respondent’s demographic characteristics gained through questionnaires. Importantly, spatial perspectives provide an opportunity to develop economic and targeted interventions to attenuate HB discrimination from a new standpoint.
In China, the number of HB patients in rural areas is about 11 million, which accounts for more than 50% of the total HB patients in China.Citation3 Compared to urban areas, the lack of medical and educational resources makes HB distribution in rural areas more severe. From a spatial perspective, in this research we identifies the significant difference in the level of HB discrimination across different rural regions in China; assesses the causes for these regional differences; tests the relationship between HB discrimination and the level of economy and urbanization, and, finally, proposes policy recommendations to address region-based rural HB discrimination.
2. Methods
2.1. Questionnaire and sampling method
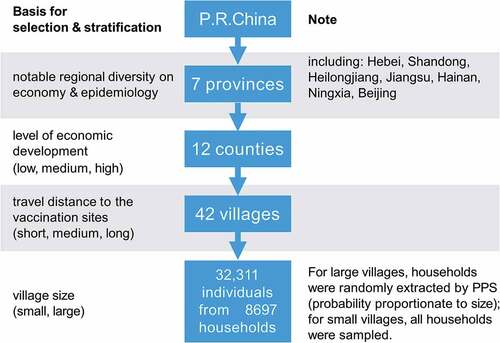
Funded by the Research Council of Norway and implemented by Shandong University and the University of Oslo,Citation17 our cross-sectional survey collected data on HB awareness, individual vaccination history, and detailed household characteristics in seven provinces in China. Using face-to-face interviews, the survey was conducted in 42 villages from different counties in 7 provinces (Hebei, Shandong, Heilongjiang, Jiangsu, Hainan, Ningxia, and Beijing) between 2011 and 2012, with notable regional, economic, and epidemiological diversity. The counties in each province were stratified according to the level of economic development (low, medium, high), and villages in the selected provinces were stratified according to the travel distance (short, medium, long) to the vaccination sites. In small villages, all households were invited to participate, while in larger villages, households were randomly selected using household size as sampling weights (probability proportionate to size). The process of sample selection is shown in . The participation rate was approximately 82%, and the predominant reason for nonparticipation was that all household members had moved to industrialized regions.Citation17 The sample consisted of 32,311 individuals (all ages included) from 8,697 households. After excluding those that had never heard of HBV and were younger than 18, the final sample consisted of 19,719 adults, aged 18–59 years (born in or before 1993), from 6,909 households. Juveniles younger than 18 were not included on the basis that they have not developed stable opinions.Citation7
Figure 1. The sampling scheme of the cross-sectional survey on HB awareness, individual vaccination history, and detailed household characteristics
2.2. Definition and measurement of dependent variable
The indicators of discrimination were measured by the respondents’ attitudes to five related HB events:
“Are you willing to accept gifts from HB patients or carriers?”
“Are you willing to shake hands with or hug HB patients or carriers?”
“Are you willing to have dinner with HB patients or carriers?”
“Do you think parents should let their children play with HB-infected children?”
“Do you think parents should accept their child marrying a HB-infected person?”
For each question, respondents selected from three options: “Yes” (0), “Depends on the situation” (1), and “No” (2). The discrimination scores against HBV sufferers were calculated by totaling the scores of each participant from their answer to each of the five questions, which ranged between was 0 to 10 points, with scores closer to 10 points indicating the more severe the discrimination.
2.3. Source and definition of independent variables
Based on previous research, we selected the following choice variables that may influence the degree of discrimination against HB patients: socio-economic conditions (lower socio-economic status is linked to lower vaccine uptakes in adults, which in turn leads to more discrimination against HBVCitation16); level of education (those with more education reported less discriminationCitation14); medical resources (medical resource-related barriers were associated with vaccination behaviorsCitation18); natural environment (environmental factors are known to affect the immune system and may play a role as triggers of the autoimmune mosaicCitation19); land use (migrant populations could be vulnerable to discrimination and stigmatization, in the process of urbanization in ChinaCitation20); and transport infrastructures (discrimination against people with infectious diseases are exacerbated in rural areas where transportation is not well-developedCitation15).
Appendix Table 1 describes the independent variables used in the above six categories. The definition, source, and year of the socio-economic variables is shown in Appendix Table 2. All variables were collected in a spatial unit of the village, and have been classified into two categories of socio-economic and geographic-environmental data.
The definition, source and year of geographic-environmental data variables is shown in Appendix Table 3 and additional information about the instrument used to collect the data are shown in Appendix Table 4. The geographic-environmental data were mainly derived from open-source maps, meteorological bureaus, and luminous remote sensing, including elevation, road network density, transit time to the provincial capital city from the surveyed village, distance to the provincial capital city from the surveyed village, number of medical facilities within 1 h walking distance from the surveyed village, number of medical facilities within 1h driving distance from the surveyed village, average temperature, average high temperature, average low temperature, average light intensity, the proportion of construction land and proportion of vegetation land.
There were restrictions on the years that the data on some of the independent variables were available. For example, road network density, transit time to the provincial capital city from the surveyed village, distance to the provincial capital city from the surveyed village, number of medical facilities within 1 h walking distance from the surveyed village, number of medical facilities within 1 h driving distance from the surveyed village can only be obtained to 2020 through web app, and the data on elevation, average temperature, average high temperature, average low temperature, average light intensity, the proportion of construction land, the proportion of vegetation land from open source websites can only be traced back to 2013.
2.4. Discrimination score and Chi-square test
Following Leng et al.Citation13 participants were categorized into three HBV-related discrimination score levels: low discrimination scores 0–3, medium discrimination scores 4–6, and high discrimination scores 7–10. Chi-square tests were used to analyze whether there was a difference between the three discrimination score levels in different regions.
2.5. Geographical detector
The geographical detector is a new statistical method to detect spatial-stratified heterogeneity and to identify the driving factors behind any heterogeneity.Citation21 The core idea is based on the assumption that if an independent variable has an important influence on a dependent variable, and then the spatial distribution of the independent variable and the dependent variable should be similar.Citation22 There are four functions of the geographical detector: the risk detector indicates where the risk areas are; the factor detector identifies factors that are responsible for the risk; the ecological detector discloses relative importance between the factors, and the interaction detector reveals whether the risk factors interact or lead to discrimination independently. The risk detector was employed to plot the relationship between the independent and dependent variables.
The factor detector was employed to judge the explanatory power of the independent variable to the dependent variable. The factor detector has two parameters, p-value and q-statistic. When p ≤ 0.05, the relationship between the independent and dependent variables is significant. The q-statistic in geographical detector has been applied in many fields of the natural and social sciences to measure spatial-stratified heterogeneity, detect explanatory factors, and analyze the interactive relationship between variables.Citation21 Strictly within [0, 1], the q-statistic in EquationEquation 1(1)
(1) measures the association between the independent and dependent variables, both linearly and nonlinearly:
where stands for the rank value of a certain independent variable after discretization; N stands for the number of villages; and
stands for the variance of the dependent variable in all villages. The larger the value of q, the stronger the ability of the independent variable to explain the dependent variable.
Since the geographical detector requires that the independent variables must be discrete variables and the original independent variables collected are continuous, it is necessary to determine the appropriate discretization method and discrete rank, and perform discrete processing on the original independent variables. Five discretization methods were used ’equal,’ ‘natural,’ ‘quantile,’ ‘geometric’, and ‘standard deviation,’ with seven discrete ranks from 2 to 8. For each independent variable, a total of 5 × 7 = 35 discretization schemes were generated. The discretization scheme corresponding to the largest q was regarded as the best discretization scheme for independent variables.Citation23
2.6. Statistical software
To check for accuracy, all data were double-inputted using Microsoft. Chi-square tests and independent-sample t-tests were performed using SPSS 25.0 (SPSS Inc., Chicago, IL, USA) software, with p < .05 considered statistically significant. The Geographical detector was implemented using R language 3.5.1 on RStudio 1.1.423.0 (RStudio Inc, Boston, MA, USA).
3. Results
3.1. Descriptive statistics for socio-demographic characteristics of participants
The socio-demographic characteristics of the study population are detailed in Appendix Table 5. The mean age was 42.48 years, with 24.69% in the 18–28 age group, and the respondents were evenly balanced between male and female respondents; 64% of the respondents were at a middle-income level, with 55.80% farmers, 28.71% migratory workers, and 5.1%-unemployed. Roughly 44% of the respondents had between 6 and 9 year of education, and only 20.57% reported that they had been vaccinated against HBV.
3.2. Vaccination behavior and willingness in 42 villages
Appendix Table 6 shows the vaccination behavior and willingness to vaccinate by respondents in different villages. In general, the vaccination rate for adults in rural areas in China was low, averaging only 19.62% across the 42 villages. Also, vaccination rates in different regions varied significantly, ranging from 8.72% to 47.4% (p ≤ 0.05). For people who had not been vaccinated in most villages, their willingness to vaccinate averaged only 29.89%, with the willingness to vaccinate varying significantly between different villages, ranging from 3.06% to 57.14% (p ≤ 0.05). The independent-sample t-test (0.136 > 0.05) indicates that there was no significant difference in the mean value of HB discrimination between people vaccinated and not vaccinated in different villages.
3.3. Distribution of discrimination level in 42 villages
Appendix Table 7 displays the average level of HB discrimination and the number in each of the three HB discrimination groups for each village. Using the data in Appendix Table 7, we plotted the spatial distribution of the discrimination level in the 42 villages. In , each pie chart represents a village, the size of the pie chart represented the average value of the discrimination level, with the blue, yellow, and red in the pie chart represented the proportion of low, medium, and high discrimination levels of HB in the village.
Figure 2. Spatial distribution of discrimination across 42 villages
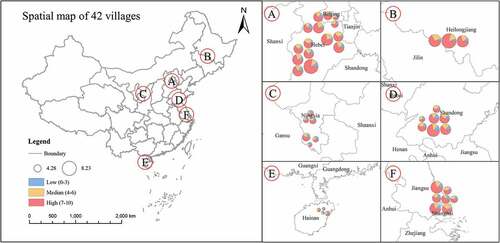
shows that there were significant differences in the mean value of HB discrimination across different villages. The level of HB discrimination in the central and southern villages was generally low, while the level of HB discrimination in the eastern coastal villages was high. The high level (discrimination scores: 7–10) of HB discrimination accounted for the largest proportion of all types of discrimination in most villages, indicating that most people in these villages expressed severe discrimination against HB sufferers. The proportions of the three HBV-related discrimination score levels (low, medium, high) varied across different villages.
3.4. Statistical significance on the difference of discrimination levels among villages
The Chi–square test, with a probability p-value less than 0.05, indicates that there was a significant difference in the distribution of HB discrimination levels across the 42 villages.
3.5. The relationship between the mean value of HB discrimination in different villages and the geographic-environmental and socio-economic factors
The p value, q value, optimal discretization method, and discrete rank of each independent variable calculated by the factor detector is displayed in Appendix Table 8. Appendix Table 8 shows that there was a significant relationship between certain independent variables and the mean value of HB discrimination. For the independent variables with p ≤ 0.05, their relationship with the mean value of HB discrimination was plotted by the risk detector in .
Figure 3. Diagram of the relationship between independent variables and the mean value of HB discrimination
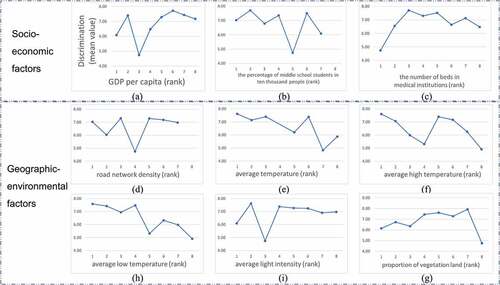
According to the curve change trend in , the independent variables were classified into four groups. The four groups were classified arbitrarily, and the grouping was for the convenience of describing the results.
Group 1: The general trend of the image saw the independent variable increase, the mean value of HB discrimination decreased rapidly, but rebounded suddenly, before gradually decreasing. This group contained GDP per capita, road network density, average light intensity, and the percentage of middle school students in 10000 people.
Group 2: The general trend of the image saw the independent variable increase; then, the mean value of HB discrimination slowly decreases. This group comprised average temperature, average high temperature, and average low temperature.
Group 3: The general trend of the image saw the independent variable increase, then the mean value of HB discrimination rises slowly before declining rapidly. This group contained the proportion of vegetation land.
Group 4: The general trend of the image saw the independent variable increase, with the mean value of HB discrimination rising rapidly and then slowly decreasing. This group contained the number of beds in medical institutions.
4. Discussion
Previous studies on the influencing factors of HB discrimination have relied on hierarchical studies based on questionnaire data. Our study used village-specific data as the research scale to explore the regional differentiation of HB discrimination and identify the relationship between different socio-economic and geographic-environmental factors and HB discrimination.
The independent variables in Group 1 reflected the degree of urbanization and development. The geographical detector shows an overall weak negative correlation trend between education level and HB discrimination, which is consistent with previous research,Citation11 but our model shows a novel and interesting nonlinear pattern. Not only one indicator displayed a nonlinear pattern but all four indicators (GDP per capita, road network density, average light intensity, and the percentage of middle school students in 10000 people) show a similar pattern. This nonlinear pattern exactly reflected the process of urbanization: from accepting rumors (high discrimination), to accepting governmental information (moderated discrimination), to exposure to commercial advertising (elevated discrimination), to finally have access to scientific knowledge (moderate discrimination). Before urbanization, people in rural poverty regions had limited access to sources of news and knew little about HB, so the level of discrimination was low. In the process of urbanization, people in remote areas suffering extreme poverty were exposed to information from outside for the first time. However, this information may not always be true. Some rumors about the hepatitis B virus have been distorted many times in the process of spreading which led to excessive speculation and inexplicable fear of HB. This argument is consistent with a study by Lijie et al. that the fear of HBV infection predominantly led to HBV-related discrimination.Citation7 The higher the region’s levels of development, the greater the number, and scale of supporting medical and testing facilities and the more professional publicity and guidance, which aids people to understand HB and gradually reduce the level of discrimination. This argument is consistent with Yang and Wu who found that public education is the key to eliminating HBV discrimination and that China’s health authorities should play a crucial part in HB educational programs.Citation9 There is also evidence that some hospitals and unscrupulous drug providers have exaggerated the harm of HB in pursuit of economic benefits,Citation24 which encouraged HB sufferers to seek unnecessary medical examinations and treatment procedures. Influenced by this, the level of discrimination has risen again as a result of the over-promotion of the dangers of HB. As a region achieves a higher degree of economic development, people’s education level generally increases, with a better understanding of HB,Citation12 and the level of discrimination gradually decreased.
The independent variables in Group 2 showed that the higher the annual mean ambient temperature, the less people discriminated against HB carriers. This may be due to the lower incidence of HB in places where the annual mean ambient temperature is higher, such as southeastern China.Citation25
The independent variable in Group 3 reflected that the relationship between vegetation cover and HB discrimination was not linear. A lower level of HB discrimination was usually associated with regions that have either a low proportion or extremely high proportion of vegetation. A lower proportion of vegetation represents higher urbanization, which was found to have a relationship with lower levels of discrimination against HB. On the other hand, extremely high vegetation cover represented highly inaccessible places where little knowledge about HB; thus, a low level of HB discrimination can be observed.
The independent variable in Group 4 reflected the level of regional medical standards. As the accessibility of HB testing increased, people have learnt about the level of HB infection, especially people close to them in small villages. Knowing that more people have HB leads to excessive fear of HB infection, raising the level of HB discrimination. Government information campaigns and correct guidance about the spread of HB by medical institutions reduce discrimination against HB suffers.Citation9
The nonlinear relationship between HB discrimination and regional development indicators showed that economic development and accelerated urbanization cannot automatically eliminate HB discrimination. In addition to information campaigns by medical institutions, it is necessary to strengthen the education of students so that they can have a clear and correct understanding of HB from a young age. The education of adults should occur when newborns are given their compulsory HBV vaccination in the hospital. To prevent people from being misled on the causes and consequences of HBV, government regulatory agencies need to regulate more strictly illegal medical institutions and false-exaggerated information about HB. Finally, the village-level education on personal privacy needs to be strengthened, especially the protection of personal medical records to ensure that HBV suffers remain anonymous and confidential, which limits the probability of discrimination.
5. Limitations
The study has a number of limitations. The real-world measurements of HB discrimination include, but are not limited to, people’s attitudes to the five questions evaluated in our questionnaire. Further HB discrimination questions should be considered in the future research. The second limitation is data collection. The dependent variable derived from the questionnaire data was collected in 2011–2012, but data limitations meant some of the independent variables were measured in 2012–2019 period. For most independent variables, these differences were small and nonconsequential. Some variables (road network density and the proportion of vegetation land) could only be collected in 2019 and may have been larger. One possible solution might be constructing new data, such as extracting the road network based on remote sensing images in 2012 and calculating the actual road network density for that year on this basis. The choice of independent variables is arbitrary, considering variables in the existing literature and data availability. The causal relationship between the independent variables and the response variable needs to be investigated further in future studies. Finally, only the trend of the curve was explained. Based on the trend description of the curve, this study analyzed the reasons for the curve change. However, further research should investigate fluctuations in the curve and changes in the slope of the curve.
6. Conclusion
This study utilized a large nationwide HB awareness survey and granular village-specific data to reveal significant regional differences in HB discrimination and to explore the relationship between different socio-economic and geographical-environmental factors and HB discrimination. The results showed that there was a significant difference in the level of discrimination in different villages. Both socio-economic and geographic-environmental factors had a significant relationship with HB discrimination. We found that most of these relationships are nonlinear, which indicated that simply developing the economy and accelerating urbanization cannot attenuate discrimination against HB sufferers. Besides proper HB information and education campaigns, it is also necessary to eliminate false advertising and information around HB. In addition to information campaigns aimed at adults, it is necessary to strengthen the education of students so that they can have a clear and correct understanding of HB from a young age.
Disclosure of potential conflicts of interest
No potential conflicts of interest were disclosed.
Ethics
Participants were informed that they could refuse to answer any question. The questionnaire did not ask about infection status, and no biological samples were collected. The project was approved by the Medical Ethics Committee at the Shandong University School of Medicine (Grant No. 201001052).
Acknowledgments
The authors thank the health workers in all the participating provinces for their support and assistance.
Additional information
Funding
References
- Brill H, Azzopardi P, Roy M, Azzopardi P, DiGravio B, Ly L. 23 preventing perinatal transmission of hepatitis B: a quality assurance review. Paediatrics & Child Health. 2019. doi:10.1093/pch/pxz066.022.
- Lan Z, Zhang W, Ruan S. Modeling the transmission dynamics and control of hepatitis B virus in China. Journal of Theoretical Biology. 2017;262:330–38.
- WHO. Guidelines for the prevention, care and treatment of persons with chronic hepatitis B infection. 2015.
- Jia Y, Li L, Cui F, Zhang D, Zhang G, Wang F, Gong X, Zheng H, Wu Z, Miao N. Cost-effectiveness analysis of a hepatitis B vaccination catch-up program among children in Shandong Province, China. Human Vaccines & Immunotherapeutics. 2014;10:2983–91. doi:10.4161/hv.29944.
- Zhang L, Yan BY, Li MS, Song LZ, Lu JJ, Xu Q, Xu AQ. Preliminary analysis on the prevalence and causes of breakthrough hepatitis B virus infection among children in Shandong province, China. Zhonghua Yu Fang Yi Xue Za Zhi. 2013;47:933–39.
- Zhang M, Yuan Y, Mao P, Zhuang Y. Analysis on morbidity and mortality of viral hepatitis in China, 2004-2013. Zhonghua Liu Xing Bing Xue Za Zhi. 2015;36:144–47.
- Yu L, Wang J, Zhu D, Leng A, Wangen KR. Hepatitis B-related knowledge and vaccination in association with discrimination against Hepatitis B in rural China. Human Vaccines &; Immunotherapeutics. 2015;12(1):70–76.
- Wu H, Yim C, Chan A, Ho M, Heathcote J. Sociocultural factors that potentially affect the institution of prevention and treatment strategies for hepatitis B in Chinese Canadians. Canadian Journal of Gastroenterology = Journal Canadien De Gastroenterologie. 2009;23:31–36. doi:10.1155/2009/608352.
- Yang T, Wu MC. Discrimination against hepatitis B carriers in China. Lancet. 2011;378:1059. doi:10.1016/S0140-6736(11)61460-8.
- Yj VDV, Van EP, Looman CW, Richardus JH. Social-cognitive and socio-cultural predictors of hepatitis B virus-screening in Turkish migrants, the Netherlands. Journal of Immigrant & Minority Health. 2014;16:811–21. doi:10.1007/s10903-013-9872-y.
- Yu L Discrimination against hepatitis B in rural China: can HBV vaccination reduce the discrimination? 2015.
- Huang J, Guan ML, Balch J, Wu E, Rao H, Lin A, Wei L, Lok AS. Survey of hepatitis B Knowledge and stigma among chronically infected patients and uninfected persons in Beijing, China. Liver International. 2016;36(11):1595–1603.
- Leng A, Li Y, Wangen KR, Nicholas S, Maitland E. Hepatitis B discrimination in everyday life by rural migrant workers in Beijing. Human Vaccines & Immunotherapeutics. 2016. doi:10.1080/21645515.2015.1131883.
- Han B, Yuan Q, Shi Y, Lai W, Hou J, Jia S, Ying H, Jin C, Chan PL, Hui Z. The experience of discrimination of individuals living with chronic hepatitis B in four provinces of China. Plos One. 2018;13:e0195455. doi:10.1371/journal.pone.0195455.
- Qian HZ, Wang N, Dong S, Chen H, Zhang Y, Chamot E, Shi X, Gao J, Vermund SH, Shao Y. Association of misconceptions about HIV transmission and discriminatory attitudes in rural China. AIDS Care. 2007;19:1283–87. doi:10.1080/09540120701402814.
- Zhu D, Guo N, Wang J, Nicholas S, Wang Z, Zhang G, Shi L, Wangen KR. Socioeconomic inequality in hepatitis B vaccination of rural adults in China. Human Vaccines & Immunotherapeutics. 2018;14:464–70. doi:10.1080/21645515.2017.1396401.
- Zhu D, Wang J, Wangen KR. Hepatitis B vaccination coverage rates among adults in rural China: are economic barriers relevant? Vaccine. 2014;32:6705–10. doi:10.1016/j.vaccine.2013.06.095.
- Strong C, Lee S, Tanaka M, Juon HS. Ethnic differences in prevalence and barriers of HBV screening and vaccination among Asian Americans. Journal of Community Health. 2012;37:1071–80. doi:10.1007/s10900-012-9541-4.
- Molina V, Shoenfeld Y. Infection, vaccines and other environmental triggers of autoimmunity. Autoimmunity. 2005;38:235–45. doi:10.1080/08916930500050277.
- Gong P, Liang S, Carlton E,J, Jiang Q, Wu J. Urbanisation and health in China. Lancet London. 2012. doi:10.1016/S0140-6736(11)61878-3.
- Wang JF, Li XH, Christakos G, Liao YL, Zhang T, Gu X, Zheng XY. Geographical detectors-based health risk assessment and its application in the neural tube defects study of the Heshun Region, China. International Journal of Geographical Information Science. 2010;24:107–27. doi:10.1080/13658810802443457.
- Wang J-F, Hu Y. Environmental health risk detection with GeogDetector. Environmental Modelling & Software. 2012;33:p.114–5. doi:10.1016/j.envsoft.2012.01.015.
- Li H, Jia P, Fei T. Geographical association between dietary tastes and chronic diseases in China: An exploratory study using crowdsourcing data mining techniques. Acta Geographica Sinica. 2019;74:1637–1649.
- Pan L, Pan R. Analysis on discrimination against hepatitis B virus carriers. Medicine and Philosophy (A). 2005;026:77–79.
- Chun-Rong H, Han-Sheng L. Clustering analysis of hepatitis B incidence rate from 2004 to 2007 in different regions of China. Modern Preventive Medicine. 2009;36(20):3831–3832.
Appendix
Appendix Table 1. Indices of six variable categories
Appendixss
Appendix Table 2. Details of socio-economic data
Appendix
Appendix Table 3. Details of geographical environment data
Appendix
Appendix Table 4. Information about the instrument used to collect the data
Appendix Table 5. Descriptive statistics for socio-demographic characteristics of participants
Appendix
Appendix Table 6. Vaccination behavior and willingness in 42 villages
Appendix
Appendix Table 7. HB discrimination score of each village
Appendix
Appendix Table 8. The results by the geographical detector