
ABSTRACT
Anti-programmed death ligand 1 (PD-L1) therapy has been beneficial in treating patients with certain cancers. Here, we tested whether anti-PD-L1 therapy is effective for controlling different types of tumors using animal models of TC-1, MC38 and B16. We found that, despite PD-L1 expression, anti-PD-L1 therapy showed little and some antitumor activity in the TC-1 and MC38 models. However, anti-PD-L1 therapy exhibited a more dramatic antitumor effect in the B16 model. This difference in antitumor responses was likely associated with the CD8 + T cell infiltration status of tumor tissues. In the B16 model, CD8 + T cells and to a lesser degree NK cells were found to be responsible for the antitumor response of anti-PD-L1 therapy, as determined by immune cell subset depletion. In particular, CD8 + T cells from B16-bearing mice produced an IFN-γ in response to B16 cells and citrate phosphate buffer-treated B16 cell peptide elutes but not to an immunodominant class I epitope, Trp2180-188, suggesting that CD8 + T cells that recognize neoantigens were induced in B16 tumor-bearing mice and then reactivated by anti-PD-L1 for tumor control. When B16 tumor-bearing mice were treated with anti-PD-L1 in combination with Trp2180-188 peptide vaccines, they displayed significantly more tumor control than either single therapy. Taken together, these studies show that B16 melanomas are more effectively controlled through reactivation of tumor-infiltrating lymphocytes by anti-PD-L1 therapy. Moreover, combined therapy using anti-PD-L1 and Trp2 peptide vaccines is more beneficial for controlling B16 melanomas through reactivation of neoantigen-specific CD8 + T cells and induction of Trp2-specific CD8 + T cells.
Introduction
Programmed death (PD)-1 and its ligand PD-L1 are components of an immune checkpoint signaling pathway to prevent autoimmunity and damage to normal tissues during immune cell activation in response to infection.Citation1,Citation2 Tumor cells take advantage of this PD-1/PD-L1 checkpoint pathway to evade immune surveillance.Citation3–5 In animal studies, tumor-associated PD-L1 promoted T cell apoptosis and its blockade resulted in a better tumor response.Citation3 PD-1/PD-L1 blockade therapy has shown clinical efficacy against certain cancer types (melanoma, renal-cell cancer, ovarian cancer, and squamous cell carcinoma).Citation6–9 Even in these cancer types, 10 ~ 30% of patients respond to the PD-1/PD-L1 blockade therapy.Citation10 However, responses are rare in other cancer types including prostate cancer.Citation11 The reason for this difference between cancer types and between patients is still unclear. It has been reported that PD-L1 expression is correlated directly with the clinical efficacy of anti-PD-L1 therapy.Citation12,Citation13 Exosomal PD-L1 levels also affect the response to anti-PD-L1 Ab therapy.Citation14 Moreover, tumor-infiltrating lymphocytes (TILs) serve as an important biomarker for predicting the tumor response by anti-PD-L1 blockade.Citation15 TIL infiltration is also a prerequisite for the response to PD-1/PD-L1 blockade therapy.Citation16 Thus, these results highlight the fact that both PD-L1 and TILs are involved in tumor control by PD-1/PD-L1 blockade therapy.
Combination therapy using nivolumab plus ipilimumab (anti-CTLA-4 [cytotoxic T-lymphocyte–associated antigen 4] Ab, another immune checkpoint blocker) has been reported to augment tumor response and survival rates in melanoma patients,Citation17–19 and this combination has been approved by the FDA for the treatment of metastatic melanoma. In animal tumor models, the application of LIGHT (known as tumor necrosis factor superfamily member 14) for the secretion of chemokines from tumor stromal cells increases TIL infiltration, leading to a better tumor response in combination with anti-PD-L1 therapy.Citation16 Combination therapy using IL-12 and anti-PD-L1 has also displayed better tumor responses in multiple tumor models including MC38.Citation20 In animal breast cancer models, blockade of IL-1β also synergizes with PD-1 blockade to achieve cancer suppression through a decrease in macrophages and secretion of their pro-inflammatory cytokines responsible for greater infiltration of myeloid cells, as well as through an increase in DC numbers in the tumor microenvironment.Citation21 RNAi-mediated β-catenin inhibition also increases the number of TILs, leading to a better tumor response when combined with blockade of CTLA-4 and PD-1 immune checkpoints.Citation22 In a pancreatic cancer model, chemotherapy targeting glutamine-utilizing enzymes also affects the tumor microenvironment, resulting in a better tumor response when combined with anti-PD-1 therapy.Citation23 Taken together, it is likely that combined approaches using PD-1/PD-L1 blockade and other therapy modalities are more beneficial for improving antitumor responses.
In our previous studies using animal tumor model systems (TC-1, MC38, and B16), tumor control has been observed by immune therapy through induction of tumor Ag-specific CD8+ CTL responses.Citation24–27 Moreover, antitumor responses were dramatically improved by immune therapy in combination with other therapy modalities including chemotherapy and radiation.Citation28–30 In B16 melanoma, the MHC class I peptides Trp2180-188 were induced as an immunodominant CD8 + T cell epitope by local IL-12 therapy, thus leading to melanoma control.Citation25 In TC-1 tumors, E7 class I peptide (RAHYNIVTF) acts as a major CD8 + T cell epitope and is mainly involved in TC-1 tumor eradication.Citation24 In MC38 and MC32 tumors, established tumors are eliminated by IL-12 therapy through induction of CD8 + T cells recognizing as-yet-unknown antigens.Citation27
In this study, we investigated using 3 tumor models (TC-1, MC38, and B16) whether anti-PD-L1 Ab therapy might result in tumor control, with a focus on their PD-L1 and TIL status. We found that antitumor activity of anti-PD-L1 was dependent on the levels of TILs but not the PD-L1 expression status. In particular, B16 melanoma was controlled by anti-PD-L1 therapy mainly through CD8 + T cells recognizing as-yet-unknown neoantigens, but not the immunodominant MHC class I epitope Trp2180-188. Finally, combined therapy using anti-PD-L1 and Trp2 peptide vaccines improved B16 melanoma control through reactivation of neoantigen-specific CD8 + T cells and induction of Trp2-specific CD8 + T cells.
Materials and Methods
Animals and cells
Female 6 week old C57BL/6 mice were purchased from Daehan Biolink Co., Chungbuk, Korea. The mice were cared for under the guidelines of the Institutional Animal Care and Use Committee-approved protocols. B16BL6 cells were purchased from the Korean Cell Line Bank (Seoul, Korea), and grown in complete DMEM medium (10% FBS [fetal bovine serum], 1% L-glutamine, 1% penicillin/streptomycin). TC-1 and MC38 cells were previously studied.Citation27,Citation31 The tumor cells were washed 2 times with phosphate-buffered saline (PBS) and injected into the mice.
Reagents, tumor cell challenge and treatment
For the antitumor therapeutic studies, TC-1 (2 x 10⁵ cells/mouse), MC38 (5 x 10⁵ cells/mouse) and B16 (5 x 10⁵ cells/mouse) cells were injected s.c. into the right flank of C57BL/6 mice. When the tumor size was 1.5 ~ 5 mm, the animals were initiated for treatment. For anti-PD-L1 treatment, the animals were injected i.p. with 100 μg of anti-PD-L1 Abs at 3 ~ 4 day intervals. Specifically, anti-PD-L1 Abs were previously describedCitation32 and provided from Scripps Korea Antibody Institute (Chuncheon, Korea). Control rat immunoglobulin G (IgG) was purchased from Sigma-Aldrich. The mice were also treated i.p. at 3 ~ 4 day intervals with gemcitabine (Gemzar®, Lilly) at a dose of 37.5 μg/g body weight, as previously reported.Citation30 For B16 tumor treatment, the animals were injected s.c. with 20 μg of Trp2180–188 peptides (SVYDFFVWL) plus 20 μg of CpG-oligodeoxynucleotide (ODN) in a final volume of 100 μl in PBS at 0 and 1 weeks. The peptides were purchased from Peptron (Taejon, Korea). The CpG-ODN [unmethylated form] designated as 1826 (5ʹ-TCCATGACGTTCCTGACGTT-3ʹ) was purchased from GenoTech, Taejon, Korea. It was synthesized with a nuclease-resistant phosphorothioate backbone, dissolved in water and then confirmed to have an undetectable endotoxin level. For B16 tumor re-challenge studies, 1 × 10⁶ B16 cells per mouse were injected s.c. into the left flank of C57BL/6 mice. The mice were monitored twice per week for tumor growth. The tumor size was measured in mm using a caliper, and was recorded as the mean diameter [longest surface length (a) and width (b), (a + b)/2]. Mice with complete tumor regression were denoted as those displaying no tumor detectable by hand manipulation techniques. The mice were euthanized when the mean diameter of the tumor exceeded 20 mm.
Surgical removal of tumor mass from mice
Tumor-bearing mice were injected i.p. with Rampun (Bayer Korea, Seoul) at a dose of 3.25 ml/kg and Zoletil 50 (Virbac Co., Fort Worth, TX) at a dose of 12.5 mg/kg. When the animals were under anesthesia, the tumor mass was surgically removed. After this, animal skins were sutured using the Dafilon suture 4/0 (Rubi, Spain)
Fluorescence-activated cell sorting (FACS) analysis
Five x 105 tumor cells were reacted at 4°C for 30 min with PE (picoerythrin)-conjugated anti-PD-L1 Abs and PE-conjugated isotype control. After washing the cells 2 times with FACS buffer (PBS+1% FBS), the cells (104 cells) were tested for the levels of PD-L1 expression. For staining tumor cells from the tumor tissues, tumors (5 ~ 6 mm) were cut into small pieces in DMEM containing 1.5 mg/ml of collagenase type IV and 10 μg/ml of DNase, and then incubated at 37°C for 2 ~ 3 h. The tumor cell suspensions were applied to a 70 mm cell strainer. The collected cells were pretreated for 10 min with anti-CD16/32 (Fc blocker) and then stained with allophycocyanin (APC)-conjugated CD45 Abs, PE-conjugated anti-PD-L1 Abs, and PE-conjugated isotype control. The CD45-negative cells were gated and the cells (104 cells) were tested for the levels of PD-L1 expression. For staining immune cells from tumor-draining lymph nodes (TDLNs) and tumor tissues, tumor-bearing mice were sacrificed and each tissue was obtained. Tumors were cut and then treated as above. The collected cells were reacted for 10 min with anti-CD16/32 (Fc blocker) and then stained with allophycocyanin (APC)-conjugated CD45, FITC (fluorescein isothiocyanate)-conjugated anti-CD3, and PE-conjugated anti-CD4, anti-CD8 and anti-CD49b (clone DX5 for NK cells). For intracellular staining, the cells were reacted as shown above. After washing, the cells were fixed and permeabilized using the Cytofix/Cytoperm kit (BD Biosciences, San Jose, CA). Intracellular staining was performed using FITC-conjugated anti-IFN-γ antibodies. In each step, the cells were washed 2 times with FACS buffer. Finally, the cells were analyzed using a FACSCalibur flow cytometer (BD Biosciences). The PE- and FITC-conjugated antibodies were purchased from BioLegend (San Diego, CA) and BD biosciences.
In vivo CTL lytic assay
One fraction of splenocytes was pulsed with 5 μg of human papillomavirus (HPV) 16 E7 CTL peptides (RAHYNIVTF) in cRPMI media for 60 min at 37°C, while the other fraction was left un-pulsed. To generate peptide-pulsed cells with high carboxyfluorescein diacetate succinimidyl ester (CFSE), the peptide-pulsed splenocytes were incubated with 20 μM CFSE in RPMI (2.5% FBS) for 15 min. The un-pulsed cells were instead incubated with 2.5 μM CFSE in RPMI (2.5% FBS) for 15 min to generate non-peptide-pulsed cells with low CFSE. The cells were then washed 3 times with PBS to remove unbound CFSE. Finally, an equal number of pulsed and un-pulsed cells (a total of 2 × 10⁷ cells/0.4 ml/mouse) were injected i.v. into the tested mice. After 48 h, the mice were sacrificed and the spleens were collected. After lysing the red blood cells, the splenocytes were analyzed directly for the two cell populations with CFSE staining (CFSE low versus CFSE high) using a flow cytometer (BD Biosciences). The percentage of lysed cells (%lysis) was calculated as 100 × {1− (runprimed/rprimed)}. The ratio (r) was calculated as %CFSElow/%CFSEhigh.
In vivo and in vitro depletion of CD4 + T, CD8 + T and NK cells
One hundred μg of anti-CD4 and anti-CD8 IgGs or 200 μl of anti-asialo GM1 antibodies were administered i.p. at 0, 3, 7 and 10 days post-treatment. Hybridoma cell lines (clone GK1.5 for anti-CD4 IgG; clone 2.43 for anti-CD8 IgG) were purchased from the American Type Culture Collection (Manassas, VA). The IgG Abs were obtained as previously described.Citation33 Anti-CD4 and anti-CD8 IgG treatment resulted in more than 95% depletion of CD4+ and CD8 + T cells at 5 days following antibody injection, respectively. Anti-asialo GM1 rabbit antibodies were purchased from Wako Pure Chemical, Osaka, Japan. Anti-asialo GM1 rabbit antibodies were diluted in accordance with the manufacturer’s protocol and injected in 200 μl of PBS (containing the diluted anti-asialo GM1 Abs) per mouse. This Ab treatment resulted in 80 ~ 90% depletion of NK cells (expressing a CD3-/CD49b+ phenotype) at 5 days following antibody injection. Control Abs (IgG) were purchased from Sigma-Aldrich. For in vitro deletion of CD8 + T cells, splenocytes were reacted for 30 min at 4°C with anti-CD8 Ab (clone 2.43), followed by incubation for 1 h at 37°C with rabbit complement (Sigma-Aldrich). This was repeated one more time. This procedure resulted in 96% depletion of CD8 positive T cells. For in vitro depletion of NK cells, splenocytes were reacted for 30 min at 4°C with PE-conjugated anti-CD49b, followed by incubation with anti-PE Particles 2-DM. This reaction was performed in accordance with the protocol of a commercial NK cell separation kit (BD Biosciences). Finally, the cells were passed through the column attached to a magnetic field and then the pass-through was collected as NK cell-depleted immune cells. The magnetic column procedure resulted in 65% depletion of CD49b positive NK cells.
IFN-γ assays
For IFN-γ assay, a 1 ml aliquot containing 6 × 10⁶ of splenocytes and the CD8+ T cell/NK cell-depleted immune cells was incubated with 2 × 10⁶ of B16 cells and as a control, TC-1 cells that had been exposed to UV light for 1.5 h. A 1 ml aliquot containing 6 × 10⁶ of splenocytes was also added to each well of 24-well plates containing 5 μg of B16 MHC class I peptides or HPV 16 E7 peptides as a control. The B16 class I peptides (Trp17-14; LPLAYISL, Trp1175-182; NTPQFENI, Trp1222-229; TWHRYHLL, Trp1344-351; TPPFYSNS, Trp1396-403; NDPIFVLL, Trp15g22-529; YAEDYEEL; Trp2180-188; SVYDFFVWL; gp10025-33; EGSRNQDWL; human gp100; KVPRNQDWL) and E7 peptides (RAHYNIVTF) were purchased from Peptron. For selection of the elute fractions containing immunogenic peptides, the splenocytes were also added with vacuum-dried peptide extracts dissolved in 50 μl of 10% dimethyl sulfoxide (DMSO) in PBS. After 1 ~ 2 days of incubation at 37°C in 5% CO2, the cell supernatants were obtained and used to analyze IFN-γ levels using commercial cytokine kits (BD Biosciences) by adding the extracellular fluids to IFN-γ-specific enzyme-linked immunosorbent assay plates.
Peptide extraction and desalting process
Three x 108 B16 cells were washed three times with 1 x Hanks’ balanced salt solution (HBSS). After this step, the cells were collected and re-suspended in 3 ml of citrate-phosphate buffer [0.131 M citric acid, 0.066 M Na2HPO4] (pH3.1), followed by incubation on ice for 5 min with every one minute tapping. The cells were centrifuged at 1.3 krpm for 5 min at 4°C. Three ml of the cell supernatants were collected and then re-centrifuged at 15 krpm for 30 min at 4°C. The final cell supernatants were passed through a C18 Sep-Pak column (Waters Corporation, Milford, MA) for desalting. In particular, the C18 column was pre-washed with 2 ml of 100% acetonitrile (ACN), followed by washing with 2 ml of water. Finally, the column was washed with 1 ml of water. The peptides were eluted from the column using 3 ml of 60% acetonitrile in water. For peptide control, 10 μg of Trp2 peptides were dissolved in 3 ml of citrate-phosphate buffer and then loaded onto the column. Three hundred to 1000 μl of elutes were vacuum-dried for IFN-γ and high performance liquid chromatography (HPLC) assays.
Reverse Phase (RP)-HPLC
The eluted and dried peptides from 1 ml of elutes were dissolved in 50 μl of 0.1% trifluoroacetic acid (TFA). This was fractionated by RP-HPLC (Xbridge C18, Waters Corporation). The AKTAmicro (GE healthcare, Pittsburgh, PA), pump (P-905), UV-900 detector, fractionation-950 and the software UNICORN 5.31 were used as the analytic systems. Briefly, an ACN gradient (0% ~ 100%) containing 0.1% TFA in water was used. The elution patterns were read at 214 and 280 nm. Each fraction showing a peak at 214 nm was tested for the IFN-γ induction level.
Statistical analysis
Statistical analysis was performed by one-way ANOVA and independent t test using the SPSS 17.0 software program. The values of the experimental groups were compared with the values of the control group. Any p values < .05 were considered to be significant.
Results
Anti-PD-L1-mediated antitumor therapeutic effectiveness was variable among tumor cell types despite their PD-L1 expression status
The antitumor effects of anti-PD-L1 therapy were measured in animal models of three different tumor types (TC-1, MC38 and B16). We first tested whether TC-1 tumors expressed PD-L1 on the cell surface. As shown in ), both TC-1 cells and TC-1 cells from the tumor tissue expressed PD-L1 as measured by a flow cytometer. When the TC-1 tumor (mean tumor size; 1.6 mm)-bearing mice were treated with anti-PD-L1, they failed to display any tumor growth inhibition over the time points ()). In these animals, we were also unable to detect the induction of CD8+ cytotoxic T cell responses specific to the well-known major class I CTL peptide (RAHYNIVTF) ()). Using the TC-1 model, we have previously reported that a combination of E7 peptide therapy plus gemcitabine-based chemotherapy augment antitumor activity to a greater extent than either single therapy alone.Citation30 To evaluate whether anti-PD-L1 therapy might lead to tumor growth inhibition when combined with gemcitabine therapy, we treated TC-1 tumor (mean tumor size; 5 mm)-bearing animals with anti-PD-L1 and gemcitabine. As shown in ), anti-PD-L1 plus gemcitabine therapy failed to display antitumor effects to a greater extent than gemcitabine therapy alone. However, gemcitabine therapy with or without anti-PD-L1 therapy displayed similar levels of tumor regression over the time points, which were significantly greater than either the non-treatment or anti-PD-L1 groups. These data imply that anti-PD-L1 does not induce E7-specific cytotoxic T cells required for TC-1 tumor control, which can act in concert with gemcitabine therapy to achieve TC-1 control. In the case of MC38 tumors, both MC38 cells and MC38 cells from the tumor tissue expressed PD-L1 on the cell surface ()). When MC38 tumor (mean tumor size; 2.5 mm)-bearing animals were treated with anti-PD-L1, the mice showed a degree of tumor growth inhibition compared with the non-treatment groups ()). When MC38 tumor (mean tumor size; 4.7 mm)-bearing animals were treated with anti-PD-L1, the mice also showed a degree of tumor growth inhibition ()). When the MC38 tumor-bearing animals were treated with anti-PD-L1 in combination with gemcitabine, the mice exhibited significantly more tumor regression than animals receiving either anti-PD-L1 therapy or gemcitabine therapy ()). These results indicate that anti-PD-L1 can induce antitumor immune responses to MC38 tumors and that the induced antitumor immune cells likely act to inhibit tumor growth in concert with gemcitabine. We also tested both PD-L1 expression status and the antitumor activity of anti-PD-L1 in the B16 model. As shown in ), both B16 cells and B16 cells from the tumor tissue expressed PD-L1 on the cell surface. When B16 tumor (mean tumor size; 2.3 mm)-bearing animals were treated with anti-PD-L1, the mice exhibited significantly more tumor growth inhibition than the control groups ()). To test which subsets of immune cells were responsible for B16 tumor control by anti-PD-L1 therapy in vivo, we performed an immune cell depletion assay. When the B16 tumor-bearing mice with anti-PD-L1 therapy were depleted of CD8 + T cells, they completely lost antitumor activity ()). When the mice were depleted of NK cells, they also partially lost antitumor activity. Conversely, CD4 + T cell depletion failed to result in any loss in antitumor activity by anti-PD-L1 therapy. These data suggest that CD8+ and less importantly NK cells are responsible for B16 tumor control by anti-PD-L1. Taken together, these studies imply that the antitumor activity of anti-PD-L1 therapy is variable among PD-L1-poitive tumor cell types and that CD8+ and to a lesser degree NK cells are associated with B16 tumor control by anti-PD-L1 therapy.
Figure 1. Expression status of PD-L1 on TC-1 and MC38 cells, and the antitumor therapeutic effect of anti-PD-L1 Abs in association with gemcitabine. A) TC-1 cells (upper) and TC-1 cells from the tumor tissue (lower) were stained with PE-conjugated control IgG isotype (thin line) and PE-conjugated anti-PD-L1 Abs (thick line). The numbers in the left square indicate the mean fluorescence intensity (MFI) values of control Abs while those in the right square indicate the MFI values of anti-PD-L1 Abs. B,C) Each group of mice (n = 5/group) was challenged with TC-1 cells. When the tumor sizes became ≅ 2 mm in diameter, the mice were injected i.p. with 100 μg of anti-PD-L1 IgGs at 0, 3, 7, 10, and 13 days post-treatment. Tumor sizes were measured over the time points (B). On day 15, the mice were tested for in vivo CTL lytic activity (C). D) Similar experiments to Figure 1B except that when the tumor sizes become ≅ 5 mm in diameter, the mice were treated with anti-PD-L1 Abs and gemcitabine. In particular, the mice were injected i.p. with gemcitabine twice a week at a dose of 37.5 μg/g body weight. E) MC38 cells (upper) and MC38 cells from the tumor tissue (lower) were stained with PE-conjugated control IgG isotype (thin line) and PE-conjugated anti-PD-L1 Abs (thick line). The numbers in the left square indicate the MFI values of control Abs while those in the right square indicate the MFI values of anti-PD-L1 Abs. F) Similar experiments to Figure 1B except with MC38 cells. G) Similar experiments to Figure 1D except with MC38 cells. *p < .05 compared with non-treatment. #p < .05 compared with gemcitabine+control Ab
Figure 2. Expression status of PD-L1 on B16 cells, and the antitumor therapeutic effect of anti-PD-L1 Abs and role of immune cell subsets in antitumor immunity. A) B16 cells (upper) and B16 cells from the tumor tissue (lower) were stained with PE-conjugated control IgG isotype (thin line) and PE-conjugated anti-PD-L1 Abs (thick line). The numbers in the left square indicate the MFI values of control Abs while those in the right square indicate the MFI values of anti-PD-L1 Abs. B) Each group of mice (n = 5/group) was challenged with B16 cells. When the tumor sizes became ≅ 2 mm in mean diameter, the mice were injected i.p. with 100 μg of anti-PD-L1 Abs at 0, 3, 7, 10, and 13 days post-treatment. The tumor sizes were measured over the time points. The values and bars represent mean tumor sizes and SD, respectively. C) Similar experiments to Figure 2B except that the mice were injected with anti-PD-L1 Abs at 0, 3, 7, 10, and 13 days post-treatment. The mice were also injected with anti-CD4, anti-CD8, and anti-NK Abs at 0, 3, 7, 10 days post-treatment. *p < .05 compared with non-treatment. #p < .05 compared with anti-PD-L1
Long-term antitumor memory responses were not inducible in animals with both B16 tumors and anti-PD-L1 therapy
We were interested in testing whether the B16 tumor-bearing mice receiving anti-PD-L1 therapy might show an induction of memory responses to parental B16 tumor cells. To test this possibility, the B16 tumor-bearing mice were treated with anti-PD-L1, and then the tumors were surgically removed at 15 days following anti-PD-L1 treatment. When the tumor-removed mice were re-challenged with B16 cells at 6 weeks following tumor-removal, they showed little antitumor protection from a challenge with B16 cells in a manner similar to the naïve control (Supplementary Figure 1A). When the tumor-removed mice were re-challenged with B16 cells at 3 weeks following tumor-removal, they showed an insignificant degree of antitumor memory responses to B16 cells (Supplementary Figure 1B). Thus, these data imply that anti-PD-L1 therapy may not lead to the induction of long-term memory responses.
Anti-PD-L1 therapy failed to influence infiltration rates of immune effector cells into the TDLNs and tumor tissues
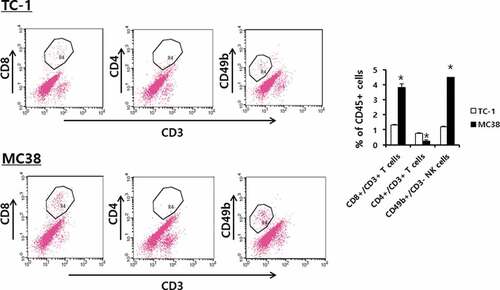
We next tested whether anti-PD-L1 therapy might increase the infiltration rates of immune effector cells (CD8+ and CD4 + T cells, and NK cells) into the TDLNs and tumor tissues. The B16 tumor-bearing animals were treated with anti-PD-L1 and the TDLNs and tumor tissues were surgically removed for FACS analysis. When the immune cells of the TDLNs were measured for the percentages of CD8+ and CD4 + T cells and NK cells, no significant differences were detected in the percentages of these immune cells between animals receiving anti-PD-L1 therapy and the control groups (): e.g., CD8 + T cells; 20%, CD4 + T cells; 25%, NK (CD49b+/CD3-) cells; <3%. Similarly, there was no difference in the percentages of immune cells in the tumor tissues between animals receiving anti-PD-L1 therapy and the control groups (): e.g., CD8 + T cells; 30%, CD4 + T cells; <1%, NK (CD49b+/CD3-) cells; 5%. As there was a big difference in the tumor sizes between anti-PD-L1-treated and non-treated control groups (≅ 8 mm vs. ≅ 15 mm) when the tumors were removed, we also measured immune cell infiltration status in the tumors of the non-treated control mice when they became ≅ 8 mm. We also observed the same level of immune cell infiltration rates as above (data not included). These results suggest that anti-PD-L1 does not influence the infiltration profiles of immune effector cells into TDLNs and tumors. We previously showed that anti-PD-L1 therapy was not effective for controlling TC-1 tumors, but it was a bit effective for inhibiting the growth of MC38. Thus, we evaluated the infiltration status of immune cells in tumor tissues in the TC-1 and MC38 tumor models. For this assay, animals were challenged with TC-1 and MC38 cells. When the tumor sizes became ≅ 8 mm, the tumors were removed, and each immune cell subset was measured. As shown in , the percentages of CD8 + T cells, CD4 + T cells and NK (CD49b+/CD3-) cells in the TC-1 tumor tissues were more or less than 1%. Conversely, the percentages of CD8 + T cells, CD4 + T cells and NK (CD49b+/CD3-) cells in MC38 tumor tissues were 4%, <1% and 4.5%, respectively. On the other hand, the percentages of CD8 + T, CD4 + T, and NK cell populations in the TDLNs of TC-1 and MC38 tumor-bearing mice were the same as those in TDLNs of B16 tumor-bearing mice (data not included). Taken together, it is likely that tumor growth inhibition by anti-PD-L1 was more dramatic in B16 tumors (showing 30% of CD8 + T cell infiltration rates) than MC38 tumors (showing 4% of CD8 + T cell infiltration rates). These data support the notion that the infiltration status of immune effector cells in tumor tissues, but not PD-L1 expression, might be associated with the antitumor therapeutic effectiveness of anti-PD-L1. This result is compatible with a previous finding.Citation16
Figure 3. Populations of CD4+ and CD8 + T cells and NK cells in the tumor-draining lymph nodes (TDLNs) and tumor tissues. Each group (n = 5/group) of mice was challenged s.c. with B16 cells. When the tumor sizes became ≅ 2 mm in diameter, the mice were injected i.p. with 100 μg of anti-PD-L1 Abs at 0, 3, 7, 10, and 13 days post-treatment. At 15 days post-treatment, the mice were sacrificed, and TDLNs and tumor tissues were obtained. Immune cells of the TDLNs (5,500 CD45-positive cells) and tumor tissues (2,000 CD45-positive cells) were analyzed for the CD4+ and CD8 + T and NK cell populations
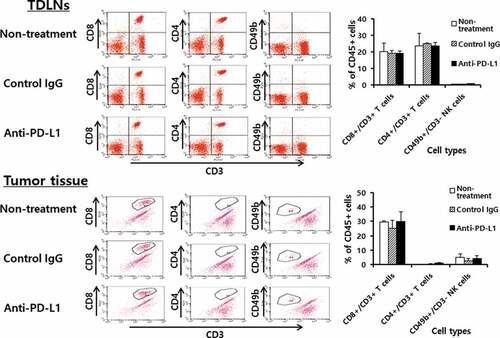
Figure 4. Populations of CD4+ and CD8 + T and NK cells in TC-1 and MC38 tumor tissues. Each group (n = 5/group) of mice was challenged s.c. with TC-1 and MC38 cells. When the tumor sizes became 8 mm, the mice were sacrificed, and the tumor tissues obtained. Immune cells (5,000 CD45-positive cells) of the tumor tissues were analyzed for the CD3+/CD8 + T cell, CD3+/CD4 + T cell, and CD3-/CD49b+ NK cell populations. *p < .05 compared with TC-1
CD8 + T cells and to a lesser degree NK cells were responsible for IFN-γ production
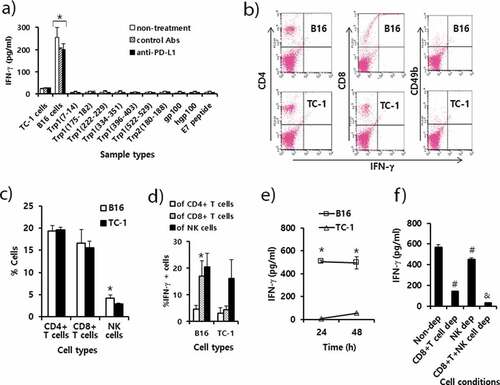
We previously showed that CD8 + T cells and to a lesser degree NK cells play an important role in B16 tumor control by anti-PD-L1 therapy. However, we observed no significant increase in these immune cell subsets in the tumor tissues by anti-PD-L1 therapy. To resolve this conflict, we measured the levels of B16 tumor-specific IFN-γ responses using splenic immune cells from B16 tumor-bearing mice receiving anti-PD-L1 therapy. In this assay, the immune cells were stimulated in vitro with B16 cells and control TC-1 cells, as well as the 9 well-known B16 class I peptides. As shown in ), immune cells from the 3 groups (non-treatment, control Ab and anti-PD-L1 groups) of mice showed a similar but dramatically high level of IFN-γ production when they were stimulated in vitro with B16 cells. However, IFN-γ levels were far lower when the immune cells were stimulated in vitro with control TC-1 cells. This result indicates that anti-PD-L1 had no effect on influencing IFN-γ production by immune cells. Additionally, when the immune cells from the 3 animal groups were stimulated in vitro with each of the 9 well-known B16 class I peptides, they produced a background level of IFN-γ. This result shows that the immune cells, in particular CD8 + T cells were unable to recognize these B16 class I peptides, including Trp2180-188 epitopes, for IFN-γ production. To further test which subsets of immune cells from B16-tumor bearing mice were responsible for IFN-γ production, we performed intracellular IFN-γ staining and FACS analysis. The percentage of NK cells alone, but not CD4 and CD8 + T cells, was increased by stimulation with B16 to a significantly greater extent than by stimulation with TC-1 ()). This result indicates that NK cells proliferated upon stimulation with B16 cells. When the immune cells were stimulated in vitro with B16 cells, 20% of the CD8 + T cells became IFN-γ-positive ()). When the immune cells were stimulated in vitro with TC-1 control cells, less than 5% of the CD8 + T cells were IFN-γ-positive. This result reveals a 4-fold increase in IFN-γ expression by CD8 + T cells after stimulation with B16 in relation to TC-1. Conversely, there was no significant difference in the percentages of IFN-γ-positive CD4 + T and NK cell populations by stimulation with B16 vs. TC-1 cells. These findings indicate that CD8+ cells alone became more reactive to B16 cells for IFN-γ production. ) shows the induction levels of IFN-γ by immune cells after 1 and 2 days of stimulation with B16 and TC-1 control cells. The immune cells produced IFN-γ after 1 and 2 days following stimulation with B16 cells to a significantly greater extent than following stimulation with control TC-1 cells. To test the role of CD8 + T and NK cells in IFN-γ production, we depleted the immune cells of CD8 + T and NK cells and used them for stimulation in vitro with B16 cells. As shown in ), CD8 + T cell-depleted immune cells produced a more dramatically decreased level of IFN-γ compared with the non-depletion controls. In addition, NK cell-depleted immune cells produced significantly less IFN-γ than the non-depletion controls, but far more than the CD8 + T cell-depleted immune cells. However, both CD8 + T and NK cell-depleted immune cells released a background level of IFN-γ. These data support that CD8 + T cells and to a lesser degree NK cells played a major role in producing IFN-γ in this case. In this case, anti-PD-L1 had no positive effect on B16-specific IFN-γ responses, as shown in ). These in vitro data are also in line with our animal data demonstrating the importance of CD8 + T cells and NK cells in B16 control by anti-PD-L1. Thus, it is highly likely that anti-PD-L1 may play a role in preventing B16 cell-reactive CD8 + T cells from being nonfunctional by blocking the PD-L1/PD-1 pathway in the tumor microenvironment. In terms of IFN-γ production, moreover, CD8 + T cells were not reactive to the 9 well-known B16 class I peptides but possibly to as-yet-unknown B16 class I peptides.
Figure 5. Immune cell responses to tumor antigens and melanoma class I peptides in tumor-bearing mice receiving anti-PD-L1 therapy. Each group (n = 5/group) of mice was challenged s.c. with B16 cells. (A) When the tumor sizes became ≅ 2 mm in diameter, the mice were injected i.p. with 100 μg of anti-PD-L1 Abs and control Abs at 0, 3, 7, 10, and 13 days post-treatment. At 15 days post-treatment, the mice were sacrificed, and the spleen was obtained. Six x 106 splenocytes per ml were stimulated with 2 × 10⁶ B16 cells along with TC-1 cells as a control that had been exposed to UV light for 1.5 h. Five μg of peptides per ml were also added to the splenocytes. After 2 days of stimulation, the cell supernatants were collected for measurement of IFN-γ. Values and bars represent IFN-γ concentrations and SD. (B) The splenocytes of the B16 tumor bearing mice (tumor size: 10 mm) were stimulated for 1 day with B16 cells and TC-1 cells as described in Figure 5A. In this case, 1 μM of monensin was added to the cell culture to block the secretion of IFN-γ. The immune cells (5,000 CD45-positive cells) were stained with anti-IFN-γ, along with each immune cell marker. (C) The percentages of CD4 + T cells, CD8 + T cells and CD49b+ NK cells among CD45+ cell populations. (D) The percentages of IFN-γ-positive cells among each population of CD4+ and CD8 + T cells, and NK cells. (E) The splenocytes were stimulated for 1 and 2 days with B16 cells and TC-1 cells, and the levels of IFN-γ were measured as described in Figure 5A, except without the addition of monensin. (F) The splenocytes were stimulated for 2 days with B16 cells, and the levels of IFN-γ were measured as described in Figure 5A. CD8 + T and NK cell-depleted (dep) immune cells were reacted with B16 cells in parallel with non-depleted (dep) whole immune cells. *p < .05 compared with TC-1. #p < .05 compared with non-dep. &p < .05 compared with CD8 + T cell dep or NK cell dep
Evaluation of B16 class I antigens
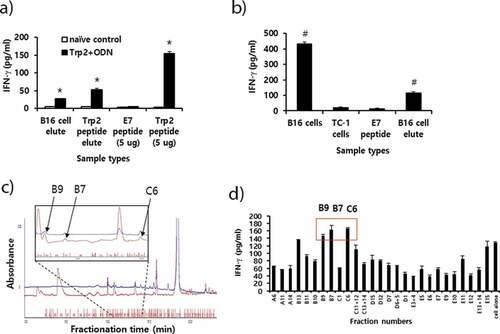
In the study, we observed that Trp2180-188 peptides were not recognized by CD8 + T cells from B16 melanoma-bearing mice with anti-PD-L1 therapy. Moreover, we also failed to detect in vivo CD8+ CTL lytic responses to Trp2180-188 peptides in B16 melanoma-bearing mice receiving anti-PD-L1 (data not included). In contrast, Trp2180-188 peptides were recognized by CD8 + T cells when mice with B16 melanomas were treated with IL-12.Citation25 Therefore, we investigated whether CD8 + T cells from the B16 melanoma-bearing mice might produce IFN-γ in a neoantigen-specific manner. To test this possibility, MHC class I peptides were extracted from B16 cells using citrate-phosphate buffer. The peptides were passed through and eluted from a C18 column. This procedure has been previously reported as a way to obtain MHC class I peptides.Citation34,Citation35 Initially, we tested whether this B16 cell extraction and elution process might lead to isolation of Trp2180-188 peptides. For this test, B16 cell elutes, as well as Trp2 peptides (as a positive control) and E7 peptides (as a negative control), were reacted with immune cells from the animals immunized with Trp2180-188 peptides and CpG-ODN. We also included Trp2180-188 peptide elutes as another positive control, which had been obtained from citrate-phosphate buffer containing 10 μg of Trp2180-188 peptides. As shown in ), the B16 cell elutes stimulated the immune cells from Trp2 peptide-immunized mice, which produced IFN-γ to a dramatic degree, indicating that B16 cell elutes possessed at least Trp2180-188 peptides. As another positive control, the Trp2 peptide elutes also led to IFN-γ production from the immune cells. Additionally, Trp2 peptides (as a positive control) dramatically induced IFN-γ production by immune cells, while E7 peptides (as a negative control) induced a background level of IFN-γ. Conversely, when all these samples were stimulated in vitro with naïve immune cells, they produced a background level of IFN-γ, confirming that the extraction and elution process was effective for this assay and that IFN-γ production was Ag-specific. We next tested whether the B16 cell elutes might be able to stimulate the immune cells from B16 melanoma-bearing mice. As shown in ), the B16 cell elutes activated the immune cells to produce significantly more IFN-γ than the E7 peptides, suggesting that the B16 cell elutes possessed a neoantigen that could stimulate CD8 + T cells in context with MHC class I molecules. To further test whether the B16 cell elutes might possess a fraction of the peptides that might be recognized by CD8 + T cells, the B16 cell elutes were fractionated using RP-HPLC. As shown in .d), various fractions displaying a peak at 214 nm were collected ()) and tested for their ability to stimulate immune cells (from B16 melanoma-bearing mice) for IFN-γ production ()). Among the tested fractions, certain fractions (B7, B9 and C6) elicited the highest level of IFN-γ production, suggesting that these fractions might possess B16 neoantigens that are recognized by CD8 + T cells. Taken together, this study shows that B16 melanoma-bearing mice induce CD8 + T cells recognizing neoantigens but not Trp2 peptides.
Figure 6. Preparation of peptide extracts from B16 cells and their fractionation by reversed-phase high performance liquid chromatography (RP-HPLC) and immunogenicity. (A) Peptides were extracted from B16 cells and desalted using the C18 Sep-Pak column, as described in “Materials and method.” The peptides were eluted with 3 ml of 60% acetonitrile (ACN) in water, of which 300 μl was vacuum-dried and then dissolved in 10% DMSO in PBS. The dissolved B16 cell elute was reacted with 6 × 10⁶ splenocytes from mice that had been immunized twice at 2-week intervals with Trp2 peptides plus CpG-ODN. Additionally, 10 μg of Trp2 peptides was dissolved in 3 ml of citrate-phosphate buffer, followed by passage through a C18 Sep-Pak column as described above. This sample was eluted with 3 ml of 60% ACN in water, of which 300 μl was dried and reacted with 6 × 10⁶ splenocytes from Trp2 peptide+CpG-ODN-immunized mice. For the IFN-γ control, 5 μg of Trp2 and E7 peptides were tested. (B) Negative control (E7 peptide), B16 cell elute, and 1 × 10⁶ of B16 and TC-1 cells were reacted with 6 × 10⁶ splenocytes from B16-bearing mice that had been treated with anti-PD-L1. After 2 days of incubation, the cell supernatants were collected for the IFN-γ assay. (C) Dried peptides from 1 ml of elute were dissolved in DMSO and fractionated by RP-HPLC, as described in “Materials and method.” The fractions displaying a high peak at 214 nm were selected and vacuum-dried. Blue line; peaks at 280 nm. (D) The dried fraction samples were re-suspended in 10% DMSO in water and stimulated for 3 days with 6 × 10⁶ splenocytes from B16 tumor-bearing mice. The cell supernatants were measured for IFN-γ levels. Arrows indicate the fraction number displaying the highest levels of IFN-γ production among the tested samples. *p < .05 compared with naïve control. #p < .05 compared with E7 peptide
A combination of anti-PD-L1 and Trp2 peptide therapy augmented antitumor activity to B16 tumors compared with either single therapy
We have previously reported that Trp2180-188 peptide vaccine therapy is effective for inhibiting B16 tumor growth through induction of Ag-specific CD8 + T cell activity.Citation26 In that study, both Trp2 peptide and CpG-ODN were required as a vaccine component for induction of Trp2-specific CD8 + T and antitumor responses. Consequently, we speculated that combination therapy using anti-PD-L1 antibodies plus Trp2 peptide vaccines might enhance antitumor activity against established B16 melanomas through both reactivation of CD8 + T cells recognizing B16 neoantigens and induction of Trp2-specific CD8 + T cells. As shown in ), B16 tumor (mean tumor sizes; 1.5 mm)-bearing mice with anti-PD-L1 therapy showed significantly more tumor growth inhibition than the control groups. However, the tumor-bearing animals with Trp2 peptide vaccine therapy and combination therapy using Trp2 peptides plus anti-PD-L1 both exhibited similar levels of tumor growth inhibition over the time points. In these 2 groups of mice, a dramatic difference in complete tumor regression rates was observed ()). For example, the tumor-bearing mice with combination therapy using Trp2 peptide vaccines and anti-PD-L1 displayed 20% complete tumor regression rates at 7 days post-treatment and 60% complete tumor regression rates at 10 days post-treatment, while those with Trp2 peptide vaccine therapy alone exhibited 0% complete tumor regression rates at 7 days post-treatment and 0% complete tumor regression rates at 10 days post-treatment. To more closely evaluate tumor growth inhibition patterns between the 2 groups of mice (Trp2 peptide therapy vs. combination therapy using Trp2 peptides and anti-PD-L1), the B16 tumor (mean tumor sizes; 3 mm)-bearing mice were tested. As shown in ), the tumor-bearing animals with combination therapy using Trp2 peptide vaccines and anti-PD-L1 showed significantly more tumor growth inhibition than either single therapy alone over the time points. Moreover, either single therapy alone resulted in more tumor growth inhibition than the non-treatment groups. These results show that a combination of Trp2 peptide vaccines and anti-PD-L1 is more effective for controlling tumor growth than either single therapy alone.
Figure 7. The antitumor activity of anti-PD-L1 Ab treatment in combination with combination therapy using Trp2 peptide vaccines. (A) Each group of mice (n = 5/group) was challenged s.c. with B16 cells. When the tumor sizes became 1.5 mm (A,B) and 3 mm (C) in mean diameter, the mice were injected i.p. with 100 μg of anti-PD-L1 Abs at 0, 3, 7, 10, and 13 days post-treatment. The mice were also treated s.c. with Trp2 peptides plus CpG-ODN at 0 and 7 days post-treatment, as described in “Material and methods”. The tumor sizes were measured over the time points. The values and bars represent mean tumor sizes (A,C) and %complete tumor regression rates (B) and SD, respectively. *p < .05 compared with non-treatment. &p < .05 compared with anti-PD-L1. #p < .05 compared with anti-PD-L1 and Trp2+ ODN+control Ab
Discussion
In this study, we observed that the antitumor therapeutic effects of anti-PD-L1 Abs are largely dependent on the infiltration status of CD8 + T cells in tumor tissues but not the expression status of PD-L1 on the surface of tumor cells. For instance, anti-PD-L1 therapy was not effective for controlling tumor growth in the TC-1 tumor model, but it was somewhat effective for inhibiting tumor growth in the MC38 tumor models. In contrast to TC-1 and MC38 tumors, anti-PD-L1 therapy was more effective for suppressing B16 melanoma growth. Regarding TILs, approximately 1% of CD8 + T and NK cells were present in the TC-1 tumor tissues, while 4 ~ 5% of CD8 + T and NK cells were detected in the MC38 tumor tissues. In contrast, 30% of CD8 + T cells and 4 ~ 5% NK cells were observed in the B16 melanoma tissues. Moreover, this percentage was not affected by anti-PD-L1 therapy, suggesting that anti-PD-L1 was unable to influence the infiltration of effector immune cells into the tumor tissues. Here it is no table that the percentages of T and NK cells in TDLNs were not variable between these tumor models, as previously confirmed in other tumor models.Citation31 In contrast to MC38 and TC-1 tumors, moreover, B16 melanomas likely generate neoantigens possibly due to a high rate of heterogeneity,Citation36 leading to greater production of neoantigen-specific CD8 + T cells and their subsequent infiltration into the tumor microenvironment. It should be noted that TC-1, MC38, and B16 cells expressed PD-L1 on their surface. Moreover, with the use of anti-PD-L1 therapy, tumor antigen-specific CD8 + T cells likely maintain antitumor activity in tumor tissues. In the TC-1 model, however, a small number of TILs are unlikely to affect tumor growth even in the presence of anti-PD-L1 Abs. Our findings are consistent with another report.Citation16 Collectively, it is highly likely that in the presence of anti-PD-L1, TILs behave as an effector cell population for tumor control by becoming active through blocking the interaction between PD-L1 on tumor cells and PD-1 on TILs.
We also observed that anti-PD-L1 therapy suppressed B16 tumor growth by activating antigen-specific CD8 + T and NK cells in tumor tissues. However, when the tumor-removed mice (by surgical method) from B16-melanoma-bearing animals receiving anti-PD-L1 therapy were re-challenged with parental B16 tumor cells, they failed to induce long-term memory responses. This result raises the possibility that tumor-specific CD8 + T cells may not be shifted to memory cells unless they completely remove tumors on their own. This notion is supported by one of our previous findings,Citation26 in which animals showing tumor eradication by their own immune system succeeded in eliciting long-term antitumor memory responses. However, the critical role of CD8 + T cells and NK cells in B16 tumor growth inhibition by anti-PD-L1 therapy is supported by the results of our in vitro studies showing that CD8 + T cells and to a lesser degree NK cells were mainly responsible for IFN-γ production when they reacted with B16 tumor cells. Moreover, when immune cells from B16 melanoma-bearing mice were stimulated with B16 and control TC-1 cells, there was no significant difference in the number of CD4+ and CD8 + T cells. In contrast, NK cells displayed an increase in number when stimulated with B16 cells compared with control TC-1 cells. However, the percentages of IFN-γ-releasing CD8 + T cells were increased by almost 4-fold when the immune cells were stimulated with B16 cells compared with control TC-1 cells. Irrespective of anti-PD-L1 treatment, in particular, the splenic immune cells from B16 tumor-bearing mice produced IFN-γ to a similar degree when stimulated with B16 cells, suggesting that anti-PD-L1 had no influence over the function of CD8 + T cells in the lymphoid organ to produce IFN-γ in an antigen-specific manner. Thus, it seems likely that in the B16 tumor model, Ag-specific CD8 + T cells appear to be mainly reactive to B16 tumor cells for IFN-γ production while having little capacity to kill tumor cells in the tumor microenvironment without the help of anti-PD-L1 Abs.
In contrast to our previous finding,Citation25 anti-PD-L1 therapy failed to induce CD8 + T cells recognizing the immunodominant Trp2180-188 peptides, as well as Trp1 and gp100-associated peptides in this study. This result suggests that B16 tumor-bearing mice induce CD8 + T cells recognizing neoantigens, which become active for tumor cell killing in tumor tissues in response to anti-PD-L1 treatment. In our in vitro immune cell study, the B16 cell peptide elutes (obtained from citrate-phosphate buffer treatment) and some of their HPLC fractions induced IFN-γ production, suggesting that B16 cell elutes likely possessed neo-antigen peptides recognized by CD8 + T cells. In our preliminary study using mass spectrometry analysis, numerous peptide sequences were obtained from the HPLC fractions (B7, B9 and C6). However, when the peptides with relatively high class I binding values in the two class I binding molecule prediction programs, Syfpeithi (http://syfpeithi.de/bin/MHCServer.dll/FindYourMotif.htm) and Rankpep (http://imed.med.ucm.es/Tools/rankpep.html) were synthesized and tested for their ability to induce IFN-γ, no significant induction of IFN-γ was found (data not included), suggesting that the tested peptides may not act as B16 neoantigens. Thus, further study on B16 neoantigen issues remains to be done. We also observed that combination therapy of anti-PD-L1 with Trp2 peptide vaccines inhibited B16 melanoma growth more dramatically than either anti-PD-L1 therapy or Trp2 peptide vaccine therapy alone. Furthermore, this combination allowed tumor-bearing mice to eradicate tumors far earlier than single therapy alone. Our findings are in line with those of others using anti-PD-L1/anti-PD-1 plus other therapy modalities (such as application of LIGHT, IL-12 usage, IL-1β blockade, β-catenin inhibition, enzyme inhibition).Citation16,Citation20–23 In our case, moreover, two subsets of CD8 + T cells specific for B16 neoantigens and Trp2 antigens likely worked synergistically to kill B16 tumors as an antitumor therapeutic synergistic mechanism. Consistent with this hypothesis, we also found that combination therapy using anti-PD-L1 and gemcitabine led to complete tumor regression in the MC38 tumor model, which is in line with our previous results in the TC-1 model.Citation28,Citation30
In conclusion, we found using 3 tumor models (TC-1, MC38, and B16) that the antitumor therapeutic effects of anti-PD-L1 were mainly dependent on the infiltration status of TILs but not the expression status of PD-L1 on tumor cells. In the B16 model, Ag-specific CD8 + T cells and to a lesser degree NK cells were responsible for tumor control in response to anti-PD-L1 therapy. Moreover, combined therapy using anti-PD-L1 antibodies and Trp2 peptide vaccines is more beneficial for controlling B16 melanomas through induction and reactivation of CD8 + T cells specific for Trp2 and other B16 neoantigens.
Abbreviations
| ACN | = | acetonitrile |
| APC | = | allophycocyanin |
| CFSE | = | carboxyfluorescein diacetate succinimidyl ester |
| CTLA-4 | = | cytotoxic T-lymphocyte–associated antigen-4 |
| DMSO | = | dimethyl sulfoxide |
| FACS | = | fluorescence-activated cell sorting |
| FITC | = | fluorescein isothiocyanate |
| HBSS | = | Hanks’ balanced salt solution |
| HPLC | = | high performance liquid chromatography |
| HPV | = | human papillomavirus |
| IgG | = | immunoglobulin G |
| ODN | = | oligodeoxynucleotide |
| PD | = | programmed death |
| PD-L1 | = | programmed death ligand 1 |
| PE | = | picoerythrin; RP, reverse phase |
| TDLNs | = | tumor-draining lymph nodes |
| TFA | = | trifluoroacetic acid |
| TILs | = | tumor-infiltrating lymphocytes |
Author Contribution Statement
Sunhee Ji: animal study and in vitro experiments
Jaeyeon Lee: in vitro experiments
Eung Suk Lee and Dae Hee Kim: anti-PD-L1 antibody purification
Jeong-Im Sin: study design, supervison and manuscript writing
Disclosure of potential conflicts of interest
The authors declare that they do not have any disclosures or competing interest.
Ethical Approval
The mice were cared for under the guidelines of the Institutional Animal Care and Use Committee-approved protocols
Supplemental Material
Download TIFF Image (133 KB)Supplementary Material
Supplemental data for this article can be accessed on the publisher’s website.
Data Availability Statement
The datasets generated during and/or analyzed during the current study are available from the corresponding author on reasonable request.
Additional information
Funding
References
- Barber DL, Wherry EJ, Masopust D, Zhu B, Allison JP, Sharpe AH, Freeman GJ, Ahmed R. Restoring function in exhausted CD8 T cells during chronic viral infection. Nature. 2006;439(7077):682–87. doi:10.1038/nature04444.
- Keir ME, Butte MJ, Freeman GJ, Sharpe AH. PD-1 and its ligands in tolerance and immunity. Annu Rev Immunol. 2008;26:677–704.
- Dong H, Strome SE, Salomao DR, Tamura H, Hirano F, Flies DB, Roche PC, Lu J, Zhu G, Tamada K, et al. Tumor-associated B7-H1 promotes T-cell apoptosis: a potential mechanism of immune evasion. Nat Med. 2002;8:793–800.
- Iwai Y, Ishida M, Tanaka Y, Okazaki T, Honjo T, Minato N. Involvement of PD-L1 on tumor cells in the escape from host immune system and tumor immunotherapy by PD-L1 blockade. Proc Natl Acad Sci USA. 2002;99:12293–97.
- Ramsay AG. Immune checkpoint blockade immunotherapy to activate anti-tumour T-cell immunity. Br J Haematol. 2013;162:313–25.
- Brahmer JR, Tykodi SS, Chow LQ, Hwu WJ, Topalian SL, Hwu P, Drake CG, Camacho LH, Kauh J, Odunsi K, et al. Safety and activity of anti-PD-L1 antibody in patients with advanced cancer. N Engl J Med. 2012;366:2455–65.
- Borghaei H, Paz-Ares L, Horn L, Spigel DR, Steins M, Ready NE, Chow LQ, Vokes EE, Felip E, Holgado E, et al. Nivolumab versus docetaxel in advanced nonsquamous non-small-cell lung cancer. N Engl J Med. 2015;373:1627–39.
- Fehrenbacher L, Spira A, Ballinger M, Kowanetz M, Vansteenkiste J, Mazieres J, Park K, Smith D, Artal-Cortes A, Lewanski C, et al. Atezolizumab versus docetaxel for patients with previously treated non-small-cell lung cancer (POPLAR): a multicentre, open-label, phase 2 randomised controlled trial. Lancet. 2016;387:1837–46.
- Chow L, Haddad R, Gupta S, Mahipal A, Mehra R, Tahara M, Berger R, Eder JP, Burtness B, Lee SH, et al. Antitumor activity of pembrolizumab in biomarker-unselected patients with recurrent and/or metastatic head and neck squamous cell carcinoma: results from the phase Ib KEYNOTE-012 expansion cohort. J Clin Oncol. 2016;34:3838–45.
- Page DB, Postow MA, Callahan MK, Allison JP, Wolchok JD. Immune modulation in cancer with antibodies. Annual Review of Medicine. 2014;65(1):185–202. doi:10.1146/annurev-med-092012-112807.
- Sharma P, Hu-Lieskovan S, Wargo JA, Ribas A. Primary, adaptive, and acquired resistance to cancer immunotherapy. Cell. 2017;168(4):707–23. doi:10.1016/j.cell.2017.01.017.
- Herbst RS, Soria J-C, Kowanetz M, Fine GD, Hamid O, Gordon MS, Sosman JA, McDermott DF, Powderly JD, Gettinger SN. Predictive correlates of response to the anti-PD-L1 antibody MPDL3280A in cancer patients. Nature. 2014;515:563–67.
- Topalian SL, Hodi FS, Brahmer JR, Gettinger SN, Smith DC, McDermott DF, Powderly JD, Carvajal RD, Sosman JA, Atkins MB. Safety, activity, and immune correlates of anti-PD-1 antibody in cancer. N Engl J Med. 2012;366:2443–54.
- Poggio M, Hu T, Pai CC, Chu B, Belair CD, Chang A, Montabana E, Lang UE, Fu Q, Fong L, et al. Suppression of exosomal PD-L1 induces systemic anti-tumor immunity and memory. Cell. 2019;177:414–27.
- Tumeh PC, Harview CL, Yearley JH, Shintaku IP, Taylor EJ, Robert L, Chmielowski B, Spasic M, Henry G, Ciobanu V. PD-1 blockade induces responses by inhibiting adaptive immune resistance. Nature. 2014;515:568–71.
- Tang H, Wang Y, Chlewicki LK, Zhang Y, Guo J, Liang W, Wang J, Wang X, Fu YX. Facilitating T cell infiltration in tumor microenvironment overcomes resistance to PD-L1 blockade. Cancer Cell. 2016;29:285–96.
- Curran MA, Montalvo W, Yagita H, Allison JP. PD-1 and CTLA-4 combination blockade expands infiltrating T cells and reduces regulatory T and myeloid cells within B16 melanoma tumors. Proc Natl Acad Sci USA. 2010;107:4275–80.
- Duraiswamy J, Kaluza KM, Freeman GJ, Coukos G. Dual blockade of PD-1 and CTLA-4 combined with tumor vaccine effectively restores T-cell rejection function in tumors. Cancer Res. 2013;73:3591–603.
- Hodi FS, Chesney J, Pavlick AC, Robert C, Grossmann KF, McDermott DF, Linette GP, Meyer N, Giguere JK, Agarwala SS, et al. Combined nivolumab and ipilimumab versus ipilimumab alone in patients with advanced melanoma: 2-year overall survival outcomes in a multicentre, randomised, controlled, phase 2 trial. Lancet Oncol. 2016;17:1558–68.
- Xu C, Zhang Y, Rolfe PA, Hernández VM, Guzman W, Kradjian G, Marelli B, Qin G, Qi J, Wang H, et al. Combination therapy with NHS-muIL12 and avelumab (anti-PD-L1) enhances antitumor efficacy in preclinical cancer models. Clin Cancer Res. 2017;23:5869–80.
- Kaplanov I, Carmi Y, Kornetsky R, Shemesh A, Shurin GV, Shurin MR, Dinarello CA, Voronov E, Apte RN. Blocking IL-1β reverses the immunosuppression in mouse breast cancer and synergizes with anti-PD-1 for tumor abrogation. Proc Natl Acad Sci USA. 2019;116:1361–69.
- Ganesh S, Shui X, Craig KP, Park J, Wang W, Brown BD, Abrams MT. RNAi-mediated β-catenin inhibition promotes T cell infiltration and antitumor activity in combination with immune checkpoint blockade. Mol Ther. 2018;26:2567–79.
- Sharma NS, Gupta VK, Garrido VT, Hadad R, Durden BC, Kesh K, Giri B, Ferrantella A, Dudeja V, Saluja A, et al. Targeting tumor-intrinsic hexosamine biosynthesis sensitizes pancreatic cancer to anti-PD1 therapy. J Clin Invest. 2020;130:451–65.
- Sin JI, Kim JM, Bae SH, Lee IH, Park JS, Ryoo HM. Adoptive transfer of human papillomavirus E7-specific CTL enhances tumor chemoresponse through the perforin/granzyme-mediated pathway. Mol Ther. 2009;17:906–13.
- Sin JI, Park JB, Lee IH, Park D, Choi YS, Choe J, Celis E. Intratumoral electroporation of IL-12 cDNA eradicates established melanomas by Trp2180-188-specific CD8+ CTLs in a perforin/granzyme-mediated and IFN-γ-dependent manner: application of Trp2180-188 peptides. Cancer Immunol Immunother. 2012;61:1671–82.
- Sin JI, Kim H, Ahn E, Jeon YH, Park WS, Lee SY, Kwon B. Combined stimulation of TLR9 and 4-1BB augments Trp2 peptide vaccine-mediated melanoma rejection by increasing Ag-specific CTLs and their infiltration into tumor sites. Cancer Lett. 2013;330:190–99.
- Ahn E, Kim H, Han KT, Sin JI. A loss of antitumor therapeutic activity of CEA DNA vaccines is associated with the lack of tumor cells’ antigen presentation to Ag-specific CTLs in a colon cancer model. Cancer Lett. 2015;356:676–85.
- Bae SH, Park YJ, Park JB, Choi YS, Kim MS, Sin JI. Therapeutic synergy of human papillomavirus E7 subunit vaccines plus cisplatin in an animal tumor model: causal involvement of increased sensitivity of cisplatin-treated tumors to CTL-mediated killing in therapeutic synergy. Clin Cancer Res. 2007;13:341–49.
- Ye GW, Park JB, Park YJ, Choi YS, Sin JI. Increased sensitivity of radiated murine cervical cancer tumors to E7 subunit vaccine-driven CTL-mediated killing induces synergistic antitumor activity. Mol Ther. 2007;15:1564–70.
- Jang HY, Han BS, Kwon B, Sin JI. Optimized gemcitabine therapy in combination with E7 peptide immunization elicits tumor cure by preventing Ag-specific CTL inhibition in animals with large established tumors. DNA & Cell Biol. 2018;37:850–60.
- Danishmalik SN, Lee SH, Sin JI. Tumor regression is mediated by induction of HER263-71-specific CD8+ CTLs in a 4T1.2/HER2 tumor model: no involvement of CD80 in tumor control. Oncotarget. 2017;8::26771–88.
- Choi JR, Kim MJ, Tae N, Wi TM, Kim SH, Lee ES, Kim DH. BLI-based functional assay in phage display benefits the development of a PD-L1-targeting therapeutic antibody. Viruses. 2020:12. doi:10.3390/v12060684.
- Han BS, Jang HY, Racine T, Qiu X, Sin JI. Purification and characterization of monoclonal IgG antibodies recognizing Ebola virus glycoprotein. Clin Exp Vaccine Res. 2018;7:119–28.
- Storkus WJ, Zeh HJ. 3rd. **J Immunother Emphasis Tumor Immunol. 1993;14:94–103.
- Huang AY, Gulden PH, Woods AS, Thomas MC, Tong CD, Wang W, Engelhard VH, Pasternack G, Cotter R, Hunt D, et al. The immunodominant major histocompatibility complex class I-restricted antigen of a murine colon tumor derives from an endogenous retroviral gene product. Proc Natl Acad Sci USA. 1996;93:9730–35.
- Lawrence MS, Stojanov P, Polak P, Kryukov GV, Cibulskis K, Sivachenko A, Carter SL, Stewart C, Mermel CH, Roberts SA, et al. Mutational heterogeneity in cancer and the search for new cancer-associated genes. Nature. 2013;499:214–18.