
ABSTRACT
Social media, and in particularly Twitter, can be a resource of enormous value to retrieve information about the opinion of general populaton to vaccines. The increasing popularity of this social media has allowed to use its content to have a clear picture of their users on this topic. In this paper, we perform a study about vaccine-related messages published in Spanish during 2015–2018. More specifically, the paper has focused on two specific diseases: influenza and measles (and MMR as its vaccine). By also including an analysis about the sentiment expressed on the published tweets, we have been able to identify the type of messages that are published on Twitter with respect these two pathologies and their vaccines. Results showed that in contrary on popular opinions, most of the messages published are non-negative. On the other hand, the analysis showed that some messages attracted a huge attention and provoked peaks in the number of published tweets, explaining some changes in the observed trends.
Introduction
In this era of new technologies and globalization, the amount of knowledge that we generate, and that is searchable worldwide, is increasing in a daily basis. The main source for such a vast amount of data is the Internet, where different formats, services and applications coexist in an interconnected network. During the past years, the Internet has not only redefined the way we obtain information about almost any field, but also the way we communicate and interact with other individuals.
Regarding this context, people can search, share information and express health-related opinions on the Internet.Citation1 Utilizing the derived data and incorporating it in research studies can enhance social wellbeing by means of improving healthcare strategies.Citation2 A wide range of diverse works corroborate this idea,Citation3–8 referring to social media as one of the major Internet channels were this kind of information is engaged.
Social media is a global term that can be defined as “a group of Internet-based applications that are built on the ideological and technological foundations of Web 2.0, and that allow the creation and exchange of user-generated content”.Citation9 Therefore, social media brings together multiple services of different nature, where billions of peopleCitation10 from all types of communities around the world virtually interact and post opinions, ideas and contents, including those about health issues.Citation11 Utilities of analyzing health-scope social media data vary from predicting disease outbreaks,Citation12,Citation13 assessing epidemiological patterns,Citation14 preventing suicide,Citation15,Citation16 detecting drug side effectsCitation17 or strengthening medication safety.Citation18
The condition of such a platform makes it ideal to open debates about any topic, but when talking about health, some online interventions and dialogs may be facilitating misinformation.Citation19 The anti-vaccine movement is one of the principal cases of the aforementioned environment.Citation20 Several studies present the influence of this kind of discourses, mostly in Twitter and Facebook, on the increase of vaccine hesitancy.Citation21,Citation22 This fact can conduct to serious public health problems since it raises population fear and loss in vaccine confidence.Citation23,Citation24 As vaccine acceptability and vaccination rates connected to misinformation decrease, the risk of disease outbreaks gets higher.Citation25,Citation26
Related works cover a large number of vaccines and diseases. Numerous analyses have been developed around the early detection or vaccine uptake of influenza.Citation12,Citation27–29 Moreover, many other researches have studied the controversy on social media and the vaccination refusal of human papillomavirus (HPV)Citation23,Citation30–36 or HPV vaccination campaign analysis.Citation37,Citation38 More examples of vaccines whose related sentiments and opinions have been investigated on the media are those related to polio,Citation39 measlesCitation40,Citation41 or the MMR (measles – mumps – rubella) vaccine.Citation42
In the present paper, we present an exhaustive analysis of influenza and measles vaccine-related messages published in Twitter in Spanish language during the period 2015–2018. The rest of the paper is organized as follows: Section 2 shows the followed methodology, including descriptions of the sample selection, the sample extraction and the sentiment analysis, and providing a glossary of terms. Section 3 details the results obtained when performing the descriptive analysis of the tweets subsets and Section 4 discusses on such results. Section 5 highlights the achieved conclusions.
Methods
General methodology
The goal of the paper is to show and analyze the impact and trends of messages published in Twitter in Spanish referred to influenza, measles, and MMR. The analysis has been performed by using several variables such as the sentiment expressed in the tweets, tweet location or repercussion (retweets, favs) among other characteristics.
In this context, the methodology that has been utilized in this paper consists on the selection and extraction of the sample to be studied, based on the keywords to be search; the extraction of the tweets that conform the study using the tools available at Twitter; the identification of the sentiment expressed in the messages by using both commercial tools and developing new mechanisms based on machine learning (ML); and the final descriptive analysis of the obtained results.
While different technical approaches have been implemented and used in this study, especially for the identification of the sentiment expressed on the tweets, the aim of this paper is to focus on a descriptive analysis of the tweets referred to influenza, measles and MMR using the characteristics already described. For this reason, the paper will not dig into the technical details about the tweet sentiment identification, which has been already described with anteriority.Citation43
Sample selection
The study procedure was approved by the Ethics Committee of Universidad Politécnica de Madrid under the title “Analysis of Spanish social media vaccines messages: The MAVIS Study” on April 12, 2019. The dataset retrieved consisted in all the tweets published in Spanish in Twitter from January 1 2015 to December 31, 2018 that contained the following keyword pattern:
((vacuna OR vacunas OR vacunación OR vacunaciones) (VPH OR Papilomavirus OR Cervarix OR Gardasil OR Rotavirus OR Rotarix OR Rotateq OR Sarampión OR Triple vírica OR Hepatitis OR Neumococo OR Prevenar OR Synflorix OR Enfermedad neumocócica invasora OR Enfermedad neumocócica invasiva OR ENI OR Varicela OR Varivax OR Varilrix OR Zoster OR Tosferina OR Gripe OR Enfermedad meningocócica invasora OR Enfermedad meningocócica invasiva OR EMI OR Meningitis OR Bexsero OR Trumenba OR Nimenrix OR Menveo OR Sepsis))
The query allowed to retrieve any tweet containing “vacuna”, “vacunas”, “vacunación” or “vacunaciones” (different forms of the vaccine noun and verb) plus any of the keywords that can be seen in the second part of the query which contains the name of the vaccines and diseases to be studied.
The diseases and vaccines to be studied (when applicable), translated to English can be found in .
Table 1. Concepts used in the search
Whilst as can be seen the search criteria used included several other pathologies and vaccine names, current paper will be focused mainly on the analysis of influenza, measles and MMR. The main reason to focus on those concepts was based on the obtained results: influenza is a seasonal disease and for hence the information published on social media mainly follows seasonal patterns, being of greater interest to analyze the type of messages available on social media about this type of pathologies. On the other hand, we could observe in the general results that measles had an atypical behavior in the frequency and type of messages published, being possible to analyze more in depth and obtain interesting results.
Sample extraction
Twitter data was obtained by using the official API (Application Programming Interface), from which all the needed information for the current study could be extracted. The execution of the extraction process obtained a total of 1,028,421 tweets, from which 318,133 were different/original tweets. The number of retweets was 710,288 and the number of tweets quoted from the original tweets was 65,793. The keywords used in the search were mentioned 1,187,046 times. After extracting all the tweets, they were all submitted to a cleaning process in order to get a consistent and understandable version of the texts. Hashtags (#), user mentions (@), URLs, e-mail addresses, retweet markers (RT:) and emojis and other non-representable characters were removed. Stop words were not removed since they could affect the general meaning of tweets and its removal did not improve sentiment classification models.Citation44
The precise numbers of tweets in the context of the groups of keywords subject to analysis (Gripe (Influenza); Sarampión (Measles) and Triple Vírica (MMR)) is provided in subsection 2.5 – Glossary terms. Moreover, detailed descriptions of the different types of classification used for tweets are included.
All the data used for the current analysis have been uploaded to a public repository.Citation45
Sentiment analysis
The detection of the sentiment expressed in a text is a complex task with many challenges.Citation46 Currently, there are plenty of methods and models that have been developed to detect the polarity of a text as can be drawn from the different papers that have been published during the last years, analyzing approachesCitation47 such as lexicon-based methods,Citation48 ontology-based approaches,Citation49 or deep learningCitation50 among others. Sentiment analysis over textual data, and specially over Twitter, has been one of the hottest research topics in the area of Natural Language Processing and text mining. The reason behind such interest are the potential applications that the companies can make of such useful knowledge.
However, even considering the large amount of research that has been done on this area, the models created to identify the polarity of a text are very sensitive. Most of the models have been created using large amounts of a corpus containing different types and topics of sentences. For this reason, the models are mainly created to be as general as possible. And the main problem that emerges from these approaches is that general models tend to fail when dealing with specialized domains.
On the other hand, the creation of ad-hoc models to identify sentiments in texts of a very specific domain requires a large amount of effort which clearly overpass the goals aimed at this scientific work. In the context of this study, the creation of ad-hoc models was unaffordable. For this reason, the team decided to explore the use commercial tools to solve the problem of identifying the sentiment in Tweets. Three different tools were explored for this goal:
IBM: International Business Machines Corporation (IBM) offers a service named “Natural Language Understanding” which belongs to the “IBM Cloud” suite. This service allows for analyzing the characteristics of natural language texts. As part of the functionalities of the service, it allows analyzing categories, concepts, emotions, entities, keywords, metadata, relations, semantic roles, and syntaxis.
Google Cloud: Google offers a service named the “Cloud Natural Language” which belongs to “Google Cloud” (GC) suite. This service allows for analyzing the characteristics of natural language texts. As in the previous tool, this service allows retrieving several characteristics from a text.
Meaning Cloud: Meaning Cloud (MC) offers a service named “Sentiment Analysis API”. This service allows for analyzing the characteristics of natural language texts. As in the previous tools, this service allows retrieving several characteristics from a text.
The analysis of the three tools showed that for a given tweet, the results returned by the system were not enough accurate to be used to classify the sentiment of the tweets. Although a manual validation of the three systems independently showed a barely reasonable accuracy, the reality is that none of the systems separately provides sufficiently accuracy to consider the use of the system to identify the sentiment expressed. The results fromCitation43 showed that the use of commercial tools independently did not provide enough accuracy in the identification of the tweets individually. The agreement level between both tools and evaluators was quite uneven, as it can be seen in.Citation45 The tools were not able to separately capture the nature of the sentiment expressed in the tweets and evaluators did not agree in some cases. However, the creation of the meta-model using as input the outputs of such tools allowed achieving a higher accuracy, improving the previous results given by the commercial tools.
For this reason, a meta-model based on ML techniques was created to identify the sentiment expressed in the tweets of our dataset, using as input variables the results of the commercial tools. As has been described, the metamodel (created by a Random Forests classifier) allows to identify the sentiment expressed with a ROC value of 0.86.Citation43 Such ROC value ascended to 0.9 when generating the model by up-sampling the under-represented negative tweets set.Citation51 Further comparisons with other ML techniques (MultiLayer Perceptron, C5.0, Logit Boost, Bayes and Support Vector Machine methods) to develop this metamodel can be explored in the previous work.Citation51
Glossary terms
There are several ways of classifying tweets: by their nature (whether it is an original tweet or a retweet, may be a quote and/or a reply); by their repercussion (whether the tweet has been retweeted, replied, quoted or marked as favorite); by their localization (whether the tweet is associated to geoinformation); by the keywords they mention (in the present paper, whether a tweet is associated to Influenza group or to Measles and MMR group); or by the polarity they are assigned by the meta-model (whether a tweet is considered negative or non-negative from the sentiment point of view). The same tweet can belong at the same time to different classes. The definition of each of the different types of tweets according to the exposed classifications and the total numbers stored in the dataset are provided below.
Tweet (T). Any of the Twitter posts, regardless its classification. 1,028,421
Ts by the mentioned keywords:
Influenza tweet (inflT). Tweet which text contains the term “gripe”. If not specified, those inflTs include any of the other classification types of Ts. There was a total of 184,139 inflTs in the database.
Measles and MMR tweet (m-mmrT). Tweet which text contains the terms “sarampion” and/or “triple virica”. If not specified, those m-mmrTs include any of the other classification types of Ts. There was a total of 263,920 m-mmrTs in the database, 258,810 mentioning “sarampion”, 6,152 mentioning “triple virica” and 1,042 mentioning both.
Ts types by their nature:
Original tweet (OT). Tweet that is not a retweet. It can be a tweet that someone has posted directly, a reply to another tweet or a quote, but the text in it is originally published and different from the other OT texts. Tweets with different texts before the cleaning process but with same cleaned text afterward are also included here. In some situations, those happen to seem to be published by bots. In the complete set of Ts, there were 318,133 OTs.
Retweet (RT). Tweet that is a retweet of another post. The user does not post original text in it. In the complete set, there were 710,288 RTs.
Quote tweet (QT). Tweet that is itself a quote of any other tweet, that is, an interaction with other tweet that includes a comment. The content of the texts in these tweets is originally posted by the user that is quoting. Therefore, QTs are sometimes OTs, since they include original text contents, but in some cases are RTs, given the users interactions. In the complete database, there were 65,793 QTs, from which 402 were set as OTs and 65,391 were considered RTs.
Reply tweet (RPLT). Tweet that is itself a reply to another tweet. Most of the times, a RPLT is an OT, but there are a few exceptions were RPLTs are seen as RTs. In the complete set of Ts, there were 24,007 RPLTs, from which 23,774 were OTs and 233 were RTs.
The numbers of Ts classified within the previous typologies according to the mentioned keywords are provided in and .
Table 2. Numbers of the different subsets of Ts based on the mentioned keywords and their nature (OTs vs RTs)
Table 3. Numbers of the different subsets of Ts based on the mentioned keywords and their nature (comparing RPLTs vs QTs and OTs vs RTs)
Ts types by their repercussion:
retweeted tweet (rtedT). Tweet that has been retweeted by other tweet(s) at least once. In the complete database, there were 59,231 rtedTs.
replied tweet (rpledT). Tweet that has been replied by other tweet(s) at least once. In the complete database, there were 8,956 rpledTs.
quoted tweet (qtedT). Tweet that has been quoted by other tweet(s) at least once. In the complete database, there were 3,710 qtedTs.
favorite tweet (favT). Tweet that has been marked as least once as favorite. In the complete database, there were 54,112 favTs.
The numbers of Ts that were categorized as to be the mentioned repercussion types in the different keywords’ groups are provided in .
Table 4. Number of the different subsets of Ts based on the mentioned keywords and their repercussion
Ts types by their location:
Geolocated tweet (geoT). Tweet that has associated geolocation information. Such information can include the particular coordinates, the country, the locality, the region, the subregion and/or the hemisphere. In the complete database, there were 543,738 geoTs.
Ts by their polarity:
Negative tweet (negT). Tweet that has been classified by the meta-model as to have a negative sentiment. In the complete database, there were 20,324 negTs.
Non-negative tweet (non-negT). Tweet that has been classified by the meta-model as to have a non-negative (positive or neutral) sentiment. In the complete database, there were 363,200 non-negTs.
The numbers of Ts that were tagged with location information and/or polarity classified (and the actual classification) regarding the mentioned keywords are displayed in .
Table 5. Number of different Ts according to the mentioned keywords in two subsets: polarity annotated Ts and geoTs
Results
In this section, the descriptive analysis that has been performed in the case of the tweets related to first Influenza and second Measles and MMR is presented.
Influenza
As it has already been stated, a total of 184,139 Ts mentioning the term “gripe” were obtained: 31,745 inflTs were posted in the year 2015, 47,736 inflTs in 2016, 38,414 inflTs in 2017 and 66,244 inflTs in 2018. The tendency of those numbers of inflTs each month is summarized in , where colors represent the different years.
Figure 1. Tendency of the number of inflTs each month colored by their corresponding year.
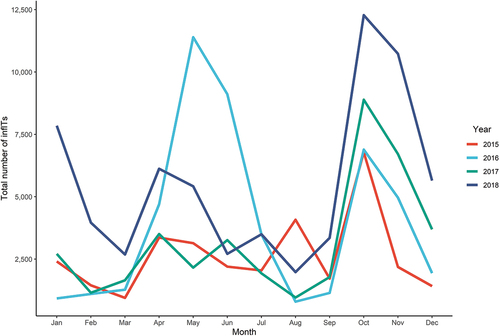
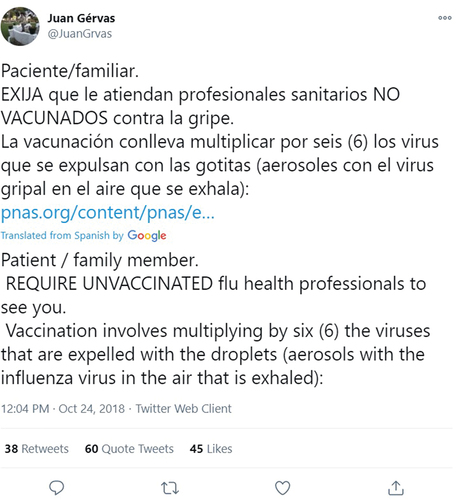
There was an increase of the number of tweets all the years during the months of October and November, being especially relevant in 2018, although it follows the trend of previous years. In October 2018, a total of 12,281 inflTs were posted, from which 4,019 were OTs and 8,262 were RTs. Most of them were published in Spain; 402 were neg-Ts and 4,473 were non-negTs. The neg_rtedT that had the highest impact, with 243 times retweeted and 272 times repeated its cleaned text, was posted in Spain by the user @JuanGrvas. The cleaned text was as follows: “Paciente/familiar. EXIJA que le atiendan profesionales sanitarios NO VACUNADOS contra la gripe. La vacunación conlleva multiplicar por seis (6) los virus que se expulsan con las gotitas (aerosoles con el virus gripal en el aire que se exhala)”. The T and its translation is shown in .
Figure 2. Most repeated infl_negT during the unusual event of October 2018. All information shown here refers to the time when the screenshot was taken, which can differ from the information at the present time and at the time the analysis was performed. Includes automatic translation to English from Twitter.
Another significant peak can be found at the months of May-June of the year 2016, where there was a strong rise comparing to other years’ trends. The number of infTs published in May 2016 was 11,396, where 5,697 were OTs and 5,699 were RTs. The rtedT with the highest repercussion was retweeted 159 times, and its text content revolved around Influenza A (“Se están empezando a morir médicos x la Gripe A y las vacunas no aparecen. Difundamos. Se oculta la información.” – approximate translation: “Physicians are starting to die because of Influenza A and the vaccines are not appearing. Spread the word. Information is being hide”). It was a non-negT and it can be consulted at . The most repeated cleaned text along that period of time was “Los jugadores se vacunaron contra la gripe antes de irse de vacaciones. ¿Vos ya lo hiciste?” – approximate translation: “The players get vaccined against influenza before going to holiday. Did you?”). The majority of inflTs posted in May 2016 came from users from Argentina (4,408 inflTs) and Uruguay (1,109 inflTs), and 5,232 were classified as non-negTs while 520 were tagged as negTs.
Figure 3. Most infl_rtedT during the event of May 2016. All the information shown here refers to the time when the screenshot was taken, which can differ from the information at the present time and at the time the analysis was performed. Includes automatic translation to English from Twitter.

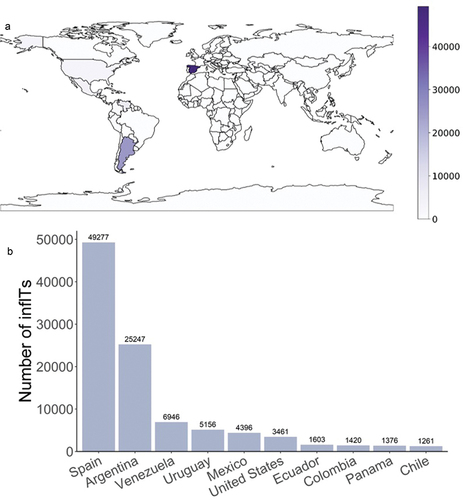
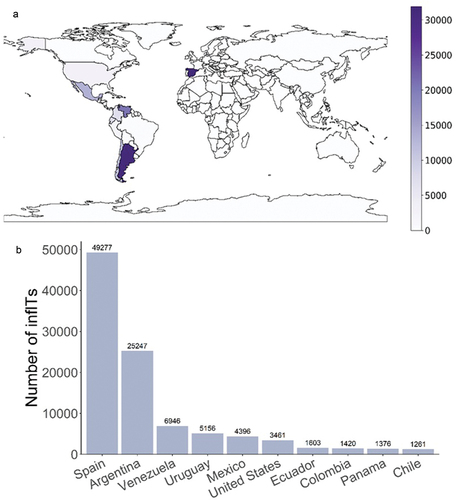
In the context of geoTs, 109,528 inflTs were annotated with location information. The highest rates were found in Spain (49,277 inflTs) followed by Argentina (25,247 inflTs). The distribution across the world is presented in and the ten countries where most inflTs were posted are included in .
Figure 4. Number of inflTs in the context of geoTs. (a) World map showing the distribution of the number of inflTs across the different countries. (b) Number of inflTs published in each country. For the sake of clarity, only the top ten countries with highest number numbers of posts are presented.
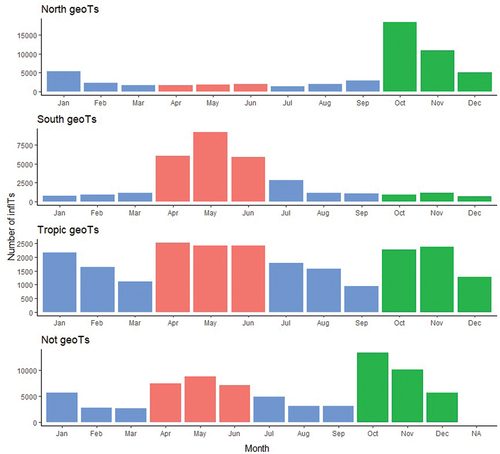
Influenza is a disease that presents a seasonal behavior, which was therefore depicted in the tendencies of the number of inflTs. They varied not only over the time of the year but also over the different locations, conducting to different tendencies of posts in the North and South hemispheres. It was observed a high increase of the posts in those months that corresponded to Influenza vaccination campaigns, as shown in . That is, in the North hemisphere, increases took place mostly during October-November and December (in green); and in the South hemisphere, during April-May-June (in red). By contrast, the rest of the months (in blue) presented a lower number of inflTs. In the Tropic and in not-geoTs, both hemispheres’ patterns were shown together.
Figure 5. Number of inflTs corresponding to each month and location, colored by seasonal information. Blue represents winter and summer season. While red represents spring in the north hemisphere and autumn in the south, green represents autumn in the north and spring in the south.
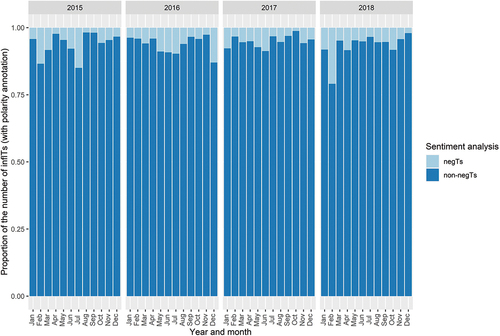
Regarding polarity classification, there were 88,670 inflTs sentiment annotated. The percentage of negTs was 6.08% against the 93.92% of non-negTs. High rates of negTs (when compared with the general trend) were posted by users in Argentina (43.09% of infl_neg_geoTs), while most non-negTs were published in Spain (27.15% of infl_non-neg_geoTs). The 90.89% of negTs were OTs. The proportion of neg (light blue) and non-neg (dark blue) inflTs along the months in the different years is represented in .
Figure 6. Proportion of negTs and non-negTs each year and month, in the case of inflTs.
Although the number of negTs was always lower than the number of the non-negTs, there was one month, February of 2018, when the number of negTs relatively increased. To have more insights of what was causing that increment of negTs, inflTs posted in February 2018 with polarity information were analyzed. The number of inflTs classified as negTs was 452; and as non-negTs, 1,713. There were 277 negTs with repeated cleaned texts related to vaccinated infants’ Influenza-caused deaths (“VACUNA CONTRA LA GRIPE: LOS NIÑOS VACUNADOS SIGUEN MURIENDO DE GRIPE” – approximate translation: “Influenza vaccine: Vaccine kids are still dying because of influenza”), which represented more than half of such event negTs content. They were all published in Argentina.
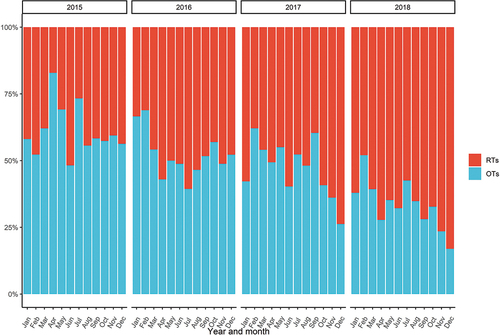
The distribution of the different types of Ts in the context of their nature and repercussion was also analyzed. A percentage of 44.1% inflTs were OTs and 55.1% were RTs. However, this proportion evolved in time, resulting in an increment of the number of RTs in the general trend in the last months of 2018, as it can be seen in . The percentage of the rest of subsets over the total of 184,139 inflTs hardly evolved during the years and months, being as follows: 3.29% were RPLTs, 3.77% were QTs, 10.69% were rtedTs, 4.1% were rpledTs, 1.37% were qtedTs and 12.49% were favTs. For all the classifications here mentioned, the distribution over seasons and hemispheres of the different percentages neither significantly changed.
Figure 7. Evolution of the proportion of OTs and RTs over time in the case of inflTs.
Nevertheless, it was important to analyze the differences of sentiment annotations in the previous subsets. The exact proportions of each nature and repercussion subsets’ negTs and non-negTs are displayed in . While the overall percentage was 6.08% of negTs and 93.92% of non-negTs, there were some types of inflTs that did not followed such distribution. OTs had a lower rate of negTs (5.64%) whereas RTs showed a higher proportion (7.71%). RPLTs and rpledTs presented relevantly larger rates of negTs (9.97% and 8.97% respectively).
Table 6. Proportion of the different subsets of inflTs regarding their nature and repercussion and on the basis of the sentiment annotation (negTs vs non-negTs)
Measles and MMR
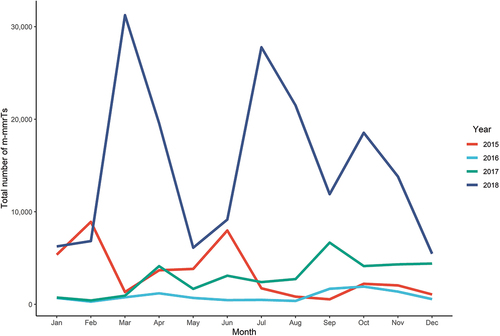
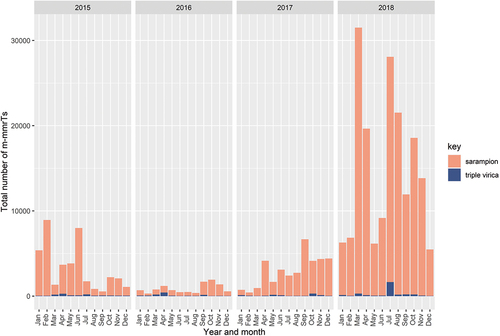
As mentioned before, a total of 263,920 Ts containing the term “sarampion” and/or the term “triple virica” were obtained: 39,561 m-mmrTs were posted in the year 2015, 10,473 m-mmrTs in 2016, 35,652 m-mmrTs in 2017 and 178,234 m-mmrTs in 2018. The tendency of those numbers of m-mmrTs each month is summarized in , where colors represent the different years. The number of m-mmrTs was significantly higher in 2018, but there was not a general trend over the different years.
Figure 8. Tendency of the number of m-mmrTs each month colored by their corresponding year.
In the context of geoTs, 145,460 m-mmrTs were location-tagged. The highest rates of m-mmrTs were again found in Argentina (with 33,874 m-mmrTs) closely followed by Spain (with 33,149 m-mmrTs). illustrates the m-mmrTs distribution across the world and presents the number of tweets published in the top ten countries associated with highest m-mmrTs’ number of publications.
Figure 9. Number of m-mmrTs in the context of geoTs. (a) World map showing the distribution of the number of m-mmrTs across the different countries. (b) Number of m-mmrTs published in each country. For the sake of clarity, only the top ten countries with highest number numbers of posts are presented.
In the case of m-mmrTs, visualizations from the location and seasonal context point of view did not provide relevant information and, therefore, have not been included in the present manuscript.
The evolution along time of the number of m-mmrTs that mentioned each of the terms “sarampion” (in orange) and “triple virica” (in purple) is shown in . The general trend was that the number decreased from the year 2015 to 2016, and then increased again in 2017. In 2018, such growth was larger. Compared to the times that the term “sarampion” was present in m-mmrTs, the keyword “triple virica” was mentioned a significantly lower number of times. However, in proportion to the total number of m-mmrTs related just to “triple virica”, there was an important rise of those posts in July 2018. Special attention must be paid to the greater peaks presented during the months of March-April 2018 and July-August 2018. Such events will be better covered and analyzed further on.
Figure 10. Number of m-mmrTs mentioning the terms “sarampion” (in orange) and “triple virica” (in purple) each year and month.
Regarding the polarity classification of m-mmrTs, there were 70,044 m-mmrTs sentiment classified. Once again, the overall percentage of non-negTs (95.72%) was higher than negTs ones (4.28%). That is, such a difference was even greater than for inflTs. The progression of the proportion of negTs (light blue) and non- negTs (dark blue) along time is presented in .
Figure 11. Proportion of negTs and non-negTs each year and month, in the case of m-mmrTs.
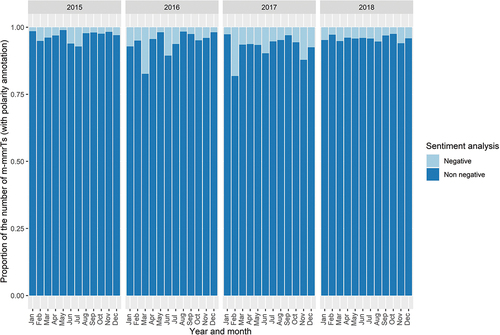
Two increases of negTs took place on March 2016 and February 2017. The first one corresponded to the event that will be later explained. Regarding the second, in February 2017, 423 m-mmrTs were posted, but only 98 were sentiment annotated (18 were negTs and 79 non-negTs) since they were the only ones that had original text content. The most repeated negT contained the cleaned text “La vacunación global contra el sarampión, insuficiente” (approximate translation: “Global vaccination against measles, insufficient”.
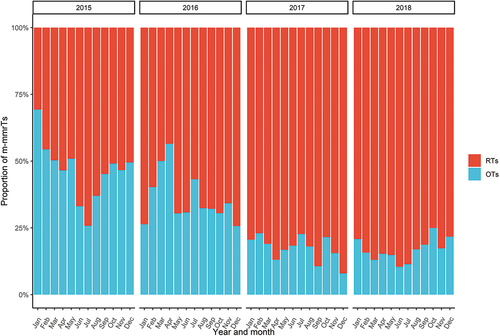
In the context of the different nature-classified m-mmrTs distributions, a percentage of 21.58% were OTs and 78.42% were RTs. In this case, the number of RTs was much higher than when compared to inflTs (55.1% inlf_RTs). Likewise, inflTs, m-mmrTs rates of OTs and RTs evolved during time, increasing the number of RTs in the general trend, specifically in the last months of 2018. That performance is reflected in . The percentage of the rest of nature and repercussion subsets over the total of 263,920 m-mmrTs, scarcely neither changed along the years and months: 1.63% were RPLTs; 4.97% were QTs; 7.32% were rtedTs; 2.2% were rpledTs; 1.04% were qtedTs and 7.17% were favTs. While the average number of m-mmr_RTs was higher than infl_RTs, and except from QTs, all of the other m-mmrTs categories presented lower rates than inflTs.
Figure 12. Evolution of the proportion of OTs and RTs over time in the case of m-mmrTs.
The differences of polarity classification of the former m-mmrTs subsets are included in . The overall percentage was 4.28% of negTs and 95.72% of non-negTs. It is noticeable that, this time, the proportion of neg_RTs was lower than in the general set (1.81%), whilst OTs’ percentage was similar (4.25%). However, RPLTs presented the triple rate of negTs (12.05%), and rtedTs, rpledTs and qtedTs also had higher proportions than the average (5.15%; 7.35% and 5.66% respectively).
Table 7. Proportion of the different subsets of m-mmrTs regarding their nature and repercussion and on the basis of the sentiment annotation (negTs vs non-negTs)
In 2018, there were two atypical periods of time were the number of m-mmrTs soared: the event of March-April and the event of July-August. In both situations, there were a few OTs that were largely repeated.
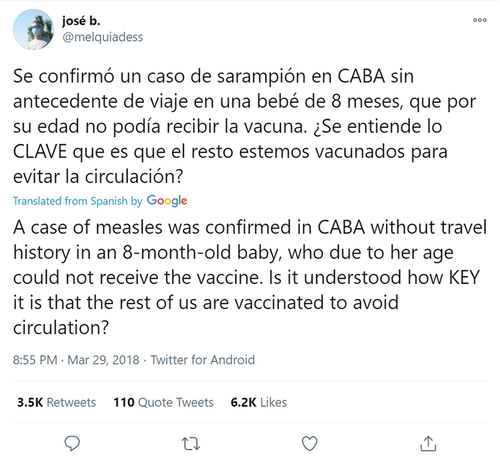
During the months of March and April of 2018 there was an unusual increasement in the number of m-mmrTs. Argentina, Ecuador and Venezuela were the three countries were most of the m-mmrTs were posted. One of the m-mmrT coming from this atypical period is included in . The m-mmrT was repeated 3,305 times and was posted by the user @melquiadess. The geoinformation of such user pointed to Buenos Aires, Argentina. It had 9,497 followers and a total of 57,797 published tweets.
Figure 13. Most repeated OT_m-mmrT during the unusual event of March-April 2018. All the information shown here refers to the time when the screenshot was taken, which can differ from the information at the present time and at the time the analysis was performed. Includes automatic translation to English from Twitter.
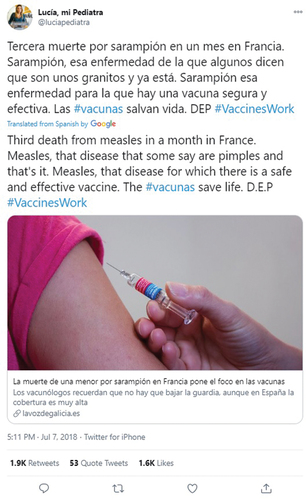
A second unusual peak in the number of m-mmrTs appeared during the months of July and August of 2018. The countries where a higher number of tweets were posted were Argentina, Spain and Venezuela. displays the most repeated m-mmrT during that period (it was repeated 1,870 times). The m-mmrT was posted by @luciapediatra, whose geoinformation pointed to Alicante, Valencia, Spain. The user had 61,518 followers and a total of 26,348 published tweets. All the shown information refers to the time when the analysis was performed, which can differ from the information at the present time.
Figure 14. Most repeated OT_m-mmrT during the unusual event of July-August 2018. All the information shown here refers to the time when the screenshot was taken, which can differ from the information at the present time and at the time the analysis was performed. Includes automatic translation to English from Twitter.
Discussion
In the current section, we first discuss the results obtained regarding Influenza; afterward, we analyze the results coming from Measles and MMR set; and finally, we compare both.
A total of 184,139 inflTs have been analyzed: 44.1% were OTs and 55.1% were RTs. 88,670 inflTs had a sentiment annotation: 6.08% were negTs and 93.92% were non-negTs. There were 109,528 geoTs. In all the studied years (2015, 2016, 2017 and 2018), the number of inflTs incremented during certain periods of months: April-March-May and Oct-Nov-Dec. That trend varied when considering North hemisphere inflTs and South hemisphere inflTs separately, revealing seasonal patterns corresponding to Influenza vaccination campaigns. While users in the North hemisphere tended to post more inflTs during the months of October-November-December, users in the South hemisphere published a higher number of inflTs in April-May-June. Users in the Tropic or not geo-tagged showed a combination of both behaviors. The percentage of negTs was higher in the case of RTs, RPLTs and QTs than for the average negative-sentiment rate, leading to think that users’ interactions related to Influenza tended to be slightly more negative than original content posts.
Referring to Measles and MMR, a total of 263,920 m-mmrTs were obtained: 21.58% were OTs and 78.42% were RTs. There was a higher number of tweets mentioning the word “sarampion” (meaning Measles) than mentioning the term “triple virica” (meaning MMR). There were 70,044 m-mmrTs sentiment classified (with a 4.28% of negTs and a 95.72% of non-negTs) and 145,460 geoTs. For m-mmrTs, OTs presented a higher rate of negTs (4.25%) than the average, while RTs and QTs exhibited a lower percentage (1.81% and 1.84%), meaning directly posted contents in the case of m-mmrTs were more negative than interaction posts. There was not a trend in the number of published m-mmrTs over time, even though there were two significantly atypical periods in 2018 with increasements in the number of posts: March-April and July-August. They both showed similar patterns consisting of few original tweets broadly repeated.
When comparing both, there are several points that need to be mentioned. For both inflTs and m-mmrTs, the highest numbers of posts were reached in 2018. Higher rates of negTs were obtained in the case of inflTs (6.08%) than m-mmrTs (4.27%). Both inflTs and m-mmrTs were mostly published in Argentina and Spain.
When comparing both, there are several points that need to be mentioned. Both inflTs and m-mmrTs were mostly published in Argentina and Spain, and for the two of them, the highest numbers of posts were reached in 2018. Larger rates of negTs were obtained in the case of inflTs (6.08%) than for m-mmrTs (4.27%), and the distribution of that rate did not relevantly vary over time. Nevertheless, it did vary in both cases for the different typologies of Ts, but in distinct ways for the two diseases related tweets. Whilst inflTs showed higher rates of negTs for RTs and QTs, m-mmrTs presented a larger proportion of negTs in OTs. Such a fact implies differences in the way that users directly posted content or interacted between each other regarding the Influenza or the Measles and MMR scope. In the case of Influenza, users were inclined to interact in a more negative-sentiment manner, while for Measles and MMR, that negative opinion was seen to a greater extent in directly written posts. For both inflTs and m-mmrTs, the general OTs/RTs rate distribution similarly varied over time: in January 2015 the rate was close to 50% and descended down to lower than 20% in December 2020. With the years, the number of RTs related to the two diseases increased over the OTs.
The study has shown the incredible potential of the analysis of social media such as Twitter to understand the opinion of the general population or to identify possible patterns in the publication of messages that can be consequence of different events. The understanding of population doubts and opinions on certain public health measures, such as vaccination is of great interest to public health officials in order to maximize these measures and address potential concerns of the population.
Limitations
There are some limitations that need to be identified. On one hand, a proper analysis of the possible mass-publication events and the reasons behind them are difficult to handle. With an enormous number of tweets published every day, even the filtering of the information in an appropriate way requires a detailed and comprehensive analysis by experts in the field to understand what it is happening. On the other hand, the lack of specific information such as the geographical location of some tweets can reduce the potential value of the extracted information, not being in most of the tweets to locate where the user is tweeting and for hence how the comments are affecting specific populations worldwide. In the context of sentiment analysis, it is important to emphasize that the identification of the sentiments in the tweets is a hard task due to the very different types of writing styles and expressions used. Also, the limitation to a specific number of characters makes difficult for automatic systems to contextualize the content properly, being this an important limitation.
Conclusions
The current study presented two cases of vaccine-related diseases that confirmed a problem. Analyzing Influenza, and Measles and MMR related tweets has proven that there is an inherited dilemma on the population when it comes to the topic of vaccines and vaccination. Such a matter is derived from sociocultural and political insights and it is of utmost importance to correctly identify and address certain situations that can be monitored in social media. All the pointed unusual events confirmed this fact and had to be individually studied in isolation since they were mostly related to completely different issues. In both related disease tweets, the antivaccine debate was one of the emphasized disjunctives. As observed and stated in the literature, antivaccine groups have gained a special relevance in the media. Now more than ever, it is essential to generate general awareness on the population of the importance of herd immunity, and how we must protect not only the susceptible people but also those that cannot be vaccinated.
Disclosure of potential conflicts of interest
AJ and MC are employees of MSD Spain.
Contributorship
DFP was the main developer of the procedures to extract the knowledge from Twitter. JMT and LPS performed the main analysis of the system with the support and guide in the methodology from AJ, MC, ACF, AA, EM, ARG and AG. LPM and ARG wrote the manuscript with the supervision and revision of all the co-authors. ARG supervised the whole study and the whole analysis. All authors were involved in the development of this manuscript and gave final approval before submission.
Acknowledgments
We would like to thank to the experts that contribute helping in the manual annotation of the tweets for the generation of the machine learning model.
Additional information
Funding
References
- Diaz JA, Griffith RA, Ng JJ, Reinert SE, Friedmann PD, Moulton AW. Patients’ use of the internet for medical information. J Gen Intern Med. 2002;17:180–85. doi:10.1046/j.1525-1497.2002.10603.x.
- Eysenbach G. Infodemiology and infoveillance: framework for an emerging set of public health informatics methods to analyze search, communication and publication behavior on the internet. J Med Internet Res. 2009;11:e11. doi:10.2196/jmir.1157.
- M’ikanatha NM, Rohn DD, Robertson C, Tan CG, Holmes JH, Kunselman AR, Polachek C, Lautenbach E. Use of the internet to enhance infectious disease surveillance and outbreak investigation. Biosecur Bioterror. 2006;4:293–300. doi:10.1089/bsp.2006.4.293.
- Ginsberg J, Mohebbi MH, Patel RS, Brammer L, Smolinski MS, Brilliant L. Detecting influenza epidemics using search engine query data. Nature. 2009;457:1012–14. doi:10.1038/nature07634.
- Wilson K, Brownstein JS. Early detection of disease outbreaks using the internet. CMAJ Can Med Assoc J. 2009;180:829–31. doi:10.1503/cmaj.1090215.
- Dugas AF, Hsieh Y-H, Levin SR, Pines JM, Mareiniss DP, Mohareb A, Gaydos CA, Perl TM, Rothman RE. Google flu trends: correlation with emergency department influenza rates and crowding metrics. Clin Infect Dis. 2012;54:463–69. doi:10.1093/cid/cir883.
- Collier N. Uncovering text mining: a survey of current work on web-based epidemic intelligence. Glob Public Health. 2012;7:731–49. doi:10.1080/17441692.2012.699975.
- Kang M, Zhong H, He J, Rutherford S, Yang F. Using google trends for influenza surveillance in South China. Plos One. 2013;8:e55205. doi:10.1371/journal.pone.0055205.
- Kaplan AM, Haenlein M. Users of the world, unite! The challenges and opportunities of social media. Bus Horiz. 2010;53:59–68. doi:10.1016/j.bushor.2009.09.003.
- DataReportal – global digital insights [Internet]. [ accessed 2020 June 10]. https://datareportal.com.
- Eysenbach G, Powell J, Englesakis M, Rizo C, Stern A. Health related virtual communities and electronic support groups: systematic review of the effects of online peer to peer interactions. BMJ. 2004;328:1166. doi:10.1136/bmj.328.7449.1166.
- Culotta A. Towards detecting influenza epidemics by analyzing twitter messages [Internet]. Proceedings of the First Workshop on Social Media Analytics; New York (NY): Association for Computing Machinery; 2010. p. 115–22. doi:10.1145/1964858.1964874.
- Chew C, Eysenbach G. Pandemics in the age of twitter: content analysis of tweets during the 2009 H1N1 outbreak. Plos One. 2010;5:e14118. doi:10.1371/journal.pone.0014118.
- Chunara R, Andrews JR, Brownstein JS. Social and news media enable estimation of epidemiological patterns early in the 2010 haitian cholera outbreak. Am J Trop Med Hyg. 2012;86:39–45. doi:10.4269/ajtmh.2012.11-0597.
- Jashinsky J, Burton SH, Hanson CL, West J, Giraud-Carrier C, Barnes MD, Argyle T. Tracking suicide risk factors through Twitter in the US. Crisis. 2014;35:51–59. doi:10.1027/0227-5910/a000234.
- Hswen Y, Naslund JA, Brownstein JS, Hawkins JB. Monitoring online discussions about suicide among twitter users with schizophrenia: exploratory study. JMIR Ment Health. 2018;5:e11483. doi:10.2196/11483.
- Freifeld CC, Brownstein JS, Menone CM, Bao W, Filice R, Kass-Hout T, Dasgupta N. Digital drug safety surveillance: monitoring pharmaceutical products in twitter. Drug Saf. 2014;37:343–50. doi:10.1007/s40264-014-0155-x.
- Curtis JR, Chen L, Higginbotham P, Nowell WB, Gal-Levy R, Willig J, Safford M, Coe J, O’Hara K, Sa’adon R. Social media for arthritis-related comparative effectiveness and safety research and the impact of direct-to-consumer advertising. Arthritis Res Ther. 2017;19:48. doi:10.1186/s13075-017-1251-y.
- Chou W-YS, Oh A, Klein WMP. Addressing health-related misinformation on social media. JAMA. 2018;320:2417–18. doi:10.1001/jama.2018.16865.
- Hoffman BL, Felter EM, Chu K-H, Shensa A, Hermann C, Wolynn T, Williams D, Primack BA. It’s not all about autism: the emerging landscape of anti-vaccination sentiment on Facebook. Vaccine. 2019;37:2216–23. doi:10.1016/j.vaccine.2019.03.003.
- Kata A. Anti-vaccine activists, Web 2.0, and the postmodern paradigm – an overview of tactics and tropes used online by the anti-vaccination movement. Vaccine. 2012;30:3778–89. doi:10.1016/j.vaccine.2011.11.112.
- Smith N, Graham T. Mapping the anti-vaccination movement on Facebook. Inf Commun Soc. 2019;22:1310–27. doi:10.1080/1369118X.2017.1418406.
- Larson HJ, Wilson R, Hanley S, Parys A, Paterson P. Tracking the global spread of vaccine sentiments: the global response to Japan’s suspension of its HPV vaccine recommendation. Hum Vaccines Immunother. 2014;10:2543–50. doi:10.4161/21645515.2014.969618.
- Larson HJ. The biggest pandemic risk? Viral misinformation. Nature. 2018;562:309–309. doi:10.1038/d41586-018-07034-4.
- Omer SB, Salmon DA, Orenstein WA, deHart MP, Halsey N. Vaccine refusal, mandatory immunization, and the risks of vaccine-preventable diseases. N Engl J Med. 2009;360:1981–88. doi:10.1056/NEJMsa0806477.
- Dredze M, Broniatowski DA, Smith MC, Hilyard KM. Understanding vaccine refusal: why we need social media now. Am J Prev Med. 2016;50:550–52. doi:10.1016/j.amepre.2015.10.002.
- Aramaki E, Maskawa S, Morita M. Twitter catches the flu: detecting influenza epidemics using Twitter. Proceedings of the Conference on Empirical Methods in Natural Language Processing; Edinburgh, United Kingdom: Association for Computational Linguistics; 2011. p. 1568–76.
- Signorini A, Segre AM, Polgreen PM. The use of twitter to track levels of disease activity and public concern in the U.S. during the influenza A H1N1 pandemic. Plos One. 2011;6:e19467. doi:10.1371/journal.pone.0019467.
- Wakamiya S, Kawai Y, Aramaki E. Twitter-based influenza detection after flu peak via tweets with indirect information: text mining study. JMIR Public Health Surveill. 2018;4:e65. doi:10.2196/publichealth.8627.
- Du J, Xu J, Song H-Y, Tao C. Leveraging machine learning-based approaches to assess human papillomavirus vaccination sentiment trends with Twitter data. BMC Med Inform Decis Mak. 2017;17:69. doi:10.1186/s12911-017-0469-6.
- Shapiro GK, Surian D, Dunn AG, Perry R, Kelaher M. Comparing human papillomavirus vaccine concerns on Twitter: a cross-sectional study of users in Australia, Canada and the UK. BMJ Open. 2017;7:e016869. doi:10.1136/bmjopen-2017-016869.
- Amith M, Cohen T, Cunningham R, Savas LS, Smith N, Cuccaro P, Gabay E, Boom J, Schvaneveldt R, Tao C. Mining HPV vaccine knowledge structures of young adults from reddit using distributional semantics and pathfinder networks. Cancer Control. 2020;27:1073274819891442.
- Du J, Xu J, Song H, Liu X, Tao C. Optimization on machine learning based approaches for sentiment analysis on HPV vaccines related tweets. J Biomed Semant. 2017;8:9. doi:10.1186/s13326-017-0120-6.
- Dunn AG, Surian D, Leask J, Dey A, Mandl KD, Coiera E. Mapping information exposure on social media to explain differences in HPV vaccine coverage in the United States. Vaccine. 2017;35:3033–40. doi:10.1016/j.vaccine.2017.04.060.
- Suppli CH, Hansen ND, Rasmussen M, Valentiner-Branth P, Krause TG, Mølbak K. Decline in HPV-vaccination uptake in Denmark - the association between HPV-related media coverage and HPV-vaccination. BMC Public Health. 2018;18:1360. doi:10.1186/s12889-018-6268-x.
- Zhou X, Coiera E, Tsafnat G, Arachi D, Ong M-S, Dunn AG. Using social connection information to improve opinion mining: identifying negative sentiment about HPV vaccines on Twitter. Stud Health Technol Inform. 2015;216:761–65.
- Buller DB, Walkosz BJ, Berteletti J, Pagoto SL, Bibeau J, Baker K, Hillhouse J, Henry KL. Insights on HPV vaccination in the United States from mothers’ comments on Facebook posts in a randomized trial. Hum Vaccines Immunother. 2019;15:1479–87. doi:10.1080/21645515.2019.1581555.
- Pereira da Veiga CR, Semprebon E, da Silva JL, Lins Ferreira V, Pereira da Veiga C. Facebook HPV vaccine campaign: insights from Brazil. Hum Vaccines Immunother. 2020;16:1824–34. doi:10.1080/21645515.2019.1698244.
- Orr D, Baram-Tsabari A, Landsman K. Social media as a platform for health-related public debates and discussions: the Polio vaccine on Facebook. Isr J Health Policy Res. 2016;5:34. doi:10.1186/s13584-016-0093-4.
- Radzikowski J, Stefanidis A, Jacobsen KH, Croitoru A, Crooks A, Delamater PL. The measles vaccination narrative in twitter: a quantitative analysis. JMIR Public Health Surveill. 2016;2:e1. doi:10.2196/publichealth.5059.
- Deiner MS, Fathy C, Kim J, Niemeyer K, Ramirez D, Ackley SF, Liu F, Lietman TM, Porco TC. Facebook and Twitter vaccine sentiment in response to measles outbreaks. Health Informatics J. 2019;25:1116–32. doi:10.1177/1460458217740723.
- Nicholson MS, Leask J. Lessons from an online debate about measles-mumps-rubella (MMR) immunization. Vaccine. 2012;30:3806–12. doi:10.1016/j.vaccine.2011.10.072.
- Rodríguez González A, Tuñas JM, Fernandez Peces-Barba D, Menasalvas Ruiz E, Jaramillo A, Cotarelo M, Conejo A, Arce A, Gil A. Creating a metamodel based on machine learning to identify the sentiment of vaccine and disease-related messages in Twitter: the MAVIS study. 2020 IEEE 33rd International Symposium on Computer-Based Medical Systems (CBMS), MN, USA; 2020. p. 245–50. doi:10.1109/CBMS49503.2020.00053
- Jianqiang Z, Xiaolin G. Comparison research on text pre-processing methods on Twitter sentiment analysis. IEEE Access. 2017;5:2870–79. doi:10.1109/ACCESS.2017.2672677.
- Rodríguez González A, Tuñas JM, Prieto Santamaría L, Fernández Peces-Barba D, Menasalvas Ruiz E, Jaramillo A, Cotarelo M, Conejo Fernández AJ, Arce A, Gil A. MAVIS Twitter dataset: a collection of tweets and sentiment analysis in Spanish about vaccines and diseases during the period 2015–2018 [Internet]. 2020 [accessed 2020 Dec 17]. doi:10.5281/zenodo.4335594.
- Hussein -DME-DM. A survey on sentiment analysis challenges. J King Saud Univ - Eng Sci. 2018;30:330–38.
- Giachanou A, Crestani F. Like it or not: a survey of Twitter sentiment analysis methods. ACM Comput Surv. 2016;49:28:1–28:41. doi:10.1145/2938640.
- Taboada M, Brooke J, Tofiloski M, Voll K, Stede M. Lexicon-based methods for sentiment analysis. Comput Linguist. 2011;37:267–307. doi:10.1162/COLI_a_00049.
- Kontopoulos E, Berberidis C, Dergiades T, Bassiliades N. Ontology-based sentiment analysis of twitter posts. Expert Syst Appl. 2013;40:4065–74. doi:10.1016/j.eswa.2013.01.001.
- Zhang L, Wang S, Liu B. Deep learning for sentiment analysis: a survey. WIREs Data Min Knowl Discov. 2018;8:e1253.
- Rodríguez González A, Tuñas JM, Prieto Santamaría L, Fernández Peces-Barba D, Menasalvas Ruiz E, Jaramillo A, Cotarelo M, Conejo Fernández AJ, Arce A, Gil A. Identifying polarity in tweets from an imbalanced dataset about diseases and vaccines using a meta-model based on machine learning techniques. Appl Sci. 2020;10:9019. doi:10.3390/app10249019.