
 ?Mathematical formulae have been encoded as MathML and are displayed in this HTML version using MathJax in order to improve their display. Uncheck the box to turn MathJax off. This feature requires Javascript. Click on a formula to zoom.
ABSTRACT
Varicella, which is caused by the varicella zoster virus (VZV), is a common infectious disease affecting children. Varicella vaccines have been used for decades; however, vaccination policies vary across countries because of differences in VZV epidemiology. The basic reproductive number a transmissibility measure parameter, also differs from country to country. In this study
for varicella was estimated in South Korea using the contact rate matrix derived from averaged POLYMOD contact data, the Korean population, and proportionality factor fitted to the Korean VZV seroprevalence
for varicella in South Korea was estimated to be 5.67 (95% CI: 5.33, 6.33). Therefore, to reach the herd immunity threshold, the critical vaccine coverage should be greater than 82.4% with a perfect vaccine, or the primary vaccine failure proportion should be less than 17.6% with 100% coverage. Because of the relatively low seroconversion rate and rapidly waning immunity after one-dose vaccination in South Korea, the herd immunity threshold is difficult to attain with only a one-dose vaccine. Two doses of vaccination may be necessary to effectively interrupt varicella transmission and maintain herd immunity in South Korea. The study results can help guide the decision-making on an effective varicella vaccination policy in South Korea.
Introduction
Varicella, caused by the varicella zoster virus (VZV), is a common infectious disease affecting children. VZV becomes latent in dorsal root ganglia and is reactivated later in life, resulting in herpes zoster in adults. Although varicella is a mild illness in children, the disease burden is significant and can be more severe in adolescents and adults, pregnant women, and immunocompromised individuals. A live attenuated varicella vaccine has long been used, and varicella vaccination has been found to effectively reduce the disease burden and severity.Citation1 A universal varicella vaccination policy has been implemented in many countries with one- or two-dose schedule, depending on the vaccination goal and allocation priority.
In South Korea, universal one-dose varicella vaccination for children aged 12–15 months has been implemented since 2005, and the coverage attained is 97% in children. Following universal vaccination, varicella incidence declined by 67% over a 10-year period.Citation2 However, the impact of one-dose varicella vaccination was relatively moderate compared to that in Taiwan (82.2% reduction), where the vaccination policy and coverage were similar.Citation3 These differences may be due to the different background varicella incidence and population immunity levels before introducing the universal vaccination program. Because VZV transmissibility can be affected by multiple factors, such as contact patterns, social behavior and structure, and environmental factors,Citation4 varicella epidemiology may vary across countries. There was a substantial variation in VZV transmissibility in European countries as the seroprevalence differed from country to country, and the basic reproductive number () ranged between 3.8 and 16.95.Citation5 This implies that the vaccine coverage required to reach the herd immunity threshold can differ across countries; therefore, vaccination programs should be determined accordingly.
It is essential to understand the baseline varicella epidemiology in South Korea to evaluate the appropriateness of a vaccination program and develop an effective vaccination strategy that interrupts VZV transmission in children. Among epidemiologic parameters, is particularly important in guiding vaccination policy decision-making because it enables the estimation of the herd immunity threshold in a simple manner and promotes an understanding of the efforts required to reach such threshold.Citation6 Therefore, our goal is to estimate
and calculate the herd immunity threshold and critical varicella vaccination coverage in South Korea using the Korean VZV seroprevalence and empirical contact data.
Methods
To estimate , we used VZV seroprevalence and empirical social contact data, we used previously published Korean VZV seroprevalence data.Citation1,Citation2 These previous studies utilized 1,302 and 887 serum samples, each collected between April 2008 and March 2010 from subjects aged 0–79 years, and anti-VZV IgG antibodies were measured using a commercial enzyme-linked immunosorbent assay (ELISA) kit (Enzygnost®; Dade Behring, Schwalbach, Germany) with the same cutoff values. However, serum samples were collected after the varicella vaccination was included in the National Immunization Program (NIP) in 2005; thus, the seropositivity among children under 4 years of age could have been overestimated because vaccine-induced seroconversion was difficult to delineate. For sensitivity analysis, we chose the pre-vaccine Japanese seroprevalence data in 1984 because the school terms and climatic conditions were similar in both countries.Citation7 The population data and age-specific mortality for the year 2008 were employed, which corresponds to the year when samples were collected.Citation8,Citation9 In this study, we estimated the seroprevalence from six months of age because maternal immunity is retained in infants up to this age.
In terms of contact data, we used the social contact data collected as part of POLYMOD project in European countries because empirical contact data from South Korea are not available, we used the social contact data collected as part of the POLYMOD project in European countries.Citation10 The POLYMOD contact survey was cross-sectionally conducted in eight European countries during 2005 and 2006, and the characteristics of approximately 100,000 contacts with different individuals were collected during one day; these characteristics included age, location, duration, frequency, and occurrence of physical contact. The contact patterns of European countries may not representative of South Korea. However, there are similarities in the age-dependent contact patterns and intensity across countries notwithstanding some differences in level.Citation10,Citation11 This implies the overall POLYMOD data can provide age contact patterns in general. Thus, instead of using data from any given country, we used the overall POLYMOD data to construct the age-specific transmission rate (matrices, which are often referred to as Who-Acquired-Infection-From-Whom (WAIFW) matrices.Citation10 Each WAIFW matrix element,
, represents the transmissibility between
-th and
-th age groups.
The contact rate matrices were constructed to account for the positive relationship between transmission probability and contact intensity, which entails frequency, duration, and contact type. The contact number in the POLYMOD data was calibrated by imposing weights using contact duration, which was originally grouped into 5 categories, that is, < 5 min, 5–15 min, 15 min–1 h, 1–4 h, and >4 h. A midpoint value of 5 min, 10 min, 37.5 min, 2.5 h, and 4 h, respectively, was used for each category of duration weighting (i.e., base case). Subsequently, we constructed the contact rate matrices by contact type, that is, physical and nonphysical, and estimated a proportionality factor for each one.
The population was divided into subgroups in one-year age intervals. The expected total number of contacts from -th age group to
-th age group per day was expressed as
, where
is the average number of observed contacts from an individual in
-th age group with individuals in
-th group per day, and
is the
-th group population size in South Korea. The contact rate,
, from an individual in the
-th age group with one in
-th age group is defined as
.
Because contacts are mutual, the contact rate matrix should be symmetric. However, in general, the results of contact survey do not satisfy this property due to sampling and survey errors. A common approach to handle this discrepancy is to obtain the symmetric contact rate matrix by applying surface smoothing and reciprocity constraint enforcing processes.Citation12–16 In this study, bivariate smoothing was performed by assuming a negative binomial model on the average number of contacts for both responders and contacts. Moreover, contact rate matrix symmetricity was enforced by imposing a reciprocity constraint of contact rates an at the population level, that is
. The contact matrix conversion was performed using bam function, a generalized additive modeling function for a large dataset, from the mgcv package in R.Citation17,Citation18 Through this procedure, symmetric contact rate matrices for physical, nonphysical, and all reported contacts were generated. For more details, see the Supplementary Information Text S1.
The WAIFW matrix was expressed as the product of the contact rate matrix and a proportionality factor (), assuming the transmission rates were proportional to contact rates. The proportionality factor was estimated by fitting to the Korean serological data and population using the maximum likelihood estimation with a compartmental MSIR model in a closed population with a 6-month duration of maternal protection is considered.Citation13 This factor was assumed to be constant, independent of age. The proportionality factors for physical (
) and nonphysical contacts (
) were estimated. For more details, see the Supplementary Information Text S2.
We calculated as the dominant eigenvalue of a next-generation matrix consisting of the following elements:
where is the population of Korea,
is the infectious period of varicella,
is the average life expectancy in South Korea,
is the average death rate of
-th age, and
is the per capita transmission rate between an individual in age group
and an individual in age group
, per year. We estimated the 95% confidence intervals (CIs) of
by applying a bootstrap technique to the POLYMOD contact survey and serological data 1000 times.Citation12 The critical vaccination coverage, which is defined as the level of vaccine coverage to achieve the herd immunity considering the vaccine failure and formulated as
,Citation6 was obtained according to different proportions of primary vaccine failure (
) ranging from 8% to 20%.Citation19 Primary vaccine failure is defined as the failure to seroconvert after vaccination.Citation20
We performed sensitivity analyses by comparing the estimated obtained using different data and methods: social contact data, seroprevalence, and approaches to estimate the WAIFW matrices. To assess the impact of different contact patterns on the estimated
, we used the contact data from Great Britain (hereon referred to as GB) and Belgium. Japanese VZV seroprevalence data during the pre-vaccine era were compared with the Korean seroprevalence data during the post-vaccine era. Different approaches to estimate WAIFW matrices from the base case were employed for sensitivity analysis: Case 1, comprising the contact rate matrix of all reported contacts without being classified by contact type, and Case 2, composed of the average number of contacts without weighted duration.
Results
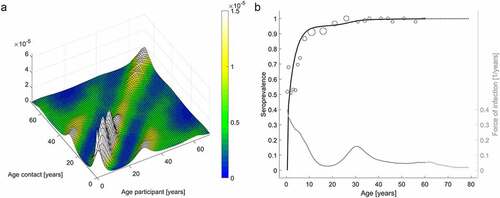
The WAIFW matrix results showed age-assortative patterns and high transmission rates among children, as well as relatively high transmission rates between children and adults in their 30s (). These results reflect high assortative mixing among children and frequent contacts between children and their parents. Furthermore, age-specific force of infection was the highest in children under 10 years of age and slightly increased at 30 years of age.
Figure 1. Who-Acquired-Infection-From-Whom matrices (a) and age-specific VZV seroprevalence data with model prediction and corresponding age-specific force of infection (b)
The estimated was found to be 5.67 (95% CI: 5.33, 6.33), and the threshold for herd immunity was 82.4% (95% CI: 81.2%, 84.2%). This suggests that herd immunity can be achieved if vaccine coverage is maintained at 82.4% with a perfect vaccine. However, the critical vaccination coverage increases with the increase in the primary vaccine failure (). For example, the primary vaccine failure needs to be less than 17.6% (95% CI: 15.8%, 18.8%) to achieve herd immunity with 100% vaccine coverage. Considering the current varicella vaccine coverage in South Korea (97%), the primary vaccine failure should be less than 15.1% (95% CI: 13.2%, 16.2%).
Figure 2. Changes in critical vaccine coverage according to changes in varicella primary vaccine failure for the estimated basic reproductive number () of the base case (a) and those of all sensitivity analyses (b)
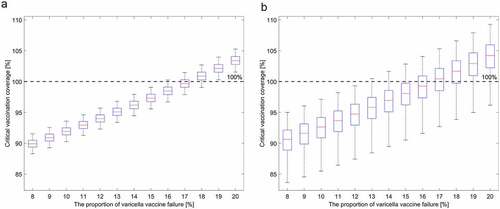
Footnote: The red lines are the critical vaccination coverage values for the estimated of the base case (a) and the median
value from the sensitivity analyses (b). The whiskers in ) represent the critical vaccination coverage corresponding to the upper and lower limit of 95% confidence intervals of
of the base case, while the whiskers in ) represent the minimum and maximum values of the critical vaccination coverage corresponding to the range of all bootstrapped estimated
values.
Sensitivity analyses were performed, and the results are summarized in . The WAIFW matrices using different contact data show patterns similar to those for the base case (See Figure S1). However, transmission rates among children and between children and parents were higher in the WAIFW matrix using the Belgium contact data and lower in the one using the GB contact data when compared to the base case. The estimated was higher using the Belgium contact data and lower using the GB contact data. Nonetheless, estimated
values were not significantly different from the base case values. However, the estimated
value fitted to the Japanese seroprevalence data was considerably lower than the base case value. In contrast, employing different contact approaches yielded higher
values.
Table 1. Estimated proportionality factor () and basic reproductive number (
) for varicella with the 95% confidence interval as a result of the sensitivity analysis. The proportionality factor for physical contact matrix is represented as
, and the one for nonphysical contact matrix is done as
. Cases were varied by data and methods: contact survey data, varicella seroprevalence, and approaches to generate the WAIFW matrices
Footnote. Base case: average POLYMOD contact data, Korean seroprevalence, and the WAIFW matrix weighted with contact duration and stratified according to contact proximity. Case 1: the contact rate matrix was weighted with contact duration but was not classified according to contact proximity. (†: The proportional parameter in Case 1 is represented as
.) Case 2: the contact rate matrix was not weighted with contact duration but was classified according to contact proximity.
Considering all results, the critical vaccine coverage ranged from 79.7% to 84.9% with a perfect vaccine, and the maximum allowed proportion of primary vaccine failure to reach the herd immunity threshold with 100% vaccine coverage ranged from 15% to 20% (). Considering the entire 95% CI range of bootstrapped in the sensitivity analyses from , the proportion of primary vaccine failure should be less than 13.7% to reach the herd immunity threshold (). For more detailed estimated WAIFW results in the sensitivity analyses, see Supplementary Information Figures S1–S2.
Discussion
In general terms, differs depending on disease and region due to different contact patterns and other social and climate effects.Citation21,Citation22 In the case of varicella,
ranged widely from 3 to 17 across various European countries.Citation5,Citation12,Citation23–26
Although for varicella has been studied extensively in European countries, it has been rarely investigated in Asian-Pacific countries so far. Recently, estimated
for varicella was reported to be 6.73 in Shenzhen, China. However, the pre-vaccine varicella seroprevalence varies greatly across Asian counties,Citation27 which suggests that the baseline disease burden and resulting
would also vary across countries. Therefore, it is important to estimate
for varicella in each country to help develop appropriate policies for varicella vaccination. To the best of our knowledge, here we present the first estimation of
for varicella in South Korea. Our results using the Korean serological data yielded
values of 5.5 − 6.6, which implies an 82% to 85% herd immunity threshold with a perfect vaccine. However, varicella vaccines are known to be imperfect, and when the primary vaccine failure exceeded 17.6% the herd immunity threshold could not be attained, even with 100% vaccine coverage in South Korea.
The primary vaccine failure of varicella vaccines ranged from 0%−24%. Previous studies based on the fluorescent antibody to membrane antigen assay, which is the only assay validated to correlate with protection, reported the failure to be as high as 24%.Citation28 In South Korea, several domestic or imported varicella vaccines were used. Among them, an MAV strain vaccine, SuduVax (Green Cross, Yongin, Korea) has been most commonly used, followed by an Oka strain vaccine, Vari-L (Changchun Institute of Biological Products, Changchun, China).Citation29–31 The seroconversion rate following one-dose vaccination with either of them was reported to be 65%, 76.7%, and 83.6% in three different studies,Citation29–31 and the corresponding critical vaccine coverage was 127%, 108%, and 99.4%, respectively, which suggests that herd immunity is almost impossible to achieve with one-dose vaccination. Even with the lowest estimated from the sensitivity analyses results, herd immunity is marginally achievable only with the highest effective vaccine (95.5% critical vaccine coverage with an 83.6% effective vaccine). Moreover, as vaccine-induced immunity wanes rapidly after one-dose vaccination,Citation29,Citation32 the critical vaccine coverage should be greater than the calculated one.Citation33 Two-dose varicella vaccination increased the geometric mean concentrations approximately 10-fold, and the pooled two-dose vaccine effectiveness was 92% (95% CI: 88%, 95%) against all varicella in a meta-analysis study.Citation1,Citation20 With two-dose vaccination, the herd immunity threshold can be an achievable goal.
Consistent with our finding, the number of notified varicella cases remained high (82,868 cases in 2019) in South Korea, although the varicella incidence considerably decreased following one-dose universal vaccination since 2005.Citation2,Citation34 Therefore, introducing two-dose vaccination could interrupt varicella transmission more effectively.
We used all contact data weighted with contact duration, instead of choosing long-duration contacts or stratifying the data according to contact duration or location,Citation35 and then stratified those contacts according to proximity (physical and nonphysical). Varicella can be transmitted through air, droplets, and contact, so we considered that the transmission risk would be higher with longer contact duration and more intimate contact. By using this method, we incorporated both contact duration and contact types in generating the contact rate matrices, which can represent the transmission risk of varicella.
Despite its many advantages, this study has several limitations. First, the contact data used in this study was not from South Korea. The estimated may depend on the contact matrices employed, and the contact patterns of European countries may not be representative of South Korea as we noted earlier. However, the age contact patterns of the overall POLYMOD data may reflect general contact patterns among age groups. Nonetheless, Korean contact survey data are required to be able to provide a better
estimation. Second, the transmission risk among children under 4 years of age may have been overestimated because the VZV seroprevalence data were collected 3 years after universal one-dose varicella vaccination for 12–15 month-old children. The sensitivity analysis using the pre-vaccine seroprevalence data from Japan showed a lower
. However, the implications of
on critical vaccine coverage was not substantially different.
In summary, the for varicella was estimated to be 5.76 in South Korea; to reach the herd immunity threshold, the critical vaccine coverage should be greater than 82.4% with a perfect vaccine, and the proportion of primary vaccine failure should be less than 17.6% with 100% coverage. Primary vaccine failure of one-dose varicella vaccine was relatively high, and the vaccine-induced immunity wanes rapidly; thus, it may be difficult to attain the herd immunity threshold with only a one-dose vaccine. Two-dose schedule may be needed to effectively interrupt varicella transmission and maintain herd immunity in South Korea. Our study results can help guide the decision-making on effective varicella vaccination policies in South Korea.
Disclosure of potential conflicts of interest
None of the authors have any conflicts of interest to declare.
Supplemental Material
Download MS Word (1.8 MB)Acknowledgments
We would like to thank Won Suk Choi for providing the seroprevalence data.
Supplementary material
Supplemental data for this article can be accessed on the publisher’s website.
Additional information
Funding
References
- Marin M, Marti M, Kambhampati A, Jeram SM, Seward JF. Global varicella vaccine effectiveness: a meta-analysis. Pediatrics 2016;137(3):e20153741. doi:10.1542/peds.2015-3741.
- Choi JK, Park SH, Park S, Choi SM, Kim SH, Lee DG, Yoo JH, Choi JH, Kang JH. Trends in varicella and herpes zoster epidemiology before and after the implementation of universal one-dose varicella vaccination over one decade in South Korea, 2003-2015. Hum Vaccin Immunother. 2019:1–7. doi:10.1080/21645515.2019.1603985.
- Cheng HY, Chang LY, Lu CY, Huang LM. Epidemiology of breakthrough varicella after the implementation of a universal varicella vaccination program in Taiwan, 2004-2014. Sci Rep. 2018;8(1):17192. doi:10.1038/s41598-018-35451-y.
- Delamater PL, Street EJ, Leslie TF, Yang YT, Jacobsen KH. Complexity of the basic reproduction number (R0). Emerg Infect Dis. 2019;25(1):1–4. doi:10.3201/eid2501.171901.
- Nardone A, De Ory F, Carton M, Cohen D, Van Damme P, Davidkin I, Rota MC, De Melker H, Mossong J, Slacikova M, et al. The comparative sero-epidemiology of varicella zoster virus in 11 countries in the European region. Vaccine. 2007;25(45):7866–72. doi:10.1016/j.vaccine.2007.07.036.
- Fine P, Eames K, Heymann DL. “Herd immunity”: a rough guide. Clin Infect Dis. 2011;52(7):911–16. doi:10.1093/cid/cir007.
- Taylor-Wiedeman J, Yamashita K, Miyamura K, Yamazaki S. Varicella-zoster virus prevalence in Japan: no significant change in a decade. Jpn J Med Sci Biol. 1989;42(1):1–11. doi:10.7883/yoken1952.42.1.
- KOSIS. Population projections for Korea, Statistics Korea. KOSIS(KOrean Statistical Information Service); 2019. accessed 2020 April 28. https://kosis.kr/statHtml/statHtml.do?orgId=101&tblId=DT_1BPA001&conn_path=I2&language=en
- KOSIS. Vital statistics, statistics Korea. KOSIS(Korean statistical information service); 2020. KOSIS. [accessed 2020 April 28]. https://kosis.kr/statHtml/statHtml.do?orgId=101&tblId=DT_1B80A11&conn_path=I2&language=en
- Mossong J, Hens N, Jit M, Beutels P, Auranen K, Mikolajczyk R, Massari M, Salmaso S, Tomba GS, Wallinga J, et al. Social contacts and mixing patterns relevant to the spread of infectious diseases. PLoS Med. 2008;5(3):e74. doi:10.1371/journal.pmed.0050074.
- Fu YC, Wang DW, Chuang JH. Representative contact diaries for modeling the spread of infectious diseases in Taiwan. PLoS One. 2012;7(10):e45113. doi:10.1371/journal.pone.0045113.
- Goeyvaerts N, Hens N, Ogunjimi B, Aerts M, Shkedy Z, Damme PV, Beutels P. Estimating infectious disease parameters from data on social contacts and serological status. J R Stat Soc Ser C Appl Stat. 2010;59(2):255–77. doi:10.1111/j.1467-9876.2009.00693.x.
- Hens N, Shkedy Z, Aerts M, Faes C, Van Damme P, Beutels P. Modeling infectious disease parameters based on serological and social contact data: a modern statistical perspective. Springer Science & Business Media; 2012.
- Melegaro A, Del Fava E, Poletti P, Merler S, Nyamukapa C, Williams J, Gregson S, Manfredi P. Social contact structures and time use patterns in the Manicaland Province of Zimbabwe. PLoS One. 2017;12(1):e0170459. doi:10.1371/journal.pone.0170459.
- Hens N, Wallinga J. Design and analysis of social contact surveys relevant for the spread of infectious diseases. Wiley StatsRef: Stat Ref Online. 2019. 1–15. [accessed 2020.04.28]. doi: 10.1002/9781118445112.stat07883.
- Mammen E, Marron J, Turlach B, Wand M. A general projection framework for constrained smoothing. Stat Sci. 2001;16(3):232–48. doi:10.1214/ss/1009213727.
- Wood SN. Generalized additive models: an introduction with R. CRC press; 2017.
- R: A language and environment for statistical computing. 2020. R Core Team; https://www.R-project.org/
- Keeling M, Tildesley M, House T, Danon L The mathematics of vaccination. Math Today. 2013;49:40–43.
- Bonanni P, Gershon A, Gershon M, Kulcsar A, Papaevangelou V, Rentier B, Sadzot-Delvaux C, Usonis V, Vesikari T, Weil-Olivier C, et al. Primary versus secondary failure after varicella vaccination: implications for interval between 2 doses. Pediatr Infect Dis J. 2013;32(7):e305–13. doi:10.1097/INF.0b013e31828b7def.
- Diekmann O, Heesterbeek J Mathematical epidemiology of infectious diseases: model building, analysis and interpretation. 2000
- Vynnycky E, White R. An introduction to infectious disease modelling. OUP oxford; 2010.
- Medić S, Katsilieris M, Lozanov-Crvenković Z, Siettos CI, Petrović V, Milošević V, Brkić S, Andrews N, Ubavić M, Anastassopoulou C. Varicella zoster virus transmission dynamics in Vojvodina, Serbia. PLoS One. 2018;13(3):e0193838. doi:10.1371/journal.pone.0193838.
- Whitaker H, Farrington C. Infections with varying contact rates: application to varicella. Biometrics. 2004;60(3):615–23. doi:10.1111/j.0006-341X.2004.00210.x.
- Van Effelterre T, Shkedy Z, Aerts M, Molenberghs G, Van Damme P, Beutels P. Contact patterns and their implied basic reproductive numbers: an illustration for varicella-zoster virus. Epidemiol Infect. 2009;137(1):48–57. doi:10.1017/S0950268808000563.
- Ogunjimi B, Hens N, Goeyvaerts N, Aerts M, Van Damme P, Beutels P. Using empirical social contact data to model person to person infectious disease transmission: an illustration for varicella. Math Biosci. 2009;218(2):80–87. doi:10.1016/j.mbs.2008.12.009.
- Goh AEN, Choi EH, Chokephaibulkit K, Choudhury J, Kuter B, Lee PI, Marshall H, Kim JO, Wolfson LJ. Burden of varicella in the Asia-Pacific region: a systematic literature review. Expert Rev Vaccines. 2019;18(5):475–93. doi:10.1080/14760584.2019.1594781.
- Michalik DE, Steinberg SP, Larussa PS, Edwards KM, Wright PF, Arvin AM, Gans HA, Gershon AA. Primary vaccine failure after 1 dose of varicella vaccine in healthy children. J Infect Dis. 2008;197(7):944–49. doi:10.1086/529043.
- Choi UY, Huh DH, Kim JH, Kang JH. Seropositivity of varicella zoster virus in vaccinated Korean children and MAV vaccine group. Hum Vaccin Immunother. 2016;12(10):2560–64. doi:10.1080/21645515.2016.1190056.
- Oh SH, Choi EH, Shin SH, Kim YK, Chang JK, Choi KM, Hur JK, Kim KH, Kim JY, Chung EH, et al. Varicella and varicella vaccination in South Korea. Clin Vaccine Immunol. 2014;21(5):762–68. doi:10.1128/CVI.00645-13.
- Kim SH, Lee HJ, Park SE, Oh SH, Lee SY, Choi EH. Seroprevalence rate after one dose of varicella vaccine in infants. J Infect. 2010;61(1):66–72. doi:10.1016/j.jinf.2010.04.001.
- Chaves SS, Gargiullo P, Zhang JX, Civen R, Guris D, Mascola L, Seward JF. Loss of vaccine-induced immunity to varicella over time. N Engl J Med. 2007;356(11):1121–29. doi:10.1056/NEJMoa064040.
- Scherer A, McLean A. Mathematical models of vaccination. Br Med Bull. 2002;62(1):187–99. doi:10.1093/bmb/62.1.187.
- KDCA. Infectious Diseases Surveillance Yearbook, 2019. KDCA(Korea disease control and prevention avency); 2020. KDCA. [accessed October 20, 2020]. http://www.kdca.go.kr/npt/biz/npp/portal/nppPblctDtaView.do?pblctDtaSeAt=1&pblctDtaSn=2139
- Melegaro A, Jit M, Gay N, Zagheni E, Edmunds WJ. What types of contacts are important for the spread of infections?: using contact survey data to explore European mixing patterns. Epidemics. 2011;3(3–4):143–51. doi:10.1016/j.epidem.2011.04.001.