
ABSTRACT
Deaths due to the ongoing COVID-19 pandemic vary (3–1681 deaths/million and mortality rates 0.71–14.54%) and are far greater in some countries compared to others. This observation led us to perform epidemiological analysis, using data in the public domain, to study the correlation of COVID-19 with the prevalence and vaccination strategies for two respiratory pathogens: flu and tuberculosis (TB). Countries showing more than 1000 COVID-19 deaths were selected at three time points during the ongoing pandemic: 17 May, 1 October and 31 December 2020. The major findings of this study that are broadly consistent at all three time points are: First, countries with high flu deaths negatively correlate with COVID-19 deaths/million. Second, TB incidences and deaths negatively correlate with COVID-19 deaths/million. Countries displaying high TB and flu deaths (Nigeria, Ethiopia, Myanmar, Indonesia, India) display lower COVID-19 deaths/million compared to countries with low TB and flu deaths (Italy, Spain, USA, France). Third, countries with greater flu vaccination display lower flu incidences but higher COVID-19 deaths/million and mortality rates. On the other hand, Bacillus Calmette Guerin (BCG) vaccination negatively correlates with Covid-19 deaths/million. Fourth, countries with only BCG, but no flu, vaccination show delayed and lower number of COVID-19 deaths/million compared to countries with flu, but no BCG, vaccination. Fifth, countries with high BCG vaccination coverage as well as high TB deaths display the lowest COVID-19 deaths/million. The implications of this global study are discussed with respect to the roles of respiratory infections and vaccinations in lowering COVID-19 deaths.
KEYWORDS:
Introduction
Coronaviruses belong to a family of enveloped RNA viruses that are known to cause respiratory tract infections in animals and humans. The coronaviruses, Severe Acute Respiratory Syndrome corona virus (SARS-CoV), Middle East Respiratory Syndrome corona virus (MERS) and SARS-Corona Virus 2 (SARS-CoV2) are the cause of epidemics and pandemics in the human population.Citation1 The global pandemic caused by SARS-CoV-2 is known as Coronavirus disease 2019 (COVID-19).Citation2 The virus was first reported in December 2019 and is causing major health issues, widespread death and disrupting economies across the globe. SARS-CoV2 infects the respiratory tract causing mild symptoms or, in severe cases, damage to the lungs.Citation3 SARS-CoV and SARS-CoV2 share the same receptor for entry into host cells, by interaction of the viral spike protein with the host receptor angiotensin converting enzyme (ACE)2.Citation4,Citation5 The Transmembrane protease serine 2 helps in binding of the viral spike protein to the ACE2 receptor by priming and enhancing the entry of SARS-CoV2 in host cells.Citation6 Additionally, Neuropilin-1, a protein known to bind to furin cleaved substrates, also facilitates the entry of COVID-19 in cells having low expression of ACE2.Citation7 The loss of lives and economic damage caused due to COVID-19 has been immense and there is a dire need for potential drugs and vaccines to combat this pathogen.
Mortality due to COVID-19 is variable across different countries (3–1681 deaths/million) (Wikipedia and European Center for Disease Prevention and Control; https://www.worldometers.info/coronavirus/) but the reasons for this heterogeneity are unclear. This may be due to multiple factors playing heterogenous roles: population age, temperature, cultural norms, use of masks and social distancing, early responses by countries to lower viral entry, efficient contact tracing and isolation of COVID-19 patients to prevent spread of infection. In addition, the available health infrastructure, co-morbidities such as hypertension, diabetes, obesity, immune responses and co-infections also affect COVID-19.Citation8 Reports suggest that countries with a younger population are more capable of resisting the infection.Citation9,Citation10 In addition, environmental factors such as temperature and humidity may play antagonistic roles with respect to the transmission of COVID-19 especially in tropical countries.Citation11,Citation12
Immune responses along with co-infections are also a major factor. Prior immunity against infections such as flaviviruses are known to generate protection against non-related pathogens, a phenomenon known as cross immunity.Citation13 In addition, areas with high incidences of malaria demonstrate lower COVID-19 incidences.Citation14 An important factor is vaccinations which have greatly improved our quality of life. Various factors such as genetics, sex, age, adjuvants and scheduling are involved in determining the efficacy of vaccination.Citation15 Vaccination strategies have a protective role against a broad class of pathogens. A recent concept known as trained immunity is the epigenetic and metabolic reprogramming of innate cells by some vaccines that leads to better protective immunity to a broad class of pathogens.Citation16–18 Co-infections may also affect vaccination efficacies and the effects of flu vaccine are lower due to helminth coinfection due to IL-10 production which suppresses immunity.Citation19 It is likely that vaccination policies have a profound effect on COVID-19 induced infections.
The vast variability in the number of COVID-19 deaths across countries led us to investigate the correlation between COVID-19 incidences or deaths with the prevalence of two respiratory diseases, flu and tuberculosis (TB). This study was performed using a sample set of countries that displayed more than 1000 deaths due to COVID-19 at three time points during the ongoing pandemic: 17 May, 1 October and 31 December 2020. Using existing data available in the public domain, we analyzed the relationship between disease prevalence, deaths and vaccination strategies on COVID-19-mediated infections and deaths in each country. Overall, this study demonstrates that COVID-19 deaths are much lower in countries with high flu and TB deaths. Conversely, countries with low flu and TB deaths, in the absence of BCG vaccinations, demonstrate high COVID-19 deaths.
Materials and methods
Sample selection
A sample set of 21 (17th May 2020), 51 (1st October 2020) and 83 (31st December 2020) countries was selected by setting a threshold of a minimum of 1000 COVID-19 deaths. They were analyzed with respect to COVID-19 incidences and deaths and the data was collected from: https://www.worldometers.info/coronavirus/. Kinetic data regarding COVID-19 cases was obtained from: https://www.worldometers.info/coronavirus/. Flu incidences and flu vaccination data was mainly collected from,Citation20,Citation21 https://www.weforum.org/agenda/2020/09/want-to-minimize-the-pandemics-impact-get-a-flu-shot/, https://www.oecd.org/health/graph-of-the-month.htm and https://www.who.int/immunization/research/forums_and_initiatives/02_Ropero_Alvarez_GVRIF14_REVELAC_I_Case_Control_Studies.pdf?ua=1 and https://ec.europa.eu/eurostat/statistics-explained/index.php?title=File:Influenza_vaccination_rate,_people_aged_65_years_and_over,_2013_and_2018_(%25)_Health20.png&oldid=495172.
Data regarding TB incidences and BCG coverage was collected from: http://www.bcgatlas.org/. This database collects information regarding BCG and TB by the following three methods: First, questionnaires were sent to at least two individuals who were experts in TB research, TB control programs and public health/vaccination programs for each country. The questionnaires were available in different languages and mainly targeted both current policy and the actual BCG policies. It also included any changes that possibly occurred in the last 25 years. Other factors such as information regarding tuberculin skin testing, influence of HIV, vaccine strain differences have also been taken into account. Second, published papers, case reports and government policy documents are also included in this database for better information regarding TB exposure and BCG policies. Third, immunization data available from the World Health Organization Vaccine Preventable Diseases Monitoring System was included (http://apps.who.int/immunization_monitoring/en/globalsummary/ScheduleSelect.cfm).Citation22 Flu and TB death rates for all the countries were collected from: https://www.worldlifeexpectancy.com/world-health-rankings.
Mathematical calculations
COVID-19 deaths/million was calculated by dividing the number of COVID-19 deaths to the total population of the country. COVID-19 mortality rate was calculated by dividing the number of COVID-19 deaths to total COVID-19 incidences and then converting it to percentage.
Correlation analysis and significance testing
Graphs were constructed using Microsoft Excel and Spearman’s correlation was applied for all the data in which the correlation coefficient value was designated for each graph. Correlation was considered significant if p < .1. The p value was calculated using an online calculator specific for Spearman’s correlation: https://www.socscistatistics.com/tests/spearman/default2.aspx. Considering the large range of values with respect to COVID-19 incidences, deaths, deaths/million and mortality rate we expected that correlation analysis would be favorable with p < .1 due to the large discrepancy in the data. Additionally, we have performed Pearson’s correlation analysis for the same data sets and have observed similar pattern of significant correlations (data not shown). Bar graphs were constructed using Graph Pad Prism 8.0. One-way ANOVA and Two tailed Student’s t test were used to calculate the statistical significance of the bar graphs, *p < .05 **p < .01, ***p < .001 and ****p < .0001.
Results
Flu incidences and deaths negatively correlates with COVID-19 death/million
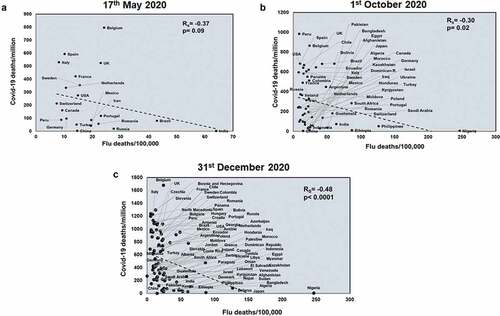
Initially, the countries were selected on the basis of >1000 COVID-19 deaths at three time points: 17th May 2020,1st October 2020 and 31st December 2020. With increasing time, the pandemic has spread as observed by the higher number of countries showing more than 1000 deaths at the later time points. These countries were arranged in a descending order based on the number of COVID-19 deaths (https://www.worldometers.info/coronavirus/). Subsequently, information on COVID-19 incidences, TB incidences & deaths, BCG coverage, flu incidences, deaths and vaccination were added (Supplementary table 1–3). These data collected from various databases gave an in-depth comparison with respect to other infections and various vaccination policies. The Spearman’s correlation coefficient (Rs) was calculated with respect to COVID-19 incidences and deaths, deaths/million and mortality rate. To understand the effects of flu exposure, we performed a correlation study with respect to total COVID-19 incidences, COVID-19 deaths and percentage, flu positive samples (Flu incidences). However, flu incidences showed no correlation with total COVID-19 deaths and incidences (Supplementary figure 1). Additionally, we normalized COVID-19 deaths with COVID-19 incidences and population of the country and represented the data as mortality rate and deaths/million respectively. We then correlated these factors with flu positive samples and flu deaths/100,000. This normalization was important as we wanted to ensure whether the effects that we observe with respect to pathogen exposure and vaccination was correct and not entirely affected by other factors such as population numbers and population density. Only flu incidences showed a significant negative correlation with COVID-19 deaths/million (Rs = −0.35 and p = .01; Rs = −0.34 and p = .01) and mortality rate (Rs = −0.24 and p = .08; Rs = −0.22 and p = .03) at the later time points (1st October and 31st December 2020) (Supplementary figure 2). However, deaths/100,000 due to flu showed a similar significant negative correlation with COVID-19 deaths/million at all three time points, demonstrating the protective role of flu infections in lowering COVID-19 deaths ().
Figure 1. COVID-19 deaths/million negatively correlates with Flu deaths at all three time points studied: Correlation of Flu deaths/100,000 was performed of countries for three different time points: 17th May 2020 (a), 1st October 2020 (b) and 31st December 2020 (c) with respect to COVID-19 deaths/million. The graphs have been correlated and the Spearman’s correlation coefficient value (Rs) has been calculated along with the respective p values. Correlation has been considered statistically significant if p < .1
TB exposure has a protective role with respect to COVID-19 deaths
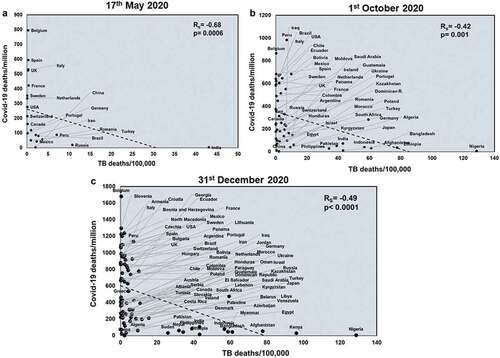
Next, we studied the effects of another respiratory disease, TB exposure on the host with respect to COVID-19. TB incidences did not correlate with total COVID-19 deaths across all three time points studied (Supplementary figure 4). However, TB incidences negatively correlated with COVID-19 deaths/million in all three time points (Rs = −0.78 and p = 3E-05; Rs = −0.52 and p = 8E-05; Rs = −0.49 and p < .0001) (). TB incidences correlate with mortality rate at the two early time points studied (Rs = −0.55 and p = .009; Rs = −0.33 and p = .01) (Supplementary figure 5) and this pattern also holds with respect to TB deaths (Rs = −0.48 and p = .02; Rs = −0.48 and p = .0002) (Supplementary figure 6). Notably, deaths due to TB also had a significant negative correlation with COVID-19 deaths/million (Rs = −0.68 and p = .0006; Rs = −0.42 and p = .001; Rs = −0.49 and p < .0001) across all three time points (). Thus, it was apparent that higher TB exposure is associated with lower COVID-19 deaths.
Figure 2. COVID-19 deaths/million negatively correlates with TB incidences at all three time points studied: Correlation of TB incidences was performed for countries at three different time points: 17th May 2020 (a), 1st October 2020 (b) and 31st December 2020 (c) with respect to COVID-19 deaths/million. The graphs have been correlated and the Spearman’s correlation coefficient value (Rs) was calculated along with the respective p values. Correlation has been considered statistically significant if p < .1
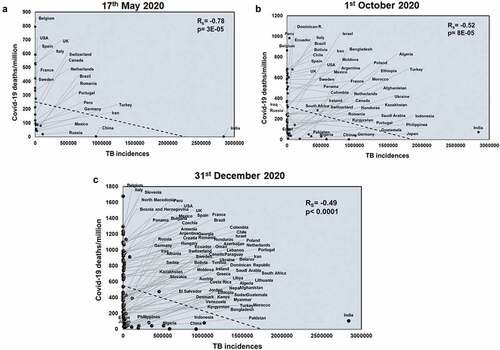
Figure 3. TB deaths correlates with COVID-19 deaths/million negatively at all three time points studied: Correlation of deaths/100,000 due to TB was performed for countries at three different time points: 17th May 2020 (a), 1st October 2020 (b) and 31st December 2020 (c) with respect to COVID-19 deaths/million. The graphs have been correlated and the Spearman’s correlation coefficient value (Rs) and the respective p values have been mentioned. Correlation has been considered statistically significant if p < .1
Countries with high flu and TB deaths have the lowest numbers of COVID-19 induced mortality
We grouped the countries of the three data sets based on the extent of deaths due to flu or TB. The cutoff was kept where countries having more than 25 deaths/100,000 were designated with ‘hi’ due to the high number of deaths whereas countries having deaths less than 25 deaths/100,000 were designated with ‘lo’ due to the lower number of deaths. We thus had three major groups: TBhiFluhi, TBloFluhi and TBloFlulo. The countries belonging to TBloFlulo group showed a trend of increased number of COVID-19 deaths/million as early as 17 May 2020; this trend became more prominent and statistically significant for the data corresponding to 1st October 2020 and 31st December 2020 (). However, there was no difference with respect to mortality rate (Supplementary figure 7). This clearly showed that lower exposure to flu and TB infections was increasing the risk of death due to COVID-19 infection.
Figure 4. Countries having low TB and Flu deaths display the highest COVID-19 deaths/million: Countries were grouped based on the extent of Flu and TB deaths/100,000 and analyzed for COVID-19 deaths/million. The countries were divided into three groups by keeping a cutoff in which countries having >25 deaths/100,000 were considered as high deaths and denoted as ‘hi’ whereas countries having <25 deaths/100,000 were denoted as ‘lo’. The three groups were analyzed for mean differences at three different time points: (a). 17th May 2020, (b). 1st October 2020 and (c). 31st December 2020. One-way ANOVA was used to calculate the statistical significance, *p < .05
Flu vaccination has a significant positive correlation with COVID-19 deaths
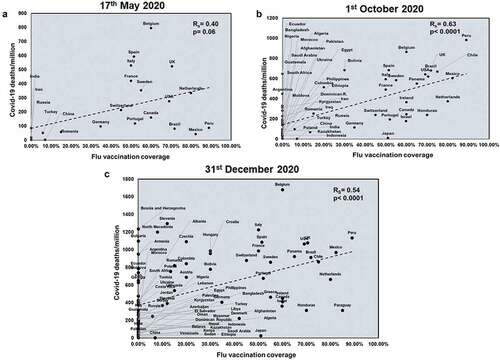
We next wanted to understand the role of vaccinations on COVID-19 infections. As seen in Supplementary figure 8, countries with high flu vaccinations show lower flu incidences. Flu vaccination shows a significant positive correlation with total COVID-19 deaths only at later time points (Supplementary figure 9). Flu vaccination coverage correlated with only the first two time points with respect to mortality rate (Rs = 0.46 and p = .03; Rs = 0.46 and p = .0005) (Supplementary figure 10). However, flu vaccination coverage showed a significant positive correlation with COVID-19 deaths/million across all three time points (Rs = 0.40 and p = .06; Rs = 0.63 and p < .0001; Rs = 0.54 and p < .0001) (). This suggested that flu vaccinations can have detrimental effects and this result is consistent with the observation that countries with higher flu exposure have lower COVID-19 death.
Figure 5. COVID-19 deaths/million positively correlates significantly with Flu vaccination coverage at all three time points studied: Correlation of Flu vaccination coverage was performed for countries at three time points: 17th May 2020 (a), 1st October 2020 (b) and 31st December 2020 (c) with respect to COVID-19 deaths/million. The graphs have been correlated and the Spearman’s correlation coefficient value (Rs) was calculated along with the respective p values. Correlation has been considered statistically significant if p < .1
Countries with high BCG coverage have lower deaths due to COVID-19
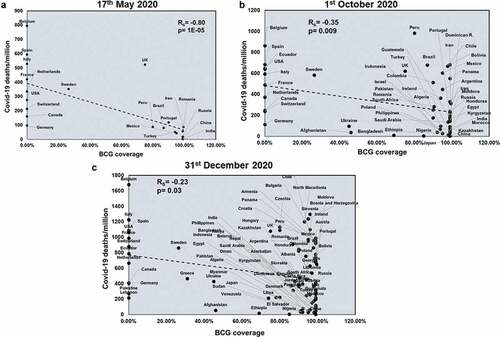
BCG coverage showed a significant negative correlation with COVID-19 total deaths only at the first two time points (Rs = −0.51 and p = .01; Rs = −0.29 and p = .03) (Supplementary figure 11). Also, BCG negatively correlates with COVID-19 mortality rate (Rs = −0.56 and p = .007; Rs = −0.41 and p = .002) at the first two time points (Supplementary figure 12). However, BCG negatively correlates with COVID-19 deaths/million across all three time points (Rs = −0.80 and p = 1E-05; Rs = −0.35 and p = .009; Rs = −0.23 and p = .03) (). These correlation studies suggest a protective role of BCG with respect to deaths due to COVID-19 infection.
Figure 6. BCG coverage negatively correlates with COVID-19 deaths/million at all three time points studied: BCG coverage was correlated for countries at three different time points: 17th May 2020 (a), 1st October 2020 (b) and 31st December 2020 (c) with respect to COVID-19 deaths/million. Spearman’s correlation coefficient value (Rs) and the respective p values have been mentioned for each graph. Correlation has been considered statistically significant if p < .1
BCG+FluVac− countries have the lowest COVID-19 deaths along with delayed transmission of infection
Although BCG and flu vaccination coverage had a significant correlation with COVID-19 mortality, the correlation data with respect to these factors and COVID-19 deaths showed a great deal of heterogeneity as seen by the huge spread in countries with these vaccinations. Therefore, we segregated the countries of the three time points based on the following observations: First, the presence and absence of vaccination was denoted as “+” or “-”. Second, the extent of available vaccination coverage was denoted as “hi” (if the coverage was ≥ 50%) and “lo” (if the coverage was <50%). This classification resulted in six groups: BCG−FluVac− (Ecuador and Lebanon), BCG−FluVac+, BCGloFluVachi (Sweden and Greece), BCGhiFluVachi, BCGhiFluVaclo and BCG+FluVac−. With few exceptions listed, the vast majority of countries could be classified into four major groups. We observed that countries belonging to the group of BCG−FluVac+ had the highest COVID-19 deaths/million at all three time points. Additionally, BCG+FluVac− had the lowest COVID-19 deaths/million further emphasizing the protective roles of BCG ()). Notably, these differences were not so apparent with total COVID-19 deaths and mortality rates (Supplementary figure 13). These differences made us to ask the question whether vaccination could affect the kinetics of transmission of COVID-19 in the population of each country. We compared the time taken for the first 10,000 COVID-19 cases to occur in each country (https://www.worldometers.info/coronavirus/). Interestingly, we observed that countries belonging to the group of BCG+FluVac− had the most delayed kinetics with respect to the first 10,000 cases of COVID-19 ()). This reiterates the observation that high BCG and low/no Flu vaccination coverage not only caused a reduction in COVID-19 deaths but also lowered the rate of transmission within the population of a country.
Figure 7. Countries belonging to the group of BCG+FluVac− display the lowest COVID-19 deaths/million and the most delayed transmission of infection: Countries were grouped based on the coverage of BCG and flu vaccination and analyzed for COVID-19 deaths/million and COVID-19 mortality rate. These vast majority of countries were divided into four groups firstly based on the availability or non-availability of BCG or flu vaccination, designated with ‘+’ and ‘-‘ respectively. Next, the groups were further classified based on the extent of coverage of a particular vaccination. Countries with >50% coverage of a particular vaccination were considered having high vaccination and denoted with ‘hi’ whereas countries with <50% coverage were considered having low vaccination coverage and thus denoted ‘lo’. The four major groups were analyzed for mean differences at three different time points: (a). 17th May 2020, (b). 1st October 2020. and (c). 31st December 2020. (d). The major groups out of 83 countries were also compared with respect to the time required for the first 10,000 cases to occur. One-way ANOVA was used to calculate the statistical significance, *p < .05 **p < .01, ***p < .001 and ****p < .0001
Both TB exposure and BCG vaccination are associated with lower COVID-19 mortality
As we observed that both TB and BCG had a significant negative correlation with COVID-19 deaths, it was important to address the importance of these two factors. Thus, we selected the countries with both BCG coverage and TB deaths and observed two major groups: BCGhiTBhi and BCGhiTBlo which are high BCG coverage-high TB deaths and high BCG coverage-low TB deaths, respectively. We observed that countries belonging to the group of BCGhiTBhi had significant lower numbers of COVID-19 deaths/million () compared to countries of the group BCGhiTBlo. This demonstrated that the best protection against COVID-19 mortality was observed in countries where both BCG coverage and TB exposure are high (). Finally, countries were segregated based on the different BCG strains used for vaccinations. As seen in Supplementary figure 15, countries using different strains of BCG display heterogeneity with respect to COVID-19 deaths/million. However, countries using the BCG Russia (Moscow) strain like India, Russia and Turkey showed the lowest COVID-19 deaths/million compared to countries using the BCG Moreau used by Brazil, Poland Croatia.
Figure 8. Countries with high BCG and high TB deaths show the lowest COVID-19 deaths/million: Countries with BCG coverage and TB deaths were further classified based on the extent of vaccine coverage and deaths/100,000. The two major groups were: BCGhiTBhi and BCGhiTBlo. The data was plotted based on COVID-19 deaths/million for (a). 17th May 2020, (b). 1st October 2020 and (c). 31st December 2020. Unpaired t test was used to calculate statistical significance, *p < .05 and ****p < .0001
Figure 9. A model depicting the roles of vaccination and pathogen exposure on COVID-19 induced mortality: Countries having a vaccine providing broader protection, such as BCG, along with continuous exposure to pathogens provides effective cross immunity and thus lowers the numbers of COVID-19 induced deaths. It is possible that this combination will increase protection against newer pathogens in the future
Discussion
The reasons as to why COVID-19 mortality is higher in some countries but not others led us to initiate this study. Epidemiological studies conducted clearly identified countries with high flu and TB deaths to show lower COVID-19 deaths/million (Supplementary tables 1–3). Concurrently, this study showed the opposing effects of flu and BCG vaccinations on COVID-19 deaths (). It appears that pathogen exposure and/or vaccination coverage determines the severity as well as the kinetics of COVID-19 infections. It is known that countries with high exposure to pathogens causing chronic infections generate nonspecific immunity. For e.g., Helicobacter pylori infection confers protection against tuberculosis.Citation23 The novel aspect of this study is the identification of countries with high flu and TB deaths to show lower COVID-19 deaths. As the study was performed at three time points, it sheds light on the characteristics of countries that showed greater deaths at an earlier time point compared to later ones. Notably, the countries with the maximum COVID-19 deaths/million at the early time points are ones that show the lowest deaths due to Flu and TB (). Concurrently, countries that are BCG+FluVac− have the least amounts of COVID-19 deaths/million ().
The main aspects of our study are discussed in the light of our findings. There are several possibilities for the effects of flu infections in lowering COVID-19 infections. First, it is possible that nonspecific immunity is increased upon flu infections, as is known for several viral infections.Citation13,Citation24 Second, it is possible that flu infections may lower the surface expression of the ACE2 receptors and/or lower the entry of the virus into cells. In fact, infections in mice with a highly pathogenic strain of H5N1 influenza virus down regulate ACE2 expression in lungs.Citation25 Third is the possibility of viral interference which is the phenomenon when one virus inhibits the replication of another virus, virulence properties and damage to the host.Citation26 Studies have shown that flu infections affect the populations of other viruses in the respiratory tract.Citation26,Citation27 Clearly, these studies demonstrate the complex roles of virus–virus interactions in the respiratory tract. One will need to study the short as well as long term effects on different viruses and infections with the specific SARS-CoV-2 vaccines being launched.
The majority of flu related deaths are in the elderly who have a weakened immune system due to senescence. This has led to the development of more potent flu vaccines containing higher antigen or adjuvants which boost the immune system.Citation28 Studies need to be performed to investigate the roles of flu vaccinations in modulating ACE2 expression in humans as it may explain the higher infectivity of the SARS-CoV2 virus in the elderly population. As seen in Supplementary figure 8, flu vaccination is effective in lowering the number of flu infections. However, countries with high flu vaccination show high COVID-19 deaths/million (), e.g. USA, Italy, France and Spain. Most likely, the lower flu infections in these countries make them prone to the high number of COVID-19 deaths. The observation that flu vaccination increases resistance to SARS-CoV-2 infection is not contrary to this study as it is boosting nonspecific short-term immunity.Citation13,Citation29
Subsequently, we studied the effects of another respiratory pathogen, TB, on COVID-19 infection. We observed a significant negative correlation of TB deaths with COVID-19 deaths/million suggesting countries which have an endemic problem of TB are well protected from COVID-19 mortality (). This is relevant as previous studies have shown that TB infections cause a downregulation of ACE2 and an upregulation of ACE which enhances pleural effusion.Citation30 Thus, it is possible that constant exposure to TB could reduce the infection rate of COVID-19 by inhibiting its binding capacity to host cells. In addition, it is possible that components in Mycobacteria may help in boosting immune responses in countries with high endemic amounts of this bacteria.Citation31–34
BCG is a live attenuated vaccine which has been shown to protect newborn children from tuberculosis and is an efficient pediatric vaccine; however, there is a discrepancy with respect to the long-lasting protection provided by BCG in adults. In South east Asian countries, there is a constant exposure to TB and this may contribute to a lower efficacy of BCG against TB.Citation35,Citation36 On the other hand, countries which have much cleaner environments, BCG vaccination provides a more robust and prolonged protection to TBCitation37 and in some cases even after forty to sixty years.Citation38,Citation39 Remarkably, BCG has been shown to increase the nonspecific immunity to several pathogens including respiratory onesCitation40,Citation41 and lowers mortality in children from pneumonia and sepsis.Citation42,Citation43 In fact, BCG vaccination before influenza shots leads to higher antibody responses against influenza A or H1N1 virus.Citation44
How is BCG able to mediate such remarkable effects? BCG vaccination leads to epigenetic reprogramming leading to quicker and higher amounts of pro-inflammatory cytokines especially IL1, known as trained immunity.Citation16–18 Many studies have shown the correlation of BCG vaccine in lowering the severity of COVID-19.Citation45,Citation46 However, in a study of BCG-vaccinated versus unvaccinated individuals in Israel, no role for BCG in affecting COVID-19 incidences was found.Citation47 In this study too, BCG coverage correlates negatively with COVID-19 deaths/million (). BCG vaccination does lead to delayed incidences of COVID-19 ()); however, the lowest mortality rate is observed in countries with BCG vaccination and high TB deaths (). This is the novel aspect of our study at three distinct time points during the pandemic. This leads us to propose that the combination of high BCG vaccination coverage together with continuous exposure to pathogens is likely to boost cross reactive immunity leading to a better ability to deal with various infectious pathogens and lowering COVID-19 induced mortality ().
Overall, there are multiple factors involved in the spread of COVID-19. There are heterogeneous issues and confounding factors involved in sampling data for this study, e.g. population density, age, sex, reports in the data available to the public domain, variations in the climate and light exposure, cultural and diet aspects, etc. Other factors such as the rise of SARS-CoV2 variants, immune cell responses across different populations against COVID-19 infection have to be taken into account as cross reactive T cell responses against coronaviruses limit the pathological effects of COVID-19.Citation48,Citation49 On the other hand, complement factors and neutrophil extracellular traps increase hyper inflammation and thrombotic angiopathy causing more COVID-19 mortality.Citation50 Given the heterogenous and confounding factors with regard to adequate testing, data from official public domains, state of the healthcare systems, demography of affected patients and discrepancies with COVID-19 deaths being reported, the study here has its limitations. With respect to BCG vaccinations, the use of different strains and roles of environmental Mycobacteria may also play confounding roles. Also, our correlations are consistent for COVID-19 deaths/million which are highly variable from 3–1681 deaths/million but not for mortality rate (0.71–14.54%). There are pitfalls in the determination of mortality rate as it depends on the number of true COVID-19 cases and the extent of testing. Despite these variables, it is remarkable that we were able to get significant correlations between COVID-19 deaths/million and flu & TB deaths and flu & BCG vaccination in this diverse sample set of countries across three time points. Further studies need to be performed with other respiratory pathogens and vaccination strategies to identify additional pathogens that may modulate COVID-19 deaths.
We understand that multiple factors are often involved in governing the number of COVID-19 incidences as well as deaths in a country, but our results reveal a consistent global trend, nonetheless. The novel aspect of this study is the interplay of pathogen exposure and vaccination strategies with respect to flu and TB in affecting COVID-19 deaths. It may be useful to consider the use of vaccines that are potent inducers of nonspecific immunity, such as BCG, as this strategy may be important in protecting vulnerable groups to the current as well as future pandemics by novel microbes. The results of our study should prompt more detailed clinical studies on the efficacy of BCG at periodic intervals, in the short term as well as long term, in reducing COVID-19 deaths and protecting against newer infections, especially in those who are highly vulnerable, e.g. the elderly.
Disclosure of potential conflicts of interest
No potential conflicts of interest were disclosed.
Supplemental Material
Download ()Acknowledgments
We thank Dipankar Ghosh (JNU, Delhi), D.N. Rao (IISc, Bangalore) and Soumen Basak (NII, Delhi) for encouraging us to work on COVID-19. The interactions and comments on our study by Shamik Majumdar (NIH, USA), Arvind Sahu (NCCS, Pune), B. Ravindran (ILS/NISER, Bhubaneshwar), Ramray Bhat (IISc, Bangalore), Udaykumar Ranga (JNCASR, Bangalore), Amit Singh (IISc, Bangalore), Vrinda Nandi (Bangalore) and all members for the DpN laboratory are gratefully appreciated. This work was conceived during the pandemic months of April–May 2020 and we thank the DBT-IISc partnership program for funding our innate curiosity.
Supplementary material
Supplemental data for this article can be accessed on the publisher’s website at https://doi.org/10.1080/21645515.2021.1908058
Additional information
Funding
References
- Singhal TA. Review of coronavirus disease-2019 (COVID-19). Indian J Pediatr. 2020;87:281–86. doi:10.1007/s12098-020-03263-6.
- Lai CC, Shih TP, Ko WC, Tang HJ, Hsueh PR. Severe acute respiratory syndrome coronavirus 2 (SARS-CoV-2) and coronavirus disease-2019 (COVID-19): the epidemic and the challenges. Int J Antimicrob Agents. 2020;55:105924. doi:10.1016/j.ijantimicag.2020.105924.
- Rubin EJ, Baden LR, Morrissey S. Audio interview: making decisions about Covid-19 testing and treatment for your patients. N Engl J Med. 2020;382:e25. doi:10.1056/NEJMe2004856.
- Zhou P, Yang XL, Wang XG, Hu B, Zhang L, Zhang W, Si H-R, Zhu Y, Li B, Huang C-L, et al. A pneumonia outbreak associated with a new coronavirus of probable bat origin. Nature. 2020;579:270–73. doi:10.1038/s41586-020-2012-7.
- Cao Y, Li L, Feng Z, Wan S, Huang P, Sun X, Wen F, Huang X, Ning G, Wang W. Comparative genetic analysis of the novel coronavirus (2019-nCoV/SARS-CoV-2) receptor ACE2 in different populations. Cell Discovery. 2020;6:11. doi:10.1038/s41421-020-0147-1.
- Hoffmann M, Kleine-Weber H, Schroeder S, Krüger N, Herrler T, Erichsen S, Schiergens TS, Herrler G, Wu NH, Nitsche A, et al. SARS-CoV-2 cell entry depends on ACE2 and TMPRSS2 and is blocked by a clinically proven protease inhibitor. Cell. 2020;181:271–80.
- Cantuti-Castelvetri L, Ojha R, Pedro LD, Djannatian M, Franz J, Kuivanen S, van der Meer F, Kallio K, Kaya T, Anastasina M, et al. Neuropilin-1 facilitates SARS-CoV-2 cell entry and infectivity. Science (New York, N.Y.). 2020 370;eabd2985. Advance online publication. doi: 10.1126/science.abd2985
- Guan WJ, Liang WH, Zhao Y, Liang HR, Chen ZS, Li YM, Liu XQ, Chen RC, Tang CL, Wang T, Ou CQ, et al. Comorbidity and its impact on 1590 patients with COVID-19 in China: a nationwide analysis. Eur Respir J. 2020;55:2000547. doi:10.1183/13993003.00547-2020.
- Koh WC, Naing L, Wong J. Estimating the impact of physical distancing measures in containing COVID-19: an empirical analysis. Int J Infect Dis. 2020;100:42–49. doi:10.1016/j.ijid.2020.08.026.
- Liu Y, Mao B, Liang S, Yang JW, Lu HW, Chai YH, Wang L, Zhang L, Li Q-H, Zhao L, et al. Association between age and clinical characteristics and outcomes of COVID-19. Eur Respir J. 2020;55:2001112. doi:10.1183/13993003.01112-2020.
- Mandal CC, Panwar MS. Can the summer temperatures reduce COVID-19 cases? Public Health. 2020;185:72–79. doi:10.1016/j.puhe.2020.05.065.
- Qi H, Xiao S, Shi R, Ward MP, Chen Y, Tu W, Su Q, Wang W, Wang X, Zhang Z, et al. COVID-19 transmission in Mainland China is associated with temperature and humidity: a time-series analysis. Sci Total Environ. 2020;728:138778. doi:10.1016/j.scitotenv.2020.138778.
- Rathore APS, St John AL. Cross-reactive immunity among flaviviruses. Front Immunol. 2020;11:334. doi:10.3389/fimmu.2020.00334.
- Ahmed AE. Incidence of coronavirus disease (COVID-19) and countries affected by malarial infections. Travel Med Infect Dis. 2020;101693. doi:10.1016/j.tmaid.2020.101693.
- Zimmermann P, Curtis N. The influence of BCG on vaccine responses - a systematic review. Expert Rev Vaccines. 2018;17:547–54. doi:10.1080/14760584.2018.1483727.
- Kleinnijenhuis J, Quintin J, Preijers F, Benn CS, Joosten LA, Jacobs C, Van Loenhout J, Xavier RJ, Aaby P, van der Meer JWM, et al. Long-lasting effects of BCG vaccination on both heterologous Th1/Th17 responses and innate trained immunity. J Innate Immun. 2014;6:152–58. doi:10.1159/000355628.
- Arts RJW, Moorlag S, Novakovic B, Li Y, Wang SY, Oosting M, Kumar V, Xavier RJ, Wijmenga C, Joosten LAB, et al. BCG vaccination protects against experimental viral infection in humans through the induction of cytokines associated with trained immunity. Cell Host Microbe. 2018;23:89–100.e5. doi:10.1016/j.chom.2017.12.010.
- Mourits VP, Koeken VACM, Lcj DB, Moorlag SJCFM, Chu WC, Xu X, Dijkstra H, Lemmers H, Joosten LAB, Wang Y, et al. BCG-induced trained immunity in healthy individuals: the effect of plasma muramyl dipeptide concentrations. J Immunol Res. 2020;2020:5812743. doi:10.1155/2020/5812743.
- Hartmann W, Brunn ML, Stetter N, Gagliani N, Muscate F, Stanelle-Bertram S, Gabriel G, Breloer M. Helminth infections suppress the efficacy of vaccination against seasonal influenza. Cell Rep. 2019;29:2243–2256.e4. doi:10.1016/j.celrep.2019.10.051.
- Mereckiene J, Cotter S, Nicoll A, Lopalco P, Noori T, Weber J, D’Ancona F, Levy-Bruhl D, Dematte L, Giambi C, et al. Seasonal influenza immunisation in Europe. Overview of recommendations and vaccination coverage for three seasons: pre-pandemic (2008/09), pandemic (2009/10) and post-pandemic (2010/11). Euro Surveillance. 2014;19:20780. doi:10.2807/1560-7917.es2014.19.16.20780.
- Rosano A, Bella A, Gesualdo F, Acampora A, Pezzotti P, Marchetti S, Ricciardi W, Rizzo C. Investigating the impact of influenza on excess mortality in all ages in Italy during recent seasons (2013/14-2016/17 seasons). Int J Infect Dis. 2019;88:127–34. doi:10.1016/j.ijid.2019.08.003.
- Zwerling A, Behr MA, Verma A, Brewer TF, Menzies D, The PM. BCG world atlas: a database of global BCG vaccination policies and practices. PLoS Med. 2011;8(3):e1001012. doi:10.1371/journal.pmed.1001012.
- Muraille E. The unspecific side of acquired immunity against infectious disease: causes and consequences. Front Microbiol. 2016;6:1525. doi:10.3389/fmicb.2015.01525.
- Kumar N, Sharma S, Barua S, Tripathi BN, Rouse BT. Virological and immunological outcomes of coinfections. Clin Microbiol Rev. 2018;31:e00111–17.
- Zou Z, Yan Y, Shu Y, Gao R, Sun Y, Li X, Ju X, Liang Z, Liu Q, Zhao Y, et al. Angiotensin-converting enzyme 2 protects from lethal avian influenza A H5N1 infections. Nat Commun. 2014;5(1):3594. doi:10.1038/ncomms4594.
- Nickbakhsh S, Mair C, Matthews L, Reeve R, Johnson PCD, Thorburn F, Von Wissmann B, Reynolds A, McMenamin J, Gunson RN, et al. Virus-virus interactions impact the population dynamics of influenza and the common cold. Proc Natl Acad Sci U S A. 2019;116:27142–50. doi:10.1073/pnas.1911083116.
- Wolff GG. Influenza vaccination and respiratory virus interference among Department of Defense personnel during the 2017-2018 influenza season. Vaccine. 2020;38:350–54. doi:10.1016/j.vaccine.2019.10.005.
- Smetana J, Chlibek R, Shaw J, Splino M, Prymula R. Influenza vaccination in the elderly. Hum Vaccin Immunother. 2018;14:540–49. doi:10.1080/21645515.2017.1343226.
- Marín-Hernández D, Schwartz RE, Nixon DF. Epidemiological evidence for association between higher influenza vaccine uptake in the elderly and lower COVID-19 deaths in Italy. J Med Virol. 2020. doi:10.1002/jmv.26120. Advance online publication.
- Hsieh WY, Kuan TC, Cheng KS, Liao YC, Chen MY, Lin PH, Hsu YC, Huang CY, Hsu WH, Yu SY, et al. ACE/ACE2 ratio and MMP-9 activity as potential biomarkers in tuberculous pleural effusions . Int J Biol Sci. 2012;8:1197–205. doi:10.7150/ijbs.5087.
- Rakshit S, Ponnusamy M, Papanna S, Saha B, Ahmed A, Nandi D. Immunotherapeutic efficacy of Mycobacterium indicus pranii in eliciting anti-tumor T cell responses: critical roles of IFNγ. Int J Cancer. 2012;130:865–75. doi:10.1002/ijc.26099.
- Soares KC, Zheng L, Edil B, Jaffee EM. Vaccines for pancreatic cancer. Cancer J. 2012;18:642–52. (Sudbury, Mass.). doi:10.1097/PPO.0b013e3182756903.
- Podder S, Rakshit S, Ponnusamy M, Nandi D. Efficacy of bacteria in cancer immunotherapy: special emphasis on the potential of mycobacterial species. Clin Cancer Drugs. 2016;3:100–08. doi:10.2174/2212697X03666160824130123.
- Kubota M, Iizasa E, Chuuma Y, Kiyohara H, Hara H, Yoshida H. Adjuvant activity of Mycobacteria-derived mycolic acids. Heliyon. 2020;6(5):e04064. doi:10.1016/j.heliyon.2020.e04064.
- Primm TP, Lucero CA, Falkinham JO 3rd. Health impacts of environmental mycobacteria. Clin Microbiol Rev. 2004;17:98–106. doi:10.1128/CMR.17.1.98-106.2004.
- Wu J, Dalal K. Tuberculosis in Asia and the pacific: the role of socioeconomic status and health system development. Int J Prev Med. 2012;3:8–16.
- Walls T, Shingadia D. The epidemiology of tuberculosis in Europe. Arch Dis Child. 2007;92:726–29. doi:10.1136/adc.2006.102889.
- Aronson NE, Santosham M, Comstock GW, Howard RS, Moulton LH, Rhoades ER, Harrison LH. Long-term efficacy of BCG vaccine in American Indians and Alaska natives: a 60-year follow-up study. Jama. 2004;291:2086–91. doi:10.1001/jama.291.17.2086.
- Nguipdop-Djomo P, Heldal E, Rodrigues LC, Abubakar I, Mangtani P. BCG vaccination: a long-lasting protection against tuberculosis?–Authors’ reply. Lancet Infect Dis. 2016;16:408–09. doi:10.1016/S1473-3099(16)00134-1.
- Mukherjee S, Subramaniam R, Chen H, Smith A, Keshava S, Shams H. Boosting efferocytosis in alveolar space using BCG vaccine to protect host against influenza pneumonia. PLoS One. 2017;12:e0180143. doi:10.1371/journal.pone.0180143.
- Moorlag S, Arts RJW, Van Crevel R, Netea MG. Non-specific effects of BCG vaccine on viral infections. Clin Microbiol Infect. 2019;25:1473–78.
- De Castro MJ, Pardo-Seco J, Martinón-Torres F. Nonspecific (heterologous) protection of neonatal BCG vaccination against hospitalization due to respiratory infection and sepsis. Clini Infect Dis. 2015;60:1611–19. doi:10.1093/cid/civ144.
- Uthayakumar D, Paris S, Chapat L, Freyburger L, Poulet H, De Luca K. Non-specific effects of vaccines illustrated through the BCG example: from observations to demonstrations. Front Immunol. 2018;9:2869.
- Leentjens J, Kox M, Stokman R, Gerretsen J, Diavatopoulos DA, van Crevel R, Rimmelzwaan GF, Pickkers P, Netea MG. BCG vaccination enhances the immunogenicity of subsequent influenza vaccination in healthy volunteers: a randomized, placebo-controlled pilot study. J Infect Dis. 2015;212:1930–38. doi:10.1093/infdis/jiv332.
- Ozdemir C, Kucuksezer UC, Tamay ZU. Is BCG vaccination affecting the spread and severity of COVID-19? Allergy. 2020;75:1824–27. doi:10.1111/all.14344.
- Dolgikh S. Further Evidence of a Possible Correlation between the Severity of Covid-19 and BCG Immunization. J Infect Dis Epidemiol 2020; 6:120.
- Hamiel U, Kozer E, Youngster I. SARS-CoV-2 rates in BCG-vaccinated and unvaccinated young adults. Jama. 2020;323:2340–41. doi:10.1001/jama.2020.8189.
- Sekine T, Perez-Potti A, Rivera-Ballesteros O, Strålin K, Gorin JB, Olsson A, Llewellyn-Lacey S, Kamal H, Bogdanovic G, Muschiol S, et al. Robust T cell immunity in convalescent individuals with asymptomatic or mild COVID-19. Cell. 2020;183:158–168.e14. doi:10.1016/j.cell.2020.08.017.
- Lipsitch M, Grad YH, Sette A, Crotty S. Cross-reactive memory T cells and herd immunity to SARS-CoV-2. Nat Rev Immunol. 2020;20:709–13. doi:10.1038/s41577-020-00460-4.
- Skendros P, Mitsios A, Chrysanthopoulou A, Mastellos DC, Metallidis S, Rafailidis P, Ntinopoulou M, Sertaridou E, Tsironidou V, Tsigalou C, et al. Complement and tissue factor-enriched neutrophil extracellular traps are key drivers in COVID-19 immunothrombosis. J Clin Invest. 2020;130(11):6151–6157.