
ABSTRACT
The Hepatitis B (HB) vaccine is efficacious in preventing hepatitis B virus infection. However, the association between antibody response to the HB vaccine and dynamic immune repertoire changes in different cell subsets remains unclear. Nine healthy participants were administered three doses of HB vaccine following the 0, 1, 6 month schedule. Peripheral CD4+ T, memory B (MB), naïve B (NB), and plasma cells (PCs) were sorted before vaccination and 7 days following each dose. The complementary determining region 3 of T-cell receptor β (TCRβ) chain and B-cell receptor (BCR) heavy chain (IgG, IgM, IgA) repertoires were analyzed by high-throughput sequencing. All nine participants elicited protective antibody titers to the vaccine at the end of immunization. Compared with the baseline, MB cells showed a significant increase in IgG usage and decreased IgM usage and repertoire diversity at the end of vaccination. TCRβ diversity changes were highly correlated with those of the BCR in MB cells in participants with a faster and robust antibody responses. The percentage of shared clonotypes between NB and MB cells, and MB cells and PCs were much higher than that between NB cells and PCs. The more clonotypes sharing the faster and stronger antibody responses were observed after HB vaccination. These results suggest the integral involvement of MB cells in vaccine immunization. Interaction between CD4+ T and MB cells and B cell differentiation may improve antibody response to HB vaccine.
Introduction
Disease caused by hepatitis B virus (HBV) infection has a worldwide distribution. Chronically infected individuals are at a greatly increased risk of developing liver fibrosis, cirrhosis, and hepatocellular carcinoma. Hepatitis B (HB) vaccination has been shown a very successful way to prevent HBV infection. Following HB vaccination, B cells can directly recognize HB surface antigen (HBsAg) through the B cell receptor (BCR), providing the first signal for B cell activation. The type 2 helper T (Th2) cells then activate these B cells and help them differentiate into antibody-secreting plasma cells (PCs) and memory B (MB) cells with high-affinity.Citation1,Citation2 The antibody to HBsAg (anti-HBs) is used to assess immunity to HBV.
BCR, the membrane-bound immunoglobulin (Ig) on the B-cell surface, consists of paired heavy and light chains. BCRs have the theoretical potential to generate more diversity than can be uniquely displayed on the 1011 B cells in an individual.Citation3 Recent research shows that the circulating Ig heavy chain (H) repertoire in a person is comprised of between 9 and 17 million clonotypes.Citation4 Initial BCR diversity is generated by combinatorial variable (V), diversity (D), and joining (J) gene segments (heavy chain) or V and J gene segments (light chain) rearrangements. Diversity is further increased by the addition of palindromic and non-templated nucleotides at the junctions between segments, and exonuclease activity leading to potential nucleotide deletion. During response to an antigen, further diversification occurs through rounds of somatic hypermutation, followed by selection of B cells for improved antigen binding in the germinal center.Citation5
Advances in next-generation sequencing (NGS) allow simultaneous sequencing of millions of sequences, making in–depth studies of the BCR repertoire possible.Citation6–12 There is an increasing body of data characterizing changes in the antibody repertoire following vaccination.Citation5 In recent years, several studies have focused on immune repertoire changes during HB vaccination. Galson et al. analyzed the longitudinal response of both the total and vaccine-specific antibody repertoire after each HB vaccination using NGS.Citation7 They suggested that in the response to the first dose, vaccine-specific BCR clusters are mainly derived from antecedently activated cross-reactive B cells with low affinity to the vaccine. The higher affinity B cells were produced after succedent doses. More recently, by conducting NGS on five volunteers, Miyasaka et al. found that the T cell receptor (TCR) β chain complementary determining region 3 (CDR3) repertoire diversity significantly increased, while the BCR IgG H chain CDR3 repertoire diversity significantly decreased after the second vaccination, suggesting that these diversity changes might be associated with a better response to the HB vaccine.Citation11 However, longitudinal differences and the relationship between B cell subsets, as well as BCR and TCR repertoires, remain unknown, especially among individuals with different anti-HB levels in response to the HB vaccine.
In this study, we investigated the changes in the characteristics and dynamics of BCR and TCR repertoires before and after HB vaccination. Combined with serum antibody levels, we demonstrate the importance of MB cells and their interaction with CD4+ T cells in antibody response to the HB vaccine. These findings provide new insights into the evaluation of responsiveness to the HB vaccination.
Participants and methods
Participant vaccination and anti–HBs testing
To exclude the influence of age on repertoire diversity, nine healthy medical students with similar ages (18-21 years) were recruited. All the participants were anti-HBs negative. Each participant was administered three 20 μg doses of HB vaccine (Engerix B, GlaxoSmithKline) following the 0, 1, and 6 month schedule. Blood was taken immediately before vaccination (T1) and 7 days following each dose (the first T2, second T3, and third T4 dose inoculation). Blood serum was isolated by centrifugation. Anti-HBc and anti-HBs titers were detected using the ARCHITECT i2000SR (Abbott Laboratories, Chicago, IL, USA). This study was conducted according to the principles of the Declaration of Helsinki, and was approved by the Ethics Committee of Nanfang Hospital. Written informed consent was obtained from all participants.
Isolation of peripheral blood mononuclear cells (PBMCs) and cell sorting
PBMCs were isolated by density–gradient centrifugation and were cryopreserved in liquid nitrogen until analysis. For cell sorting, PBMCs (3-10 × 106) were thawed as previously described.Citation13 PBMCs were labeled with Live/Dead (Life Technologies), CD4-APC, CD19-PE, CD20-FITC, CD27-PE-Cy7, and CD38-V450 (BD Biosciences). Using the FACSAria III Cell Sorter (BD Biosciences) the following cell types were sorted: viable, CD4+ T cells; viable, CD19+, CD20+, CD27+, CD38− MB cells; viable, CD19+, CD20+, CD27−, CD38− naive B (NB) cells; and viable, CD19+, CD20− PCs.
RNA preparation and repertoire sequencing
Total RNA was extracted from sorted cells using TRIzol reagent (Life Technologies, Carlsbad, CA, USA) and reverse transcription was performed using 5′ rapid amplification of cDNA ends. TCRβ and BCR heavy chains were amplified by nested PCR with universal forward primers and TCRβ-, IgG-, IgM-, IgA-specific reverse primers as previously described.Citation14 TCR and BCR libraries were generated using the NEBnext Ultra DNA Library Prep kit (New England Biolabs, Ipswich, MA, USA) as describedCitation15 and deep sequenced using the Illumina HiSeq platform (Illumina, San Diego, CA, USA) with a read length of 2 × 250 bp.
Raw sequence processing
Initial quality filtering was performed to remove low-quality sequences and the FASTQ files obtained by sequencing were imported to MiXCR (version 3.0.7) for TCRβ or IgH V, D and J gene identification, CDR3 sequence extraction and error corrections.Citation16 Productive TCRβ or IgH sequence reads were filtered by removing: (i) any read with CDR3s shorter than four amino acids (aa); (ii) CDR3 contigs with a length that was not a multiple of three; and (iii) contigs containing stop codons. Filtered sequence reads with identical CDR3 aa sequence were considered the same clonotype and were used for repertoire assessment.
Statistical analysis
Statistical analysis was performed using SPSS version 20 (IBM Corp., Armonk, NY, USA). Circos display of shared clones was performed by circos software package.Citation17 The data are expressed as median. The Kruskal–Wallis H test was used for comparisons between three groups and shared clones. The Friedman’s M test was used to compare values among four time points during vaccination and values among cell subset-related samples. The q test was subsequently used to determine which two values were significantly different if the Friedman’s M test P-value was <0.05. The Pearson correlation coefficient was used to calculate correlations. Two-sided P-values <0.05 were considered to be statistically significant.
Results
Serological response after HB vaccination
All nine participants had an anti-HBs concentrations greater than 10 mIU/ml after the third vaccination. To analyze immune repertoire distinctions between individuals with different levels of antibody response, the participants were divided into three groups based on their serum antibody concentrations. Group1 consisted of participants 2 (P2), 6 (P6), and 8 (P8), all of whom had anti-HBs concentrations greater than 10 mIU/ml after the first-dose vaccination and greater than 1000 mIU/ml after the third. Group2 consisted of participants 3 (P3), 4 (P4), and 5 (P5), whose serum antibody concentrations were lower than 10 mIU/ml after the first two vaccination and were higher than, or just below 1000 mIU/ml after the third dose. Group3 consisted of participants 1 (P1), 7 (P7), and 9 (P9), whose serum antibody concentrations were lower than 10 mIU/ml after the first two doses of vaccination and were lower than 300 mIU/ml after the third dose ().
Table 1. Clinical characteristics of enrolled participants
TCRβ and BCR IgH repertoire profiles
From each sample, we were able to isolate and sequence, on average, 5.15 × 10⁵ (2.25 × 10⁵–8.85 × 10⁵) CD4+ T cells, 32,474 (13,554–48,503) MB cells, 4,412 (2,157–6,288) NB cells and 917 (630–1,248) PCs (median and interquartile range). The total clean reads (4,405,090 from CD4+ T cells, 512,348 from MB cells, 150,926 from NB cells, and 89,444 from PCs) were obtained by NGS. Details of the TCR and BCR sequences are displayed in Supplementary Material Table S1.
Relative Ig isotypes amounts between B cell subsets
Considering the low ratio of IgD and IgE (less than 10% together), the IgA, IgG and IgM transcripts were amplified and sequenced in the current study.Citation9,Citation10 We found that the relative isotype amounts differed between B cell subsets. IgM transcripts were the most abundant in MB (52.1–55.4% of all reads) and NB (56.5–61.6%) cells while IgA transcripts were the most abundant in PCs (56.1–57.8%) at each time point (). We next tracked the changes in isotype distribution between T1 and T4 and noticed a significant decrease in relative IgM abundance and an increase in relative IgG abundance in MB cells, while IgM and IgG usage showed no significant difference in PCs and NB cells ().
Figure 1. Isotype usage of different B cell subsets. Relative amounts of isotypes at each time point (a, b) and changes in isotype distribution between T1 and T4 (c). ***p < .001; **p < .01; *p < .05. T1, right before vaccination; T2, 7 days following the first dose; T3, 7 days following the second dose; T4, 7 days following the third dose. MB, memory B cells; NB, naïve B cells; PC, plasma cells; IgA, IgA type B-cell receptor; IgG, IgG type B-cell receptor; IgM, IgM type B-cell receptor
Additionally, we analyzed the composition of Ig isotypes between the three participant groups at T1. In MB cells, IgG usage increased: Group1 (26.2%) > Group2 (25.6%) > Group3 (23.4%), and IgM usage decreased: Group1 (53.3%) < Group2 (53.7%) < Group3 (57.6%) (p < .05). This may suggest that individuals with a better antibody response possess more IgG MB cells and fewer IgM MB cells before vaccination.
Diversity changes in various cell subsets after vaccination
To determine the diversity of the immune repertoires, we calculated the normalized Shannon diversity index (NSDE), an index which is the normalized Shannon entropy by log2 (number of unique TCR/BCR clones) and represents the clonal nature of a sample irrespective of samples of different sequencing depth.Citation18 NSDE values range from 0 (least diverse) to 1 (most diverse). Diversity of different subsets changed during HB vaccination ( & S1). Notably, in MB cells, NSDE values decreased significantly at T4 while there was no significant difference between time points in NB cells or PCs (). These results indicate that clones might expand in MB cells after HB vaccination.
Figure 2. Diversity of BCR heavy chain repertoires during hepatitis B vaccination. (a) Dynamic changes in the diversity of MB cell repertoires in each participant. (b) Comparison of diversity between time points in different B cell subsets. (c) The correlation between CD4+ T and MB cell diversity changes. ***p < .001; *p < .05. NSDE, the normalized Shannon diversity index. P1, P2, P3, P4, P5, P6, P7, P8, and P9 represent participant 1, 2, 3, 4, 5, 6, 7, 8, and 9, respectively. T cell change represents diversity changes between each two time points in CD4+ T cells; B cell change represents diversity changes between each two time points in memory B cells (MB). T2-T1, T3-T2, T4-T2, T3-T1, T4-T1, and T4-T3 represent values of NSDE at latter time points minus that at earlier time points
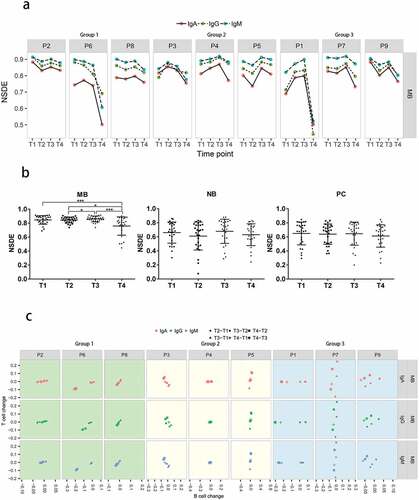
Correlations between the changes of diversity in CD4+ T and B cells
Next, we examined whether the dynamic changes in diversity in CD4+ T cells were correlated with those in B cell subsets. In both kinds of cells, changes were measured by subtracting the diversity value at the earlier time point from the value at the later time point (e.g., T2-T1). Then, the differences were normalized by the sum of the values at the two time points before and after, e.g., (T2-T1)/(T1+T2). Pearson correlation and p values were also calculated (). We found that there were strong positive correlations between CD4+ T and MB cells in all participants in Group1, who had fast and robust antibody responses. In contrast, this correlation was not observed in Group2 or Group3 ( & S2, ).
Table 2. Correlation between diversity changes of B cell subsets and CD4+ T cells
Lack of shared clones between individuals
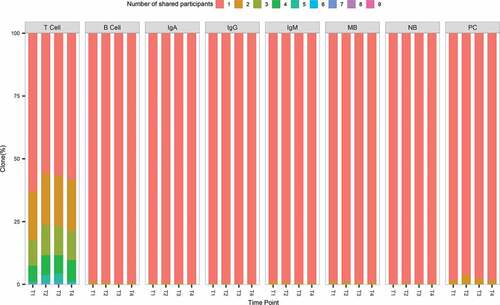
The overlap of immune repertoires between different individuals was investigated. We pooled together the immune repertoires of all participants from different subsets at different time points. Clones were annotated based on the number of individuals sharing the identical CDR3 aa sequence. Most clones were private in each subset repertoire and rare clones were shared between individuals ( & S3). Even though high level of anti-HBs was observed in every participant after the last dose vaccination, no identical BCR heavy chain CDR3 aa was shared by the nine individuals at the same time. Shared clones between participants displayed by circos are shown in Figure S6. We have distinguished participants in Group1/2/3 by different color tracks. In the result, distribution of shared clones among a wide range of frequencies and type switch between cell or Ig type was common. A better repertoire convergence among participants in the same group was not detected. Comparing with other time points, T4 show less shared clones in quantity.
Figure 3. Shared clones between individuals in different subsets. The number of participants sharing the clones is shown by color differences. T cell represents shared clones in CD4+ T cells repertoires. B cell represents shared clones in memory B cell, naïve B cell, or plasma cell repertoires; IgA, IgG, IgM represent shared clones in IgA, IgG, or IgM type B-cell receptor repertoires, respectively. MB, NB, PC represent shared clones in memory B cell, naïve B cell, and plasma cell repertoires, respectively
Shared clones between time points
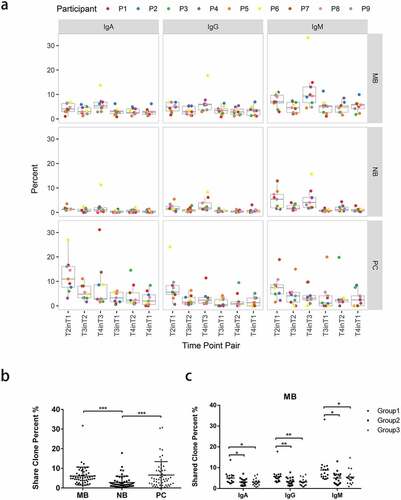
shows the results of overlapping TCRβ or BCR heavy chain CDR3 repertoires from each volunteer at different time points. The proportions of the common CDR3 aa sequences appearing in all time points were low, especially in B cell subsets. Most clones were only found at a single time point in all cell subsets, indicating the drastic change in immune repertoires before and after vaccination, or due to undersampling of cells.
Figure 4. Shared clones between two time points. (a) The percentage of share clones between two time points in different subsets. A time-point pair was composed by a later time point and a time point before it, e.g., “T2inT1”. The percentage of shared clones was computed by the number of shared clones between these two time points (T2 & T1) divided by the number of clones at the later time point (T2). (b) Boxplot results of percentages sorted by cell-type form (a). (c) Boxplot results of percentages sorted by isotypes form (a) and comparison between groups. Group1 consists of participants 2 (P2), 6 (P6), and 8 (P8), who had anti-HBs concentrations greater than 10 mIU/ml after the first vaccine dose and greater than 1000 mIU/ml after the third vaccine dose. Group2 consists of participants 3 (P3), 4 (P4), and 5 (P5), whose serum antibody concentrations were lower than 10 mIU/ml after the first 2 vaccine doses and were higher or just below 1000 mIU/ml after the third vaccine dose. Group3 consists of participants 1 (P1), 7 (P7), and 9 (P9), whose serum antibody concentrations were lower than 10 mIU/ml after the first 2 vaccine doses and were lower than 300 mIU/ml after the third vaccine dose. ***p < .001; **p < .01; *p < .05
Circos analysis was performed to display the shared clones between consecutive time points in each person (Figure S7). In the result, participants in each group line up in a row. Intuitively, the participants in Group1 have more connections in quantity. Clones existed in all of 4 time points (linked by black or gray lines) mainly occurred in MB cells.
The proportions of clones shared between two time points were relatively higher than those shared between more than two time points (Figure S4). Therefore, we calculated the percentages of clones sharing the same CDR3 aa sequence between time points in all B cell subsets from each individual (). More clones were shared between time points in MB and PCs than in NB cells (p < .001; ). There are more shared clones between T1 and T2 in PCs, probably due to a shorter period of sampling. In MB cells, individuals from Group1 had a higher proportion of shared clones between time points than did individuals from the other two groups ().
Higher percentages of shared clones between B cell subsets in Group1
To investigate the relationship between different B cell subsets, we calculated the percentages of clones sharing the same CDR3 aa sequence from each individual between each B cell subset pair at each time point. The proportions of clones sharing common CDR3 aa sequence between B cell subsets were rather low (Figure S5). However, we noticed that the proportions of NB in MB were significantly higher than those of NB in PC. Simultaneously, the proportions of PC in MB were significantly higher than those of PC in NB (). This indicated that NB cells shared more clones with MB cells than with PCs, and that PCs shared more clones with MB cells than with NB cells, suggesting differentiation from NB to MB cells and then to PCs. Additionally, we found that individuals in Group1 had higher proportions of MB in NB and PC in MB than did individuals in other groups ().
Figure 5. The percentages of clones sharing the same CDR3 amino acid sequence between each B cell subsets at the same time point (a, c) and at different time points (b, d). Percentages of shared clone at the same time point (a, c) or different time points (b, d) were summarized from Fig. S5 according to their time-point pair information, respectively. ***p < .001; **p < .01; *p < .05
To further test the B cell differentiation suggested above, we calculated the percentage of clones sharing the same CDR3 aa sequence between one B cell subset and another subset from earlier time points. The proportions of PC in MB were significantly higher than those of PC in NB (). This suggests that PCs shared more clones with MB cells than with NB cells from earlier time points. Meanwhile, individuals in Group1 had higher proportions of MB in NB and higher proportions of PC in MB than did individuals in Group 2 and 3 (). Therefore, we speculate that increased MB cells sharing with NB cells and PCs sharing with MB cells lead to a faster and stronger antibody response after HB vaccinations. The differentiation from NB to MB cells and then to PCs after vaccination positively affects antibody production.
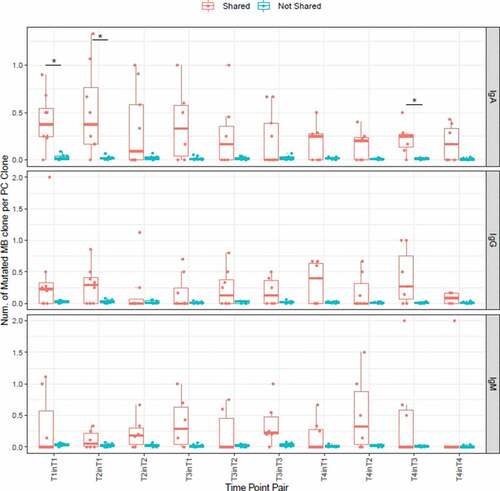
To further investigate whether clones in MB cells which developed into PC cells enduring more somatic mutation. PC clones are divided into two groups according to whether they were shared in MB cells. The MB mutated counterparts of every PC clone were identified by the following rule: Protein sequences with the same V and J assignment and with CDR3 region differed by no more than one amino acid, the identical shared clone in MB itself was not included. These MB clones were considered as somatic mutants of the PC clones. Then, in each group, how many somatic mutation counterparts in MBs could be found in one clone of PC on average was computed (). All the values of not-shared clones were very small, and in most subsets the medians of shared clones were larger than those of not-shared clones. In IgA, time-point pairs “T1inT1”, “T2inT1” and “T4inT3” showed statistical significance. The result suggested that clones in MBs that developed into PCs experienced stronger somatic mutations.
Figure 6. Numbers of mutated MB clone per one PC clone in shared and not-shared group. The shared group consists of PC clones shared in MB at the time point. On the x-axis, a time point pair is in the form of “Ta in Tb”, which indicates the sharing of PC clones at the time point of “Ta” and MB clones at the time point of “Tb”. * p < .05, Wilcoxon signed rank test
Discussion
Most studies have assessed the protective effect of the HB vaccine mainly through assessing the level of affinity and neutralizing capacity of anti-HBs. NGS has been able to assess the characteristics of the BCR and TCR repertoires. However, whether distinct antibody responses to the HB vaccine between different people could be revealed by immune repertoires remains unclear. By sequencing the TCRβ and BCR IgH repertoires of healthy volunteers before and after HB vaccination using NGS, we investigated the immune repertoire characteristics and dynamics, and assessed their correlations to gain a better understanding of what may affect the antibody response.
Previous studies have shown that IgM transcripts are the most abundant in total B cells from PBMCs. Moreover, the relative amount of IgM decreases while the proportion of IgG and IgA increases in PBMCs after vaccination.Citation9,Citation10 In the current study, we sorted out three B cell subsets (NB, MB, and PC) before and after each vaccination to investigate differences in Ig isotype distribution and dynamic repertoire changes in the different cell subsets. When all three B cell subsets were counted together, the ratio of IgM decreased while the relative amount of IgG increased at the T4 time point (data not shown). When each B cell subset was observed separately, we noticed the relative amount of IgM decreased and the proportion of IgG increased significantly in MB cells at the T4 time point compared with the observed levels at the T1 time point. This may be due to the clonal proliferation of antigen-specific MB cells after HB vaccination because IgG MB cells have a higher proliferation and plasma-cell differentiation capacity.Citation19,Citation20 We also noticed that IgA was the most abundant in PCs. Likewise, Laseron et al. found that although the relative amount of IgA was higher at the RNA level, the level of IgA antibody in serum was lower, possibly due to the faster clearance of IgA antibodies and the enrichment of IgA cells in mucosal tissues.Citation10 Another study also found that in antigen-specific B cells, the IgA production by PCs was higher than that of MB cells, and the ratio of IgG to IgA antibodies in serum was inconsistent with the observed RNA levels.Citation21 They reported that antigen-specific IgA antibodies were found when vaccines were administered by injection, suggesting that IgA antibodies might offer systemic immune protection different from that of IgG PCs.Citation21
Notably, anti-HB titers increased remarkably at T4 in all participants, while the diversity decreased significantly at T4 only in MB cells and not NB cells or PCs. In other words, increased anti-HBs levels associated with decreased in MB cell diversity resulted from clonal proliferation. Study on human immunodeficiency virus vaccines also suggested that the vaccination-induced IgH clones mostly derived from MB cells.Citation22 MB cells are long-lived even in the absence of antigen.Citation23 Therefore, proliferation of MB cells will form a solid immune memory to provide protection against HBV infection for ten or even 30 years after HB vaccination.Citation24,Citation25 We were surprised that decreased diversity was not significantly observed in PCs despite an obvious increase in anti-HBs levels in our study. Perhaps the majority of PCs in the peripheral blood were short-lived antibody-secreting cells differentiated from MB cells after antigen stimulation.Citation23 While long-lived PCs surviving in the bone marrow and the red-pulp of the spleen were hardly analyzed in this study.Citation26,Citation27
We found that few clones were shared between different individuals. Even though all nine participants in this study generated protective anti-HBs with high titers after three doses of immunization, very few B-cell clones were shared between them. The median proportion of clonotypes appearing in only one volunteer in MB cells, NB cells, and PCs were 99.1%, 99.6%, and 97.9%, respectively. Therefore, most of the clonotypes were unique to each individual. Moreover, common CDR3 aa sequences were mainly shared by only two volunteers. Sequences shared by more than three volunteers were very rarely observed. Similarly, results from previous studies showed that shared sequences between different participants were few, and that B cell libraries were mainly composed of private clones in the absence of any intervention.Citation12,Citation28 Ma et al. found that even after receiving common antigen stimulation, there were only a small number of CDR3 sequences shared by three volunteers. Identical IgG or IgM CDR3 aa sequences among the three volunteers was not found.Citation29 Simultaneously, comparing our BCR library sequences from the nine volunteers with previously published anti-HBs sequences did not reveal additional identical CDR3 aa sequence.Citation30 This is likely due to genetic background differences between individuals and the randomness of the antibody producing process after stimulation with the same antigen.
B cells responding to the first dose of HB vaccine were largely previously activated cross-reactive cells with low affinity for the vaccine, and higher affinity B cells were present following subsequent doses.Citation7 Our results demonstrated that among all nine volunteers, individuals in Group1 possessed the highest percentage of IgG and lowest percentage of IgM in their MB cells at T1. This suggests that MB cells from Group1 were more activated at the baseline and more likely to contain cross-reactive B cells responding to the first HB vaccine. Another possibility is that they have had HB vaccine or contacted with HBV previously because the high prevalence of HBV in China, though we confirmed that all participants are HBsAg and anti-HBs negative before vaccination.
To further investigate whether some other factors may be involved in antibody response to HB vaccination, we then analyzed the relationship between diversity change in CD4+ T and B cell subsets. We found strong positive correlations between CD4+ T and MB cells in all participants in Group1, who had fast and robust antibody responses. This correlation was not obvious in the other two groups. Not only can Th2 cells activate B cells and help their differentiation and proliferation, but B-cell activation can in turn influence the clonal expansion of lower-avidity T–cell clonotypes and clonotypically diversify the CD4+ T cell response.Citation31 Therefore, the individual with a stronger correlation between CD4+ T and MB cells may have a faster and more robust antibody response. Moreover, differences in human leukocyte antigen (HLA) class II alleles were associated with response to the HB vaccine.Citation32–34 As an antigen-binding molecule, HLA class II can meanwhile interact with CD4. Whether different HLA class II alleles lead to differences in the interaction between CD4+ T and MB cells and subsequently influence the response to HB vaccine is worth investigating.
Furthermore, when analyzing the immune repertoire overlap between different B cell subsets, we noticed that NB cells shared more clones with MB cells than with PCs, while PCs shared more clones with MB cells than with NB cells. Compared with the other two groups, individuals in Group1 possessed the highest proportions of shared clones between NB and MB cells and between PCs and MB cells. This suggests that NB cells prefer to differentiate to MB cells and then to PCs rather than directly to PCs. This is consistent with the results of diversity and isotype usage in different subsets discussed above. This differentiation trend is likely to improve the antibody response to the vaccine. The more MB cells sharing with NB cells and the more PCs sharing with MB cells, the faster and stronger the antibody response will be after HB vaccination. Whether the shared clones are vaccine specific and their affinity to the vaccine antigen require further study.
There are some limitations in the study. First, the number of participants in the study is small. Only 9 participants were recruited and all generated protective levels of anti-HBs after the third vaccination. They were further divided into three groups based on their speed of response to HB vaccine. The small number of participants in each group may increase the chance of the differences. Second, we are unable to confirm the vaccine specificity of shared or longitudinal dynamic clones due to the lack of sorting and pairing the heavy and light chains of the clones.
In this study, we identified the TCRβ and BCR heavy chain repertoires in nine healthy individuals before and after HB vaccination. Combined with serum antibody levels, we found that the baseline activation state of MB cells, interaction between CD4+ T and MB cells, and B cell differentiation may be critical factors in the formation of a humoral response to the HB vaccine. These findings will improve our understanding of evaluating the effect of the HB vaccine and other new vaccines in the future.
Disclosure of potential conflicts of interest
No potential conflicts of interest were disclosed.
Supplemental Material
Download ()Acknowledgments
We would like to thank the volunteers participating in the study, and Ms. Mingxia Zhang and Ms. Junhua Yin from Nanfang Hospital for vaccine inoculation and blood collection.
Supplementary material
Supplemental data for this article can be accessed on the publisher’s website at https://doi.org/10.1080/21645515.2021.1913028
Additional information
Funding
References
- Nutt SL, Hodgkin PD, Tarlinton DM, Corcoran LM. The generation of antibody-secreting plasma cells. Nat Rev Immunol. 2015;15:160–71. doi:10.1038/nri3795.
- Shlomchik MJ, Weisel F. Germinal center selection and the development of memory B and plasma cells. Immunol Rev. 2012;247:52–63. doi:10.1111/j.1600-065X.2012.01124.x.
- Glanville J, Zhai W, Berka J, Telman D, Huerta G, Mehta GR, Ni I, Mei L, Sundar PD, Day GMR, et al. Precise determination of the diversity of a combinatorial antibody library gives insight into the human immunoglobulin repertoire. Proc Natl Acad Sci U S A. 2009;106(48):20216–21. doi:10.1073/pnas.0909775106.
- Soto C, Bombardi RG, Branchizio A, Kose N, Matta P, Sevy AM, Sinkovits RS, Gilchuk P, Finn JA, Crowe JE, et al. High frequency of shared clonotypes in human B cell receptor repertoires. Nature. 2019;566:398–402. doi:10.1038/s41586-019-0934-8.
- Galson JD, Pollard AJ, Truck J, Kelly DF. Studying the antibody repertoire after vaccination: practical applications. Trends Immunol. 2014;35:319–31. doi:10.1016/j.it.2014.04.005.
- Cortina-Ceballos B, Godoy-Lozano EE, Tellez-Sosa J, Ovilla-Munoz M, Samano-Sanchez H, Aguilar-Salgado A, Gomez-Barreto RE, Valdovinos-Torres H, López-Martínez I, Aparicio-Antonio R, et al. Longitudinal analysis of the peripheral B cell repertoire reveals unique effects of immunization with a new influenza virus strain. Genome Med. 2015;7:124. doi:10.1186/s13073-015-0239-y.
- Galson JD, Truck J, Clutterbuck EA, Fowler A, Cerundolo V, Pollard AJ, Lunter G, Kelly DF. B-cell repertoire dynamics after sequential hepatitis B vaccination and evidence for cross-reactive B-cell activation. Genome Med. 2016;8:68. doi:10.1186/s13073-016-0322-z.
- Galson JD, Truck J, Fowler A, Clutterbuck EA, Munz M, Cerundolo V, Reinhard C, Van Der Most R, Pollard AJ, Lunter G, et al. Analysis of B cell repertoire dynamics following hepatitis B vaccination in humans, and enrichment of vaccine-specific antibody sequences. EBioMedicine. 2015;2:2070–79. doi:10.1016/j.ebiom.2015.11.034.
- Jiang N, He J, Weinstein JA, Penland L, Sasaki S, He XS, Dekker CL, Zheng NY, Huang M, Sullivan M, et al. Lineage structure of the human antibody repertoire in response to influenza vaccination. Sci Transl Med. 2013;5:119r–171r. doi:10.1126/scitranslmed.3004794.
- Laserson U, Vigneault F, Gadala-Maria D, Yaari G, Uduman M, Vander HJ, Kelton W, Taek Jung S, Liu Y, Laserson J, et al. High-resolution antibody dynamics of vaccine-induced immune responses. Proc Natl Acad Sci USA. 2014;111:4928–33. doi:10.1073/pnas.1323862111.
- Miyasaka A, Yoshida Y, Wang T, Takikawa Y. Next-generation sequencing analysis of the human T-cell and B-cell receptor repertoire diversity before and after hepatitis B vaccination. Hum Vaccin Immunother. 2019;15:2738–53. doi:10.1080/21645515.2019.1600987.
- Vollmers C, Sit RV, Weinstein JA, Dekker CL, Quake SR. Genetic measurement of memory B-cell recall using antibody repertoire sequencing. Proc Natl Acad Sci U S A. 2013;110:13463–68. doi:10.1073/pnas.1312146110.
- Xu Y, Liu Y, Zhao M, Chen Y, Xie C, Gong M, Deng H, Li X, Sun J, Hou J, et al. Dynamic perturbations of CD4 and CD8 T cell receptor repertoires in chronic hepatitis B patients upon oral antiviral therapy. Front Immunol. 2017;8:1142. doi:10.3389/fimmu.2017.01142.
- Mamedov IZ, Britanova OV, Zvyagin IV, Turchaninova MA, Bolotin DA, Putintseva EV, Lebedev YB, Chudakov DM. Preparing unbiased T-cell receptor and antibody cDNA libraries for the deep next generation sequencing profiling. Front Immunol. 2013;4:456. doi:10.3389/fimmu.2013.00456.
- Chen Y, Xu Y, Zhao M, Liu Y, Gong M, Xie C, Wu H, Wang Z. High-throughput T cell receptor sequencing reveals distinct repertoires between tumor and adjacent non-tumor tissues in HBV-associated HCC. Oncoimmunology. 2016;5(10):e1219010. doi:10.1080/2162402X.2016.1219010.
- Bolotin DA, Poslavsky S, Mitrophanov I, Shugay M, Mamedov IZ, Putintseva EV, Chudakov DM. MiXCR: software for comprehensive adaptive immunity profiling. Nat Methods. 2015;12:380–81. doi:10.1038/nmeth.3364.
- Krzywinski M, Schein J, Birol I, Connors J, Gascoyne R, Horsman D, Jones SJ, Marra MA. Circos: an information aesthetic for comparative genomics. Genome Res. 2009;19:1639–45. doi:10.1101/gr.092759.109.
- Sherwood AM, Emerson RO, Scherer D, Habermann N, Buck K, Staffa J, Desmarais C, Halama N, Jaeger D, Schirmacher P, et al. Tumor-infiltrating lymphocytes in colorectal tumors display a diversity of T cell receptor sequences that differ from the T cells in adjacent mucosal tissue. Cancer Immunol Immunother. 2013;62:1453–61. doi:10.1007/s00262-013-1446-2.
- Surova E, Jumaa H. The role of BCR isotype in B-cell development and activation. Adv Immunol. 2014;123:101–39.
- Kometani K, Nakagawa R, Shinnakasu R, Kaji T, Rybouchkin A, Moriyama S, Furukawa K, Koseki H, Takemori T, Kurosaki T, et al. Repression of the transcription factor Bach2 contributes to predisposition of IgG1 memory B cells toward plasma cell differentiation. Immunity. 2013;39:136–47. doi:10.1016/j.immuni.2013.06.011.
- Giesecke C, Meyer T, Durek P, Maul J, Preiss J, Jacobs J, Thiel A, Radbruch A, Ullrich R, Dörner T, et al. Simultaneous presence of non- and highly mutated Keyhole Limpet Hemocyanin (KLH)-specific plasmablasts early after primary KLH immunization suggests cross-reactive memory B cell activation. J Immunol. 2018;200:3981–92. doi:10.4049/jimmunol.1701728.
- Wang L, Zhang W, Lin L, Li X, Saksena NK, Wu J, Wang S, Joyce JG, Zhang X, Yang H, et al. A comprehensive analysis of the T and B lymphocytes repertoire shaped by HIV vaccines. Front Immunol. 2018;9:2194. doi:10.3389/fimmu.2018.02194.
- Ochsenbein AF, Pinschewer DD, Sierro S, Horvath E, Hengartner H, Zinkernagel RM. Protective long-term antibody memory by antigen-driven and T help-dependent differentiation of long-lived memory B cells to short-lived plasma cells independent of secondary lymphoid organs. Proc Natl Acad Sci U S A. 2000;97:13263–68. doi:10.1073/pnas.230417497.
- Bruce MG, Bruden D, Hurlburt D, Zanis C, Thompson G, Rea L, Toomey M, Townshend-Bulson L, Rudolph K, Bulkow L, et al. Antibody levels and protection after hepatitis B vaccine: results of a 30-year follow-up study and response to a booster dose. J Infect Dis. 2016;214:16–22. doi:10.1093/infdis/jiv748.
- Zanetti AR, Mariano A, Romano L, D’Amelio R, Chironna M, Coppola RC, Cuccia M, Mangione R, Marrone F, Negrone FS, et al. Long-term immunogenicity of hepatitis B vaccination and policy for booster: an Italian multicentre study. Lancet. 2005;366:1379–84. doi:10.1016/S0140-6736(05)67568-X.
- Manz RA, Hauser AE, Hiepe F, Radbruch A. Maintenance of serum antibody levels. Annu Rev Immunol. 2005;23:367–86. doi:10.1146/annurev.immunol.23.021704.115723.
- Fairfax KA, Kallies A, Nutt SL, Tarlinton DM. Plasma cell development: from B-cell subsets to long-term survival niches. Semin Immunol. 2008;20:49–58. doi:10.1016/j.smim.2007.12.002.
- Galson JD, Truck J, Fowler A, Munz M, Cerundolo V, Pollard AJ, Lunter G, Kelly DF. In-depth assessment of within-individual and inter-individual variation in the B cell receptor repertoire. Front Immunol. 2015;6:531. doi:10.3389/fimmu.2015.00531.
- Ma L, Wang X, Bi X, Yang J, Shi B, He X, Ma R, Ma Q, Yao X. Characteristics peripheral blood IgG and IgM heavy chain complementarity determining region 3 repertoire before and after immunization with recombinant HBV vaccine. PLoS One. 2017;12:e170479.
- Tajiri K, Ozawa T, Jin A, Tokimitsu Y, Minemura M, Kishi H, Sugiyama T, Muraguchi A. Analysis of the epitope and neutralizing capacity of human monoclonal antibodies induced by hepatitis B vaccine. Antiviral Res. 2010;87:40–49. doi:10.1016/j.antiviral.2010.04.006.
- Merkenschlager J, Ploquin MJ, Eksmond U, Andargachew R, Thorborn G, Filby A, Pepper M, Evavold B, Kassiotis G. Stepwise B-cell-dependent expansion of T helper clonotypes diversifies the T-cell response. Nat Commun. 2016;7:10281. doi:10.1038/ncomms10281.
- Vidan-Jeras B, Brinovec V, Jurca B, Stezinar SL, Jeras M, Bohinjec M. The contribution of HLA-Class II antigens in humoral non-response and delayed response to HBsAg vaccination. Pflugers Arch. 2000;440:R188–R189. doi:10.1007/s004240000059.
- Sakai A, Noguchi E, Fukushima T, Tagawa M, Iwabuchi A, Kita M, Kakisaka K, Miyasaka A, Takikawa Y, Sumazaki R, et al. Identification of amino acids in antigen-binding site of class II HLA proteins independently associated with hepatitis B vaccine response. Vaccine. 2017;35:703–10. doi:10.1016/j.vaccine.2016.08.068.
- Nishida N, Sugiyama M, Sawai H, Nishina S, Sakai A, Ohashi J, Khor SS, Kakisaka K, Tsuchiura T, Hino K, et al. Key HLA-DRB1-DQB1 haplotypes and role of the BTNL2 gene for response to a hepatitis B vaccine. Hepatology. 2018;68:848–58. doi:10.1002/hep.29876.