
ABSTRACT
The next big step in combating the COVID-19 pandemic will be gaining widespread acceptance of a vaccination campaign for SARS-CoV-2. This study aims to report detailed Spatiotemporal analysis and result-oriented storytelling of the COVID-19 vaccination campaign across the globe. An exploratory data analysis (EDA) with interactive data visualization using various python libraries was conducted. The results show that, globally, with the rapid vaccine development and distribution, people from the different regions are also getting vaccinated and revealing their positive intent toward the COVID-19 vaccination. The outcomes of this exploration also established that mass vaccination campaigns in populated countries including Brazil, China, India, and the US reduced the number of daily COVID-19 deaths and confirmed cases. Overall, our findings contribute to current policy-relevant research by establishing a link between increasing immunization rates and lowering COVID-19’s rising curve.
1. Introduction
Over the history of humankind, vaccine played a crucial role to overcome epidemic situations. Starting with deliberate variolation back in the 10th century to our modern third-generation (RNA vaccines and DNA vaccines)Citation1,Citation2 vaccination helped us to fight back against deadly viruses and sustain the human race. Since SARS-CoV-2 is a highly contagious virus that affects populations all over the world, vaccines are the most important public health measure and the most effective strategy for protecting the population from COVID-19.Citation3 Beginning in a fish market in Wuhan, Hubei Province, China, in December 2019, a novel coronavirus (SARS-CoV-2) spread around the world, causing COVID-19 disease in millions of peopleCitation4 and turned out as a pandemic on March 11, 2020, for the sixth time in history, due to its high human-to-human transmission rate based on the report provided by World Health Organization (WHO).Citation5 According to the statistics of worldometers.info, more than 259 million people had been infected as of November 25, 2021, with 5.19 million deaths and 19.675 million active cases. The race to develop COVID19 vaccines to combat the disease’s spread and disastrous consequences is still on, and new, more effective vaccines are likely to emerge as the pandemic progresses.Citation6,Citation7 Several vaccines to prevent COVID-19 infection were approved until November 2021, and more than 326 COVID-19 vaccine candidates were being produced.Citation8,Citation9 The WHO has identified 132 vaccine candidates that are currently being tested in clinical trials and another 194 vaccines are in pre-clinical development till 23 November 2021.Citation10 The first step in developing a vaccine for any virus is to determine its genetic sequence. However, previously, on December 31, 2019, the World Health Organization issued a warning about a new coronavirus strain that is affecting people in China.Citation11 Later, officials from the China confirmed the identification of a new type of coronavirus infecting human bodies and the first genetic sequence for SARS-CoV-2 was released on January 11, 2020. Non-pharmaceutical interventions are used to minimize transmission and the burden of coronavirus disease 2019 (COVID-19) in the absence of safe and highly efficient vaccines and treatment options, but most of these interventions have high economic costs.Citation12 To reduce the substantial burden of COVID-19 morbidity and mortality, effective COVID-19 vaccines are desperately needed. Vaccine development is a lengthy process that necessitates numerous testing phases to ensure adequate safety and immunogenicity in a variety of people (i.e., different ages, medical conditions, severity of attack, geographic location etc.). According to the National Center for Biotechnology Information (NCBI), a vaccine must go through four stages of clinical trials before receiving a license to produce it, which can take up to a decade. However, due to the urgent pandemic situation around the world, the COVID-19 vaccine development process was shortened to 12–18 months while retaining safety and effectiveness standards. A number of factors, including a monumental breakthrough in biotechnology and molecular biology, as well as a collaboration between government and private research institutes, enables the extreme compression of the COVID-19 vaccine development process. The pandemic’s humanitarian and economic consequences are guiding the growth of next-generation vaccine technology platforms around the world. As a result of the COVID-19 vaccine’s production being accelerated, the first candidate entered human clinical trials with unparalleled speed on March 16, 2020.Citation13 As of November 24, 2021, there are 332 COVID-19 treatment (drug medicine) methods in trials, and 272 vaccines are in progress, with 98 in various stages of clinical testing.Citation10,Citation14 Until November 25, 2021, 218 countries from a different region of the world using vaccine from 22 different manufacturers (4 authorized and 18 with emergency use permission) to vaccinate their citizens. summarizes the various stages of vaccine development process.
Table 1. Phases of vaccine development and descriptions of each.Citation15
To the best of our knowledge, no previously published work has focused on the progress on COVID-19 vaccination worldwide with the support of interactive Exploratory Data Analysis (EDA) and visualizations. The present study aims to evaluate the global participation of citizens by analyzing and highlighting different characteristics toward successful vaccination. The primary objective of this exploration is to answers different query regarding the current state of vaccination to understand the ongoing safe vaccination program around the globe. People’s experience, attitudes, and perceptions about COVID-19 vaccinations are critical for Government and policymakers to address all obstacles to vaccine distribution in this scenario. Secondly, the initial response of vaccination in plateauing the COVID curve. Furthermore, to add a positive view to inspire and give courage to the misinformed population around the world who are reluctant to be vaccinated.
2. Materials and methods
This section discusses the different materials that we employed to build our methods. In this research, we have used the COVID-19 World Vaccination Progress datasetCitation16 available at Kaggle that tracks the Daily and Total Vaccination for COVID-19 in the World. However, COVID-19 World Vaccination Progress datasets is collected, merged, and updated regularly from Our World in Data GitHub repository (https://github.com/owid/covid-19-data). Following highlights the contents (data type, column name, and data description) of COVID-19 World Vaccination Progress Dataset. The dataset contains 15 different columns (9 decimal, 3 string, 1 country, and 2 other types of data) to track the progress of global vaccination of COVID-19 around the world. This exploration also utilized another dataset (Population by Country – 2020), available at Kaggle inherited from the worldometers.info.Citation17 This dataset contains the information of 235 countries along with their population and there are 11 columns each representing different features of countries.
Table 2. Dataset details to keep track of COVID-19 vaccination rates around the world on a daily and total basis
2.1. Data preparation and cleaning
One of the important properties of EDA before finding the insight from the data is to clean and prepare the data according to the requirements. Therefore, data cleaning is the most important step toward an effective data analysis. In our case, the dataset contains few “NaN” (not a number) values, some empty rows (having value 0), along with some redundant columns. By using and configuring the function of df.drop from pandas library, we changed “NaN” values to 0 and removed the entire row as per our requirements. Furthermore, to replace null values in DataFrame pandas this exploration utilized the DataFrame.fillna() Application Programming Interface (API). Specifically, fillna() method is used to replace the NULL values with a specified values. The structure of the fillna() method can be expressed as DataFrame.fillna(value = scalar, dict, series, or DataFrame, method = {‘backfill,’ ‘bfill,’ ‘pad,’ ‘ffill,’ or None}, axis = 0 or 1, inplace = bool, limit = int, downcast = dict).
2.2. Data visualization and analysis
We analyzed our datasets with different Exploratory Data Analysis (EDA)Citation18 methods and visualize those outcome to provide analysis of different ongoing vaccination programs around the globe. For data ingestion, visualization, and analysis purpose we initialized different python packages including NumPy (https://numpy.org/), Pandas (https://pandas.pydata.org/), Matplotlib (https://matplotlib.org/), Seaborn (https://seaborn.pydata.org/), and Plotly (https://plotly.com/). Mostly, we have used Seaborn for data visualization.
3. Results
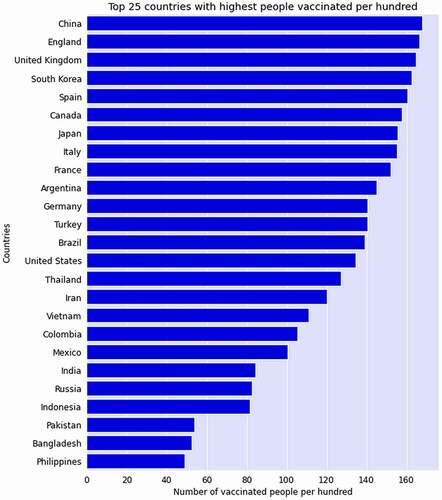
This study analyzed the COVID-19 World Vaccination Progress dataset to convey the analysis of different ongoing vaccination programs around the globe. In this section, the data analysis results and visualization will be described to find the answers to different query of this research including a) Finding out those countries who started vaccinating their citizens fastest, b) Those countries who have vaccinated the highest number of people, c) Different categories of offered vaccines, d) Name of the vaccines used by various countries, e) Finding daily vaccination trend of most vaccine used countries, and f) Vaccine impact analysis on new confirmed and death cases. To achieve the objectives of this research, we have followed variety of data analysis and visualizations approach to highlight the results. Following represents the top 25 countries in the world who have started fastest vaccination to their people. Based on the bar chart until 25 November 2021, China leads the trend by vaccinating more than 165 per 100 people followed by the England that vaccinated almost 162 people per 100. On other hand, United Kingdom (UK), South Korea, and Spain ensured more than 150 people’s vaccination per 100 for their populations.
Figure 1. With more than 160 doses ensured for every 100 people, China clearly leads the world in terms of number of doses per head of population, as seen in the bar as of 25 November 2021.
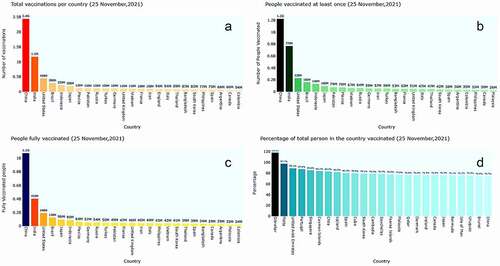
Until 25 November, 2021 different scenarios of worldwide vaccination progress have been visualized in . Individual countrywide total vaccination, number of people who took vaccination for at least once, people who completed their double dose of vaccination and based on the population percentage of countrywide vaccination are highlighted here. However, we have highlighted only top 25 countries for the better understandings of the entire scenario for each case.
Figure 2. The bar plot visualization depicts different scenario of vaccination progress. 2(A) indicates that China ensured almost 2.5B vaccinations for their people followed by India with almost 2.3B until 21 November 2021. Those countries with individuals who have taken the vaccine for at least once are depicted in 2(B). Surprisingly peoples of South Asian country, India have already administrated 770 M vaccine doses and placed itself in the second position after the China (1.2 G). Successful countries those have managed to provide a complete dose (2 doses in case of two-dose regimens) for their people are illustrated in 2(C). With more than 1B complete doses of vaccine, China covered almost 87.9% of its total populations under fully vaccinated countries from December 15, 2020 to November 21, 2021. Again, based on total population, 2(D) confirms that Gibraltar, Israel, and United Arab Emirates vaccinated 118.2%, 97.7% and 89.1% of their people respectively until 25 November 2021.
Two hundred and twenty-three (223) countries utilizing 75 different vaccines combinations based on various region all over the globe. A Seaborn bar plot representation highlights all the available vaccine used in per 10 million until 25 November 2021 worldwide. shows that, Combinations of Sinopharm and Sinovac tops the list of most-used COVID-19 vaccines in the world, followed by Covaxin, and Oxford–AstraZeneca. Moderna, Pfizer/BioNTech, and Johnson & Johnson are mostly used by the USA whereas China mostly depends on the Sinovac vaccine and India offered Covaxin, Covishield for vaccinating its citizens.
Figure 3. Sinopharm and Sinovac invented by the China tops the list of most-used COVID-19 vaccines in the world, followed by Moderna, Pfizer/BioNTech, and Oxford–AstraZeneca until 25 November 2021.
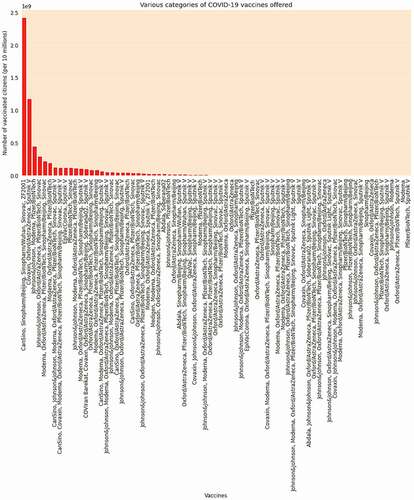
United States mostly used Johnson & Johnson, Moderna, Pfizer/BioNTech vaccine whereas Canada ensured Moderna, Oxford/AstraZeneca, Pfizer/BioNTech in the North American Region. Furthermore, to provide an insight of Top 20 countries based on highest number of vaccines used, is designed based on the map to highlight the countries and their use of different vaccine for their citizens.
Table 3. Top 20 countries and their usages of different vaccine for their citizen based on highest number of vaccines used for their citizens. Serial Number indicating the position of each country on their usages of total number of vaccines
To highlight the most and least vaccinated countries and vaccine usages, we further visualize that data in . Graphics library of Plotly offers Sunburst plots (px.sunburst) that visualize the hierarchical data spanning outwards radially from root to leaves. Based on the ED analysis and visualization it confirms that the China mostly uses Sinopharm, Sinovac and others vaccine with a rate of almost 88% (total vaccination = 2456617000, considering two doses) in terms of total vaccinations until 25 November 2021. On the other hand, India and USA are in next position respectively in the category of most vaccinated countries with a total vaccination of 7.81B (42.7% of population fully vaccinated) and 454 M (59.1% of population fully vaccinated).
Figure 4. Sunburst plot representation of most and least vaccinated used countries and their used vaccine. 4(A) shows the highest number of vaccines utilized countries along with the group of vaccine and 4(B) visualize the least vaccine used countries with their vaccine group utilizations.
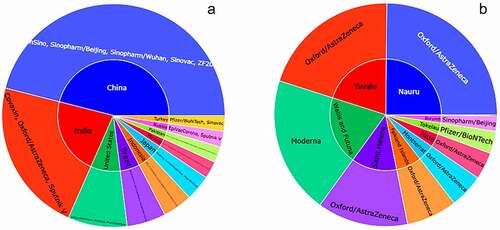
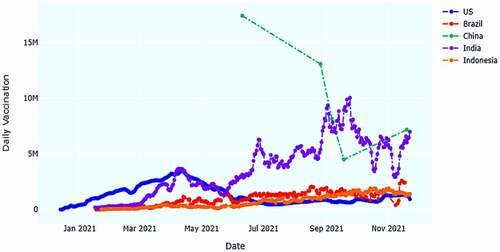
However, for the countries that less vaccinated, Burundi only used the 1329 doses of Sinopharm/Beijing vaccine with total vaccination rate of less than 0.1% until 25 November 2021. Tokelau and Niue remain in next position with a total vaccine doses of 1936 Pfizer/BioNTech and 2532 Oxford/AstraZeneca. Daily vaccinations is another important factor to assess the perception of people’s attitude toward successful vaccination.Citation19 As a result, using data from the most vaccinated countries, we compiled a list of five (5) of the most vaccinated countries’ regular patterns from the start of vaccinations to the present (). United States, Brazil, China, India, and Indonesia ensured highest number of vaccinations in their country.
Figure 5. United States, Brazil, China, India and Indonesia have vaccinated most people until now (25 November 2021). Here, we have highlighted the daily vaccination trend for those countries. China leading the trend by vaccinating with almost 7.170 million peoples whereas Indonesia shows a downward curve by vaccinating 1.401 M peoples exactly.
4. Discussion
This section will discuss on the findings of this exploration in a broader way. contains details about vaccine categories and their current development stage. As of November 25, 2021, 223 (223) countries from different region of the world using vaccine from 22 different manufacturers (4 authorized and 18 with emergency use permission) to vaccinate their citizens.Citation20
Table 4. Variety of approaches among COVID-19 vaccine candidates until 24 November 2021
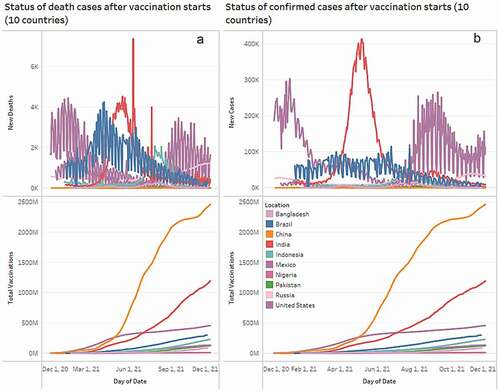
Based on the results analysis and visualization many countries around the globe started applying vaccine to their citizens by the end of 2020. Based on the vaccination rate over the last one year from December 2020 to November 2021, China leads the trend by applying highest numbers of vaccines to its citizen. It is because of its global importance toward vaccination campaign with a centralized national system of government, and well-developed infrastructure for implementing prompt responses to large-scale national emergencies. Until 25 November 2021, China has the most vaccinated people (fully vaccinated) of around 1.1 G of its total population followed by India (410 M) and the US (190 M). As these are developed countries and they produce vaccine in their own lab also distribute those following their own policy; therefore, the accessibility of the vaccine is easier to its public. This research also discovered that until 25 November 2021, 53.9% of the world population has received at least one dose of a COVID-19 vaccine. At this moment, 7.85 billion doses have been administered globally, and 29.06 million are now administered each day and only 5.6% of people in low-income countries have received at least one dose of COVID-19 Vaccine. The impact of using vaccine on specific countries to reduce the spread of COVID-19, therefore, we further investigate the confirmed and death cases for the China, India, US, Brazil, Indonesia, Pakistan, Nigeria, Bangladesh, Russia, and Mexico after their vaccination campaign starts. presents the status of confirmed and death cases of Ten (10) most populated countries around the globe till 25 November 2021. Based on the findings, it is evident that the confirmed trend of India raised until May 6, 2021 and then gradually it decreases in passage of time. Also, the US experienced a sudden spike in confirmed cases in between August and September 2021. However, other countries have maintained an almost linear status in their confirmed cases but in Brazil, there was a sudden increase of number of COVID-19 cases on 23 June and July 23, 2021. On the other hand, other than India, Brazil, and US all other countries maintained a descending trend in their death cases. However, India experienced a catastrophic situation in controlling their COVID-19 death cases and reported almost 7500 death cases in a single day on June 10, 2021. After July 20, 2021, with the support of a mass vaccination campaign, India managed to slow down the death rate for its citizens. The US and Brazil started its vaccination campaign on 18 December and January 18, 2021, respectively, and still both the country is fighting to minimize the death cases. On 24 November 2021, the US experienced around 1650 deaths on a single day whereas Brazil managed to slow down its death rate till 15 November 2021. Surprisingly, it experienced a sudden increase in a single day with 373 death cases on 17 November 2021. Overall, different vaccines have been proved effective against COVID-19 around the world and with the maintain of proper health regulation it may possible to reduce both the confirmed and death cases.
Figure 6. Confirmed and death cases analysis of Ten populated countries after its vaccination starts. 6(A) shows the death cases of each country until 25 November 2021 whereas 6(B) highlighting the confirmed cases to analyze the global COVID-19 vaccination program.
This analysis also emphasized on the different vaccine production and their used in different context. Therefore, following is designed to provide an insight about each vaccine that is widely used and popular.
Table 5. Wide categories of COVID-19 vaccines that are currently (25 November 2021) in use according to their type and phase
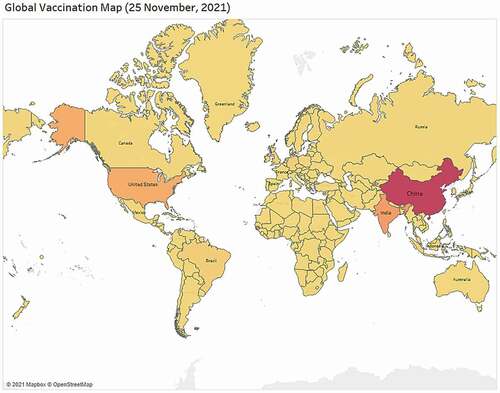
Based on the vaccination data available along with the support of Open Street Map and Map box countrywide map visualization is shown in . The map is designed to provide insights of how different region and countries are ensuring vaccine for their populations. However, this map only highlights those regions that are currently offering vaccine. Surprisingly, few countries from the region of central Africa are still unable to ensure safe vaccine for their citizens. As of 28 November 2021, 7.9B vaccine doses have been administered globally and 27 M are administrated each day. Surprisingly, As of 18 November 2021, only 0.42 M vaccine doses have been administered in the central African region and till now only around 321 K peoples have fully vaccinated in that region.
Figure 7. Worldwide vaccination map visualization based on highest number of doses offered by the country.
Until 25 November 2021, globally 223 countries are adopted 75 different vaccines for its population. Among them, some of the countries are using multiple vaccine for different categories of population according to their requirements. This research has unfolded the insights of vaccination program all over the world with data analysis and visualization. In addition, this study tries to answers few questions regarding current status of different vaccine used in different region of the world. According to data analysis, Sinopharm, Moderna, Pfizer/BioNTech, Oxford/AstraZeneca, Sinovac, Covaxin, and Covishield are the most popular vaccine used worldwide for mass vaccination, since all the vaccine has almost negligible side effects (known until 25 November 2021). This is quite pleasing that people from all the parts of the world are educating themselves and willingly taking the vaccines. In addition, scientist, public health experts, WHO, medical experts have claimed that these vaccines are effective against COVID-19 and that have already proven (25 November 2021). A comparison has been further established based on the similar studies shown in that focused on the global COVID-19 vaccination campaign, challenges, development, distribution, country-wise progress, knowledge and people’s perception toward it in between 2020 and 2021. This review work examines the global trend in COVID-19 immunization progress from December 2020 to November 2021, based on available data. A detailed data analysis has been presented with the help of Python modules. This investigation also discovered a link between COVID-19 confirmed and fatality cases, as well as immunization initiatives in several nations.
Table 6. Comparison of similar studies that focused on the global COVID-19 vaccination campaign, challenges, development, distribution, country wise progress, knowledge, and people’s perception
There are some limitations that should be considered when interpreting the results of this study. Firstly, because this study is based on certain time-oriented information, the trend of the research findings may change with time. Secondly, based on population and COVID cases, this study attempted to unravel the global features of the COVID-19 immunization effort in several countries. As a result, it did not reflect the whole scenarios of other parts of the world with mid-level and tiny populations. Apart from analyzing the findings, this study motivates a large number of people all over the world to take the vaccine and unite under one umbrella. If the vaccination rate continues to rise, all countries will be able to vaccinate their citizens by the end of the year 2022.
5. Conclusion
The COVID-19 pandemic is still wreaking havoc on human lives around the world, but the COVID-19 vaccine offers a ray of hope for the future. The global response to the COVID-19 pandemic is likely to rely heavily on vaccine deployment. The present study revealed that globally there is a significant turnaround in people’s perception toward vaccination and thus different countries are ensuring mass vaccination for their citizens. The findings also suggests that, rate of vaccination among global population is increasing day by day and as such, unvaccinated peoples around the globe gets more motivated and encouraged to take vaccine in upcoming days. Although vaccines are still unavailable in some parts of the world for various reasons, we believe policymakers should take steps to ensure sufficient knowledge, positive attitudes, and perceptions of COVID-19 vaccinations in order to decrease vaccine hesitancy.
Author contribution
All authors conceptualized and designed the study. SKD and MR had the idea for and designed the study and had full access to all the data in the study and take the responsibility for the exploratory data analysis with their visualization. URS, AH, and AQ contributed to the writing of the article. MR and AQ contributed to the critical revision of the report. All the visualization and data presentation methods developed by SKD, MR, and AT. All authors contributed to data acquisition, data analysis, and reviewed and approved the final version.
Disclosure statement
No potential conflict of interest was reported by the author(s).
Data availability statement
The data that support the findings of this study are available from the corresponding author, upon reasonable request.
Additional information
Funding
References
- Alarcon JB, Waine GW, McManus DP. DNA vaccines: technology and application as anti-parasite and anti-microbial agents. In: Baker JR, Muller R, and Rollinson D, editors. Advances in parasitology. Vol. 42. Cambridge (MA): Academic Press; 1999. p. 343–10.
- Robinson HL, Pertmer TM. DNA vaccines for viral infections: basic studies and applications. In: K. Maramorosch K, Murphy FA, and Shatkin AJ, editors. Advances in virus research. Vol. 55. Cambridge (MA): Academic Press; 2000. p. 1–74.
- Sunohara S, Asakura T, Kimura T, Ozawa S, Oshima S, Yamauchi D, Tamakoshi A. Effective vaccine allocation strategies, balancing economy with infection control against COVID-19 in Japan. PLOS ONE. 2021;16:e0257107. doi:10.1371/journal.pone.0257107.
- Mackenzie JS, Smith DW, Mackenzie JS, Smith DW. COVID-19: a novel zoonotic disease caused by a coronavirus from China: what we know and what we don’t. Microbiol Aust. 2020;41:45–50. doi:10.1071/MA20013.
- Sohrabi C, Alsafi Z, O’Neill N, Khan M, Kerwan A, Al-Jabir A, Iosifidis C, Agha R. World Health Organization declares global emergency: a review of the 2019 novel coronavirus (COVID-19). Int J Surg Open. 2020;76:71–76. doi:10.1016/j.ijsu.2020.02.034.
- Chan E-Y-Y, Cheng CK-Y, Tam GC-H, Huang Z, Lee PY. Willingness of future A/H7N9 influenza vaccine uptake: a cross-sectional study of Hong Kong community. Vaccine. 2015;33:4737–40. doi:10.1016/j.vaccine.2015.07.046.
- Wibawa T. COVID-19 vaccine research and development: ethical issues. Trop Med Int Health. 2021;26:14–19. doi:10.1111/tmi.13503.
- CDC. Different COVID-19 Vaccines. Centers for Disease Control and Prevention; 2021. https://www.cdc.gov/coronavirus/2019-ncov/vaccines/different-vaccines.html.
- COVID-19 vaccines. https://www.who.int/emergencies/diseases/novel-coronavirus-2019/covid-19-vaccines.
- Draft landscape and tracker of COVID-19 candidate vaccines. https://www.who.int/publications/m/item/draft-landscape-of-covid-19-candidate-vaccines.
- Zhu H, Wei L, Niu P. The novel coronavirus outbreak in Wuhan, China. Global Health Res Policy. 2020;5:6. doi:10.1186/s41256-020-00135-6.
- Li Z, Chen Q, Feng L, Rodewald L, Xia Y, Yu H, Zhang R, An Z, Yin W, Chen W, et al. Active case finding with case management: the key to tackling the COVID-19 pandemic. Lancet. 2020;396:63–70. doi:10.1016/S0140-6736(20)31278-2.
- Le TT, Cramer JP, Chen R, Mayhew S. The COVID-19 vaccine development landscape. Nat Rev Drug Discov. 2020;19:305–06. doi:10.1038/d41573-020-00151-8.
- Mainoli B, Machado T, Duarte GS, Prada L, Gonçalves N, Ferreira JJ, Costa J. Analysis of clinical and methodological characteristics of early COVID-19 treatment clinical trials: so much work, so many lost opportunities. BMC Med Res Methodol. 2021;21:42. doi:10.1186/s12874-021-01233-w.
- Deutsche Welle. COVID-19 vaccine development: what’s the progress? | DW | 11.03.2021. DW.COM. https://www.dw.com/en/covid-19-vaccine-development-whats-the-progress/a-55648707.
- COVID-19 world vaccination progress. https://kaggle.com/gpreda/covid-world-vaccination-progress.
- Population by Country - 2020. https://kaggle.com/tanuprabhu/population-by-country-2020.
- Dey SK, Rahman MM, Siddiqi UR, Howlader A. Analyzing the epidemiological outbreak of COVID-19: a visual exploratory data analysis approach. J Med Virol. 2020;92:632–38. doi:10.1002/jmv.25743.
- Islam S Md., Siddique AB, Akter R, Tasnim R, Sujan MSH, Ward PR, Sikder MT. Knowledge, attitudes and perceptions towards COVID-19 vaccinations: a cross-sectional community survey in Bangladesh. BMC Public Health. 2021;21:1851. doi:10.1186/s12889-021-11880-9.
- Authorized vaccines. https://www.covid-19vaccinetracker.org/authorized-vaccines.
- Huang H-Y, Wang S-H, Tang Y, Sheng W, Zuo C-J, Wu D-W, Fang H, Du Q, Li N. Landscape and progress of global COVID-19 vaccine development. Hum Vaccin Immunother. 2021;17:3276–80. doi:10.1080/21645515.2021.1945901.
- Buchy P, Buisson Y, Cintra O, Dwyer DE, Nissen M, Ortiz de Lejarazu R, Petersen E. COVID-19 pandemic: lessons learned from more than a century of pandemics and current vaccine development for pandemic control. Int J Infect Dis. 2021;112:300–17. doi:10.1016/j.ijid.2021.09.045.
- ElBagoury M, Tolba MM, Nasser HA, Jabbar A, Elagouz AM, Aktham Y, Hutchinson A. The find of COVID-19 vaccine: challenges and opportunities. J Infect Public Health. 2021;14:389–416. doi:10.1016/j.jiph.2020.12.025.
- Calina D, Docea A, Petrakis D, Egorov A, Ishmukhametov A, Gabibov A, Shtilman M, Kostoff R, Carvalho F, Vinceti M, et al. Towards effective COVID‑19 vaccines: updates, perspectives and challenges (Review). Int J Mol Med. 2020;46(1):3–16. doi:10.3892/ijmm.2020.4596.
- Kashte S, Gulbake A, El-Amin SF III, Gupta A. COVID-19 vaccines: rapid development, implications, challenges and future prospects. Hum Cell. 2021;34:711–33. doi:10.1007/s13577-021-00512-4.