
ABSTRACT
Introduction
In Ethiopia, measles continues to be the cause of a significant number of vaccine-preventable infant morbidity and mortality due to the low vaccination rate. However, understanding the geographical distribution of the measles-containing vaccine first dose (MCV1) and identifying associated factors is crucial to setting up appropriate interventions. This study aimed to explore the spatial distribution and associated factors of MCV1 coverage among children aged 12–23 months in Ethiopia using national representative data.
Methods
A cross-sectional study design using a two-stage stratified sampling technique was used. The analysis was performed using STATA 14.2, ArcGIS 10.8, and SaTScan version 9.6 software. To find significant related factors with measles vaccination, researchers used multilevel logistic regression.
Results
The prevalence of MCV1 in Ethiopia was 58.5%. A spatial variation of MCV1 coverage was observed across the study area. The most likely significant primary clusters with low MCV1 coverage were observed in Liben, Afder, Shebelle, Korahe, and Nogob zones of the Somali region; Bale and Guji zones of the Oromia region, and Gedeo and Sidama zones of the SNNPR. Rural areas, maternal primary education, secondary and above school education, Orthodox religion, Muslim religion, health facility delivery, and Afar region were significantly associated with MCV1 vaccination.
Conclusion
The overall MCV1 coverage in Ethiopia was low. Aside from the inadequate coverage, there was a geographical variation across the country. Low MCV1 coverage areas should be prioritized to improve vaccination efforts to control measles across the country.
Introduction
Measles is a highly contagious human disease caused by a virus that causes a high fever and rash and can lead to blindness, encephalitis, or death. Citation1,Citation2 Measles killed an estimated 2.6 million people each year before the vaccine was introduced in 1963.Citation1 Despite the availability of a safe and effective vaccine, there were estimated 134,200 measles fatalities globally in 2015,Citation3 and a large number of estimated worldwide deaths have been documented since 2017.Citation4 More than 140,000 individuals died of measles in 2018 – largely children.Citation1
Measles can be prevented with two doses of measles vaccine, either alone, or in measles-rubella (MR), measles-mumps-rubella (MMR), or measles-mumps-rubella-varicella (MMRV) combinations.Citation5,Citation6 Universally available measles vaccines are safe, effective, provide long-lasting protection, and may be used interchangeably within immunization programs.Citation5,Citation7,Citation8 The vaccine has saved a substantial number of lives.Citation9
Measles-containing vaccine dose 1 (MCV1) and measles-containing vaccine dose 2 (MCV2) are programmatically scheduled vaccinations, which can be delivered through routine services, intensification of routine services, or supplementary immunization activities.Citation10 During the period 2000–2019, global coverage of the MCV1 increased from 72% to 84% but remained low in Africa (69%). Nigeria, Ethiopia, the Democratic Republic of the Congo, Pakistan, India, and the Philippines had the greatest percentage of infants who did not receive MCV1, accounting for 48% of the global total.Citation11
The timing of administering MCV1 and MCV2 varies across countries and regions. Where the risk of measles incidence and mortality among infants remains high, MCV1 is administered at or soon after reaching 9 months of age, and MCV2 is given between 15 and 18 months of age with the minimum interval between first and second doses. is 4 weeks.Citation12 In countries where the risk of measles virus infection among infants is low, MCV1 is administered at 12–15 months of age to take advantage of the higher seroconversion rates achieved at this stage.Citation13
In Ethiopia, the Expanded Program on Immunization (EPI) began in 1980 with six antigens to achieve 100% immunization coverage for all children under the age of two by 1990.Citation14,Citation15 However, the prevalence in the first twenty years was very low.Citation15 The percentage of children aged 12–23 months who received MCV1 has shown significant progress since 2000. Increased from 21% in 2000, to 35% in 2005, 56% in 2011,Citation16 54% in 2016,Citation17 and 59% in 2019.Citation18
Despite the availability of a safe, effective, and cost-effective vaccine, and considerable improvement in measles vaccination coverage in Ethiopia, measles continues to be the leading cause of vaccine-preventable infant morbidity and mortality.Citation19–21 Accumulation of unvaccinated children in highly populated areas contributed to the frequent measles outbreaks occurring in different parts of the country.Citation20 A total of 243 measles outbreaks were confirmed in 2013 with a total of 192 affected woredas/districts compared to 146 in 2012 with a total of 125 affected districts, 302 in 2014 with a total of 249 affected districts,Citation15 and 63 outbreak episodes were reported in 2018.Citation22 Although the number of reported measles cases in Ethiopia may represent a small proportion of the total expected cases, poor record-keeping and failure of mothers to bring children affected by measles to health facilities for treatment are among the contributing factors for potential under-reporting.Citation23
Identifying clustered populations with low measles vaccination coverage can inform supplemental immunization activities and strengthen elimination programs,Citation24 and determining factors that contribute to the low vaccination coverage is important for developing appropriate intervention strategies that would advance overall vaccination coverages and reduce measles-related child and infant mortality. To the best of our knowledge, no study investigates the spatial distribution and associated factors of MCV1 in Ethiopia at the national level. Therefore, this study aimed to explore the geographic distribution of MCV1 and its associated factors among children aged 12–23 months in Ethiopia.
Methods
Study design, setting, and period
Secondary data analysis was done based on the 2019 Ethiopian Mini Demographic and Health Survey (EMDHS) data. This survey was the second EMDHS and the fifth Demographic and Health Survey (DHS) implemented in Ethiopia from March 21, 2019, to June 28, 2019. Ethiopia has nine regions (Tigray, Afar, Amhara, Oromia, Somali, South Nation Nationality and Peoples Region (SNNPR), Benishangul-Gumuz, Gambella, and Harari) and two city administrations (Addis Ababa and Dire Dawa). Each region and city administration are sub-divided into zones and zones into woredas. The woredas are further divided into kebeles, which is the lowest administrative unit in the country.Citation25
Sample size and sampling procedure
The sampling frame used for the 2019 EMDHS is a frame of all census enumeration areas created for the 2019 Ethiopian population and housing census conducted by the Central Statistical Agency (CSA). The survey used a two-stage stratified sampling technique. Each region was stratified into urban and rural areas, yielding 21 sampling strata. Samples of enumeration areas (EAs) were selected independently in each stratum in two stages. A total of 305 EAs (212 in rural areas and 93 in urban areas) were chosen in the first stage, with probability proportional to EA size and independent selection in each sampling stratum. A household listing operation was carried out for all selected EAs. The generated list of households was used as a sampling frame for the second stage’s selection of households. In the second step of the selection process, a specific number of 30 households in each cluster were chosen with an equal likelihood of systematic selection. A detailed methodology has been presented in the 2019 EMDHS final report.Citation18 In this study, all the children aged 12–23 months living in the selected EAs were the study population. A total weighted sample of 1028 children aged 12–23 months with their mothers was included.
Data source and extraction
After permission was granted to a reasonable request that explained the purpose of our study, the data was retrieved from the MEASURE DHS program’s official database (https://www.dhsprogram.com/data). The data from the 2019 EMDHS are open to all registered users. We extracted the response variable (MCV1 vaccination status) and potential predictor variables after downloading the data.
Study variables
Dependent variable: the response variable for this study was the MCV1 vaccination status of children aged 12–23 months. It was measured as a dichotomous variable with possible values “1” if the child had received MCV1 and “0” if the child did not receive MCV1. Information about vaccination coverage was obtained from mothers’ verbal reports, written vaccination records, and health facility records.
Independent variables: the possible predictor variables of the study were further classified into two levels (individual-level and community-level predictors). Individual-level variables include child sociodemographic factors such as sex of the child, age of the child, has health card; parental sociodemographic factors such as maternal age, religion, maternal education, sex of household head, household wealth status; and obstetrics factors such as ANC follow-up, birth order, number of living children, and place of delivery. The community-level factors include the place of residence and region.
Data management and analysis
Data cleaning, recoding, and weighting were undertaken before any statistical analysis. The data were weighted using sample weight, primary sampling unit, and sampling strata to make the survey representative. A detailed description of the sample weighting procedure was presented in the 2019 EMDHS final report.Citation18 The descriptive and summary statistics, such as cross-tabulations and frequency tables, were generated using STATA version 14.2 (Stata Corp. Statistical Software). ArcGIS version 10.8 and SaTScan version 9.7 software were utilized for the spatial analysis.
Spatial autocorrelation analysis
The MCV1 coverage status of children aged 12–23 months was examined using spatial autocorrelation (Global Moran’s I) statistics to see if it was clustered, dispersed, or randomly distributed across the study area. Moran’s I is a statistic that produces a single output number between −1 and +1. Moran’s I value approaching +1 indicates that MCV1 vaccination is spatially clustered. Moran’s I value approaching −1 indicates a dispersed spatial distribution of MCV1, whereas Moran’s I value 0 indicates a random geographic distribution of MCV1. A statistically significant Moran’s I test confirms the presence of a significant spatial autocorrelation (p-value <0.05) and leads to rejection of the null hypothesis (MCV1 vaccination status is randomly distributed).
Hotspot analysis of MCV1
The spatial variability of the high and low prevalence rates of MCV1 among children aged 12–23 months was calculated using Getis-Ord Gi* statistics in a hotspot analysis. The statistical significance of clustering was confirmed using the Z-score with a 95% confidence interval and a p-value <0.05. Statistical output with a high Gi* shows MCV1 hotspots, while a low Gi* indicates MCV1 cold spots.
Spatial scan statistical analysis
Purely spatial scan statistics were employed to test the occurrence of statistically significant spatial clusters of areas with low or high MCV1 coverage using a Bernoulli-based model by Kuldorff’s SaTScan version 9.7 software.Citation26 SaTScan uses a scanning window that moves across the study area to identify statistically significant clustering of areas with the same MCV1 coverage. We used the default maximum spatial cluster size of <50% of the population as an upper limit, which allowed both small and large clusters to be detected and ignored clusters that contained more than the maximum limit with the circular shape of the window. Most likely, clusters were identified using high log-likelihood ratio tests and significant p-value based on Monte Carlo replications.
Associated factors of MCV1
To identify significant predictor variables of MCV1, multilevel logistic regression analyses were used by taking into account the hierarchical nature of the DHS data. A multicollinearity test was performed using the variance inflation factor (VIF) to rule out a significant correlation between variables. All variables have VIF < 5 and tolerance greater than 0.1, indicating that there is no multicollinearity. To measure the variation between clusters, we computed the intra-cluster correlation coefficient (ICC) and likelihood ratio (LR) tests. The ICC quantifies the proportion of the total observed variation in MCV1 coverage that is attributable to between-clusters variation.Citation27 Bi-variable logistic regression analyses were performed for both individual and community-level predictors, and variables having p-value <0.2 in the bi-variable analyses were further fitted into the multivariable multilevel logistic regression analyses.
For the multivariable multilevel logistic regression analyses, four models were constructed using the STATA command melogit. To examine the extent of cluster variations in MCV1, the first model (a multilevel random intercept logistic regression model without covariates) was used as a null model with no explanatory variables. Individual-level factors were used to adjust the second model (a multilevel model with level one independent variables). The third model (a multilevel model with level two variables) was adjusted for community-level variables, whereas the fourth model was fitted simultaneously with individual and community-level variables. The models were compared using the log-likelihood ratio (LLR) and deviance. Finally, the fourth model was picked as the best-fitting model since it had the highest LLR and lowest deviance value. In the multivariable model, adjusted odds ratio (AOR) with 95% CI and p-value <0.05 were utilized to declare significantly associated factors of MCV1.
Results
The study included a total of 1028 children aged 6–23 months. Three hundred and ninety-nine (38.8%) of the children were between the ages of 12 and 15 months, and more than half (58.2%) were in the second to fifth birth order. Seven hundred and fifteen (69.5%) of the children lived in rural areas. Nearly half of the participants (54.9%) did not have health cards. In terms of wealth, 431 (41.9%) of the participants came from poor households ().
Table 1. Background characteristics of study participants and MCV1 coverage by various background characteristics among children aged 12–23 months in Ethiopia
Vaccination Coverage in Ethiopia
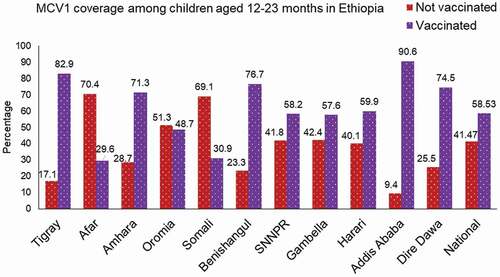
In this study, the prevalence of MCV1 in Ethiopia was 58.5% (95% CI: 55.49–61.52). At the regional level, the highest prevalence of MCV1 was in Addis Ababa (90.6%), followed by Tigray (82.9%), whereas the lowest was in Afar (29.6%) and the Somali region (30.9%) ().
Figure 1. MCV1 vaccination rate among children aged 12–23 months across regions of Ethiopia, EMDHS 2019.
Only half of the children who reside in rural areas received MCV1. Regarding maternal education, among children born to moms who had no formal education, 203 (43.7%) of them received MCV1. Of female study participants, the majority of them (316, 59.4%) were vaccinated for measles. Coverage of MCV1 varied slightly according to birth order, ranging from 59.8% among 2nd–5th born children to a maximum of 65.5% among firstborn children. Of children who were born in the health facility, nearly three-quarters of them (74.6%) received MCV1 ().
Spatial distribution of MCV1
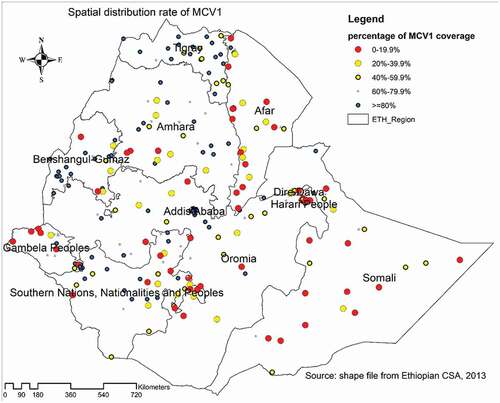
The lowest proportion of MCV1 coverage was observed in most parts of the Somali region, western, southern, and central parts of the Afar region, western parts of Gambella region, eastern parts of SNNPR, and some parts of the Oromia region, ranging from 0% to 19.9%. MCV1 was found in high concentrations (>80%) in Addis Ababa, western and central Tigray, western Benishangul-Gumuz, some areas of the SNNPR, Amhara, and Oromia region ().
Figure 2. The spatial distribution of MCV1 vaccination rate across regions of Ethiopia, 2019 EMDHS.
Spatial autocorrelation of MCV1
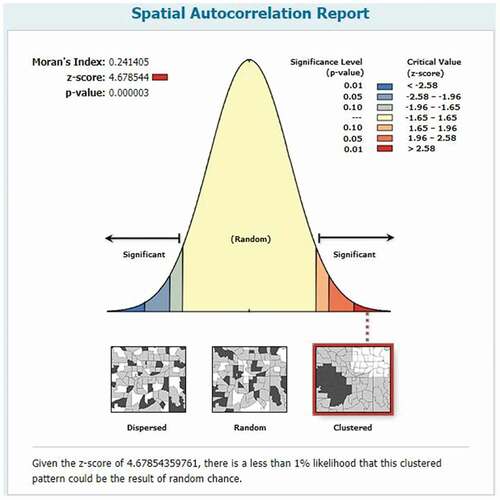
The spatial distribution of MCV1 in Ethiopia was nonrandom (Moran’s I = 0.24, p-value <0.01). The result shows that the observed Moran’s Index value (0.24) was greater than the expected Index (−0.004), and the p-value was <0.01, which is statistically significant. Given the Z-score of 4.678544 Indicates, there is a less than 1% likelihood that this clustered pattern could be the result of random chance ().
Figure 3. Spatial autocorrelation of MCV1 among children aged 12–23 months across regions of Ethiopia, EMDHS 2019.
Hotspot analysis of MCV1
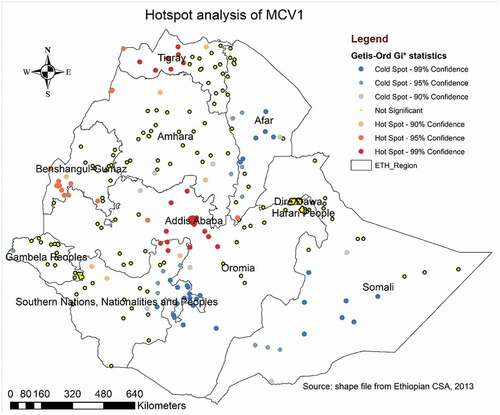
The Getis-Ord GI* statistical analysis identified the hotspot and cold spot areas of MCV1 across the study area. The blue color indicated the significant cold spot areas where a high proportion of children remained unvaccinated against measles (clusters that had low coverage of MCV1) observed in southern and southwest Somali, Afar, Eastern SNNPR, and south Oromia regions. However, in Addis Ababa, western and central Tigray, western Benishangul Gumuz, northern SNNPR, and central Oromia region, the red color indicated hotspot locations (clusters with high frequencies of MCV1) ().
Figure 4. Spatial pattern of hotspots and cold spots of MCV1 rate across regions in Ethiopia, EMDHS 2019.
Spatial scan statistical analysis
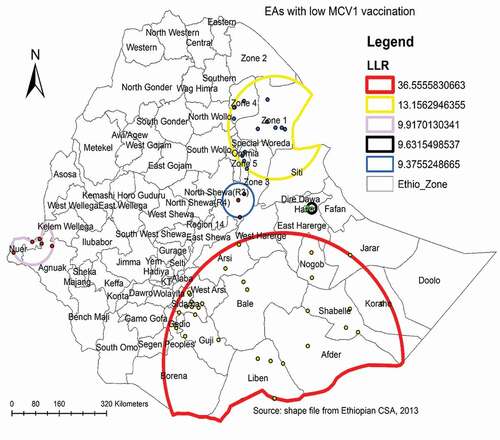
A total of 55 most likely significant clusters with low MCV1 coverage were detected in the spatial scan statistical analysis, meaning that children residing inside the spatial scan window were less likely to get MCV1 than children living outside the SaTScan window. Of these, 30 clusters of areas were the most likely significant primary clusters. The most likely significant primary clusters were found in the Somali region’s Libel, Afder, Shebelle, Korahe, and Nogob zones; Oromia region’s Bale and Guji zones; and SNNPR’s Gedeo and Sidama zones, centered at 4.996240 N, 41.440734 E with a 403.92 km radius, a relative risk (RR) of 2.1, LLR of 36.6, with a p-value of less than 0.01. The second most significant clusters were observed in zone 1, zone 4 and zone 5 of the Afar region centered at 11.561794 N, 41.244868 E with 159.37 km radius (RR = 1.8, LLR = 13.2, with p-value <0.01). The third significant clusters were located in Nuer zone of the Gambella region centered at 8.356129 N, 33.766046 E with a 70.96 km radius (RR = 2.0, LLR = 9.9, p-value = 0.02) ( and ).
Table 2. SaTScan analysis of measles vaccination among children aged 12–23 months in Ethiopia
Figure 5. SaTScan analysis of measles vaccination among children aged 12–23 months across zones in Ethiopia, 2019 EMDHS.
Random effect analyses and model comparison
The random effect analyses revealed significant clustering of MCV1 coverage among the communities (OR of variance = 2.2, 95% CI: 1.45 to 3.44), as shown in . The ICC value in model I (the null model) indicates that cluster/EA variability accounted for 40.5% of overall MCV1 coverage variability, while individual differences accounted for the remaining 59.5%. The variation in MCV1 coverage remained significant after accounting for individual and community-level factors. Across the communities, 14.3% of the chances of MCV1 coverage variation were detected in the full model. Devience and Log-likelihood were used to assess model fitness. Finally, as the best-fitted model, the model with the lowest deviation and highest Log-likelihood (model IV) was chosen ().
Table 3. Model comparison and random effect analysis result
Factors associated with MCV1
In the bi-variable analysis, variables such as maternal age, maternal education, religion, household wealth status, ANC follow-up, place of delivery, birth order, number of living children, ever had a health card, region, and place of residence were associated with MCV1 (p-value <0.2). Hence, these variables were eligible for the multivariable multilevel logistic regression. However, in the multivariable multilevel logistic regression analyses, only maternal education, place of delivery, religion, region, and residence were significant at p-value <0.05.
The odds of receiving MCV1 for children born from mothers that had primary school education were 2.7 (AOR = 2.73, 95% CI: 1.64–4.57) times higher compared to those children born from mothers that did not attain any formal education. Children born to moms with a secondary or higher education were approximately 5 (AOR = 4.99, 95% CI: 2.22–11.21) times more likely to have MCV1 than children born to mothers with no formal education.
Children who were from orthodox and Muslim religion followers were four times (AOR = 4.0, 95% CI: 1.53–6.17) and 2.6 (AOR = 2.6, 95% CI: 1.25–5.38) times more likely to take MCV1 compared to a child born from protestant religion followers, respectively. A mother who gave birth at a health facility had 2.4 times (AOR = 2.4, 95% CI: 1.34–4.40) times higher likelihood of vaccinating MCV1 for their children than mothers who had home delivery.
Among community-level factors, children in the Afar region had an 80% (AOR = 0.2, 95% CI: 0.06–0.75) lower chance of taking MCV1 than children in Addis Ababa. The odds of receiving MCV1 among children in the rural resident were decreased by 57% (AOR = 0.43, 95% CI: 0.22–0.85) compared to those children who were urban dwellers ().
Table 4. Multivariable multilevel logistic regression analysis of individual and community-level factors associated with measles vaccination among children aged 12–23 months in Ethiopia
Discussion
This study revealed that 58.5% of children aged 12–23 months in Ethiopia had received the first dose of measles-containing vaccine. The findings show that vaccination coverage was highest in the Addis Ababa city administration, which is relatively safe, and lowest in the Afar and Somali regions, which is relatively insecure (only three in ten children were vaccinated) (). Half of the children (50%) who lived in the rural areas did not receive MCV1.
Ethiopia has yet to achieve its goal of eliminating measles.Citation19–21 At least 93% to 95% of the population must be vaccinated to ensure population-based measles herd immunity and achieve the goal of measles elimination.Citation28,Citation29 However, we demonstrated that the overall MCV1 coverage among children aged 12–23 months in Ethiopia was low, which is similar to other low- and middle-income countries (LMICs) such as Afghanistan (60.4%),Citation30 but lower than Madagascar (71%), Uganda (79.5%), Kenya (87.1%),Citation31 Sierra Leone (75%),Citation32 and Pakistan (73%). A possible reason for this discrepancy might be due to variation in access to vaccination services and knowledge of mothers in the study area.
In the spatial analysis, spatial autocorrelation, hotspot, and spatial scan statistical analysis were reported. The spatial autocorrelation statistic confirmed that the distribution of MCV1 was clustered in some geographical areas. The hotspot analysis identified areas that had a low and high distribution of MCV1, whereas the spatial scan statistical analysis identified the most likely significant clusters, which had low MCV1 coverage. The global spatial autocorrelation statistics (Moran’s I = 0.241405, p ≤ .001), show that MCV1 coverage is clustered in some specific areas. The SaTScan analysis identified five likely significant clusters of areas with low MCV1 coverage across the study area, implying that children living in those geographic clusters of areas had a lower chance of receiving MCV1 than children living outside the spatial scan window. The most likely significant primary clusters with low MCV1 coverage were found in the Somali region of Liben, Afder, Shebelle, Korahe, and Nogob zone; Oromia’s Bale and Guji zone; and the SNNPR’s Gedeo and border of the Sidama zone. The second most significant clusters were observed in zone 1, zone 4, and zone 5 of the Afar region. In addition, the third significant cluster was identified in the Nuer zone of the Gambella region. The clustering of low MCV1 coverage in these locations could be because these areas are populated by rural populations who are unable to access health facilities.Citation33
In the multilevel analysis, maternal education, religion, place of delivery, region, and residence were significantly associated with MCV1 immunization. Children born to mothers who had primary school education and secondary and above school education had higher odds of receiving MCV1 than children born to uneducated mothers. This is supported by previous studies done in Ethiopia,Citation34 the Democratic Republic of Congo,Citation35 and China.Citation36 A possible explanation might be that maternal education is vital to enhance awareness about childhood vaccination and to improve the utilization of primary health-care services, such as childhood vaccination services.Citation37 Educated moms tend to have improved communication skills, which makes interactions with health-care providers easier, and leads to a better comprehension of vaccination programs and practices.Citation38
A statistically significant association was shown between the place of delivery and MCV1 vaccination status. This is consistent with studies in southwest EthiopiaCitation39 and Kenya,Citation40 which reveal that children born at health facilities have higher odds of receiving vaccinations than children born at home. This could be due to those mothers who gave birth in the health facilities having a high probability of getting health information and receiving training on immunization schedules, vaccine-preventable disease, and overall benefits of childhood vaccination from health service providers.Citation39
This study revealed that children living in rural areas were less likely to be vaccinated for measles compared to children living in urban areas. This is supported by previous studies done in the northwest district of Ethiopia,Citation41 Ghana,Citation42 and Afghanistan.Citation43 Children living in the Afar region are less likely to receive MCV1 than children living in Addis Ababa. This result is supported by a previous study in Ethiopia that showed childhood vaccination coverage varied across different regions of the country.Citation44,Citation45 Availability and accessibility of immunization services might be a possible reason for regional vaccination coverage inequalities.Citation34 Moreover, pastoral and semi-pastoral areas in Ethiopia cover two-thirds of the country’s landmass, with the Somali region in the east and southeast, the Afar region in the northeast, and the Borena in the south being the most important in terms of population and area occupied. People in pastoral communities often live semi-nomadic lives, and they are often rudimentary and easily movable.Citation46 The availability of weak health infrastructure and distance to health facilities in pastoralist and semi-pastoralist regions have been identified as challenges for routine vaccination services that could account for regional variations.Citation47
This study has its strengths and limitations. The study was done based on the national and sub-national representative DHS data. The data were weighted and done using a multilevel analysis by considering the hierarchical nature of the DHS data to get a reliable estimate and standard error. Therefore, the study findings are helpful to policymakers and program designers in designing appropriate interventions both at national and sub-national levels. As a limitation, since the study was cross-sectional, it does not show the cause and effect relationship of MCV1 coverage and its identified predictors. Furthermore, variables like media exposure and paternal education were not included in this study because no data on them could be found in the 2019 EMDHS, even though they may be significant predictors of measles vaccination.
Conclusion
In Ethiopia, MCV1 coverage varies across regions. The most likely significant clusters with low MCV1 coverage were identified in Somali, Afar, SNNPR, and Oromia regions. Maternal education, place of delivery, religion, region, and residence were significantly associated with MCV1 in different regions of Ethiopia. Accordingly, multifaceted intervention approaches are required to improve vaccination efforts to control measles across the country, and become essential for the goal of measles elimination. Hence, the Federal Ministry of Health and other concerned policymakers and public health planners should focus on developing an effective intervention program that targets areas with low MCV1 coverage, as identified in this study. The finding also suggests increasing maternal educational level, encouraging moms to give birth in a health institution, and focusing intervention initiatives in rural areas.
Abbreviations
Authors’ contribution
All authors made a substantial contribution to the study’s conception, design, methodology, and data analysis. GAT write-up the draft manuscript. All authors read, revised it critically for important intellectual content, and gave the final approval of the manuscript.
Ethical consideration
This study was done based on secondary data analysis, and permission was obtained from the MEASURE DHS program to download and use the data for our study purpose. So, ethical approval and participants’ consent are not applicable for this particular study. The dataset is publicly available in the official database of the MEASURE DHS program with no personal identity.
Acknowledgments
The authors would like to thank the MEASURE DHS program for providing the data for further analysis.
Disclosure statement
The authors declared that there was no conflict of interest in this work.
Data availability statement
The dataset used for this study is publicly available at the MEASURE DHS program website https://www.dhsprogram.com/data.
Additional information
Funding
References
- WHO. Measles key facts; 2019 [accessed 2021 Jun 22]. https://www.who.int/news-room/fact-sheets/detail/measles .
- World Health Organization. The immunological basis for immunization series: module 7: measles: update 2020. Geneva, Switzerland: World Health Organization; 2020.
- World Health Organization. Summary of the WHO position on measles vaccine- April 2017. [accessed 2020 Jun 21]. https://www.who.int/immunization/policy/position_papers/WHO_PP_measles_vaccine_summary_2017.pdf .
- Patel MK, Dumolard L, Nedelec Y, Sodha SV, Steulet C, Gacic-Dobo M, Kretsinger K, McFarland J, Rota PA, Goodson JL, et al. Progress toward regional measles elimination—worldwide, 2000–2018. MMWR. Morbidity and Mortality Weekly Report. 2019;68(48):1105. doi:10.15585/mmwr.mm6848a1.
- Centers for Disease Control and prevention. Vaccine for measles; 2020 [accessed 2021 Jun 18]. https://www.cdc.gov/measles/vaccination.html .
- WHO. Immunization, vaccines and biologicals. [accessed 2021 Jun 22]. https://www.who.int/teams/immunization-vaccines-and-biologicals/diseases/measles .
- U.S. Food & Drug Administration. Vaccination is the best protection against measles. 2021 Jun 22. [accessed 2021 Jun 22]. https://www.fda.gov/consumers/consumer-updates/vaccination-best-protection-against-measles .
- Demicheli VRA, Debalini MG, and Di Pietrantonj C. Vaccines for measles, mumps and rubella in children. Cochrane Database Syst Rev. 2012;2016(2):2076–12.
- Centers for Disease Control and Prevention. Morbidity and mortality weekly report. . [accessed 2021 Jun 25]. https://www.cdc.gov/mmwr/volumes/67/wr/pdfs/mm6747-H.pdf .
- WHO. WHO policy recommendation on routine measles second dose (MCV2): considerations for removing the criterion for introduction. [accessed 2021 Jun 10]. https://www.who.int/immunization/sage/meetings/2016/october/2_MCV2deliberations_YellowBookFinal.pdf?ua=1 .
- Patel MK, Goodson JL, Alexander JJP, Kretsinger K, Sodha SV, Steulet C, Gacic-Dobo M, Rota PA, McFarland J, Menning L. Progress Toward Regional Measles Elimination—Worldwide, 2000–2019. MMWR. Morbidity and Mortality Weekly Report. 2020;69(45):1700. doi:10.15585/mmwr.mm6945a6.
- World Health Organization . Measles vaccines: WHO position paper – April 2017; 2017. [accessed 2021 Jun 15]. http://apps.who.int/iris/bitstream/handle/10665/255149/WER9217.pdf?sequence=1 .
- Rosenthal, S. R. , Clements, C.J. . Two-dose measles vaccination schedules. Bull World Health Organ. 71 (3–4): 421–428. bi. PMID 8324862
- Federal Ministry of Health E. ETHIOPIA NATIONAL EXPANDED PROGRAMME ON IMMUNIZATION COMPREHENSIVE MULTI-YEAR PLAN 2011 – 2015; 2010. [accessed 2021 Jun 5]. https://bidinitiative.org/wp-content/files_mf/1405630243EthiopiaComprehensivemultiyearplanfor20112015Year2010.pdf .
- Federal Ministry of Health AA, Ethiopia. Ethiopia national expanded programme on immunization comprehensive multi- year plan 2016 −2020; 2015. [accessed 2021 Jun 4]. https://extranet.who.int/countryplanningcycles/sites/default/files/country_docs/Ethiopia/ethiop_cmyp_latest_revised_may_12_2015.pdf .
- Central Statistical Agency/Ethiopia, ICF International. Ethiopia demographic and health survey 2011. Addis Ababa (Ethiopia): Central Statistical Agency/Ethiopia and ICF International; 2012.
- Central Statistical Agency/CSA/Ethiopia and ICF. Ethiopia demographic and health survey 2016. Addis Ababa (Ethiopia, and Rockville, Maryland, USA): CSA and ICF; 2016.
- Ethiopian Public Health Institute - EPHI, Federal Ministry of Health - FMoH, ICF. Ethiopia mini demographic and health survey 2019. Addis Ababa (Ethiopia): EPHI/FMoH/ICF; 2021.
- Getahun M, Beyene B, Ademe A, Teshome B, Tefera M, Afework A, HaileMariam Y, Assefa E, Hailegiorgis Y, Asha A . Epidemiology of laboratory confirmed measles virus cases in the southern nations of Ethiopia, 2007–2014. J BMC Infect Diseases. 2017;17(1):1–8.
- Akalu HB. Review on measles situation in Ethiopia; past and present. J Trop Dis Public Health. 2015;4(2):193.
- Gutu MA, Bekele A, Seid Y, Woyessa AB. Epidemiology of measles in Oromia region, Ethiopia, 2007-2016. Pan Afr Med J. 2020;37:171–171. doi:10.11604/pamj.2020.37.171.23543.
- World Health Organization E. Expanded program on immunization (EPI) 2018 ANNUAL REPORT; 2018. [accessed 2021 June 6]. https://www.afro.who.int/sites/default/files/2019-09/Final%202018%20EPI%20Annual%20Report%20for%20WHO%20Ethiopia.pdf .
- Yemane B, Damen Haile M, Kloos H. USAID/Ethiopia, Ya’Ityopyā ṭénā ‘aṭabābaq mh. Epidemiology and ecology of health and disease in Ethiopia. Addis Ababa (Ethiopia): Shama Books; 2006.
- Brownwright TK, Dodson ZM, and van Panhuis WGJBPH. Spatial clustering of measles vaccination coverage among children in sub-Saharan Africa. BMC Public Health . 2017;17(1):1–7.
- Wikipedia. Geography of Ethiopia. 2021; [accessed 2021 June 2].https://en.wikipedia.org/wiki/Geography_of_Ethiopia .
- Kulldorff M. SaTScanTM user guide. 2021; [accessed 2021 May 25]. http://www.satscan.org/ .
- EI Rodríguez G. Intra-class correlation in random-effects models for binary data. The Stata Journal. 2003;3:32–36.
- Bester JC. Measles and measles vaccination: a review. JAMA Pediatr. 2016;170(12):1209–15. doi:10.1001/jamapediatrics.2016.1787.
- Regional Committee for A. Measles elimination by 2020: a strategy for the African Region. Brazzaville, Congo: World Health Organization. Regional Office for Africa; 2011.
- Aalemi AKS, Mubarak K, Yousuf M. Factors influencing vaccination coverage among children age 12–23 months in Afghanistan: analysis of the 2015 Demographic and Health Survey. PLOS ONE. 2020;15(8):e0236955. doi:10.1371/journal.pone.0236955.
- Tesema GA, Tessema ZT, Tamirat KS, Teshale AB. Complete basic childhood vaccination and associated factors among children aged 12–23 months in East Africa: a multilevel analysis of recent demographic and health surveys. BMC Public Health. 2020;20(1):1837. doi:10.1186/s12889-020-09965-y.
- Statistics Sierra Leone (Stats SL) and ICF. Sierra Leone demographic and health survey 2019. Freetown (Sierra Leone, and Rockville, Maryland, USA): Stats SL and ICF; 2020.
- Aynalem Adugna. Health institutions and services; 2014. [accessed 2021 Jun 3]. http://www.ethiodemographyandhealth.org/HealthInstitutionsServicesAynalemAdugna.pdf .
- Shibre G, Zegeye B, Idriss-Wheeler D, Yaya S. Inequalities in measles immunization coverage in Ethiopia: a cross-sectional analysis of demographic and health surveys 2000–2016. J BMC Infect Diseases. 2020;20:1–12.
- Acharya P, Kismul H, Mapatano MA, Hatløy A. Individual-and community-level determinants of child immunization in the democratic Republic Of Congo: a multilevel analysis. J PloS one. 2018;13(8):e0202742. doi:10.1371/journal.pone.0202742.
- Hu Y, Li Q, Luo S, Lou L, Qi X, Xie S. Timeliness vaccination of measles containing vaccine and barriers to vaccination among migrant children in East China. J PloS one. 2013;8(8):e73264. doi:10.1371/journal.pone.0073264.
- Owais A, Hanif B, Siddiqui AR, Agha A, Zaidi AK. Does improving maternal knowledge of vaccines impact infant immunization rates? A community-based randomized-controlled trial in Karachi, Pakistan. BMC Public Health. 2011;11:239. doi:10.1186/1471-2458-11-239.
- Vikram K, Vanneman R, Desai S. Linkages between maternal education and childhood immunization in India. J Social sci med. 2012;75(2):331–39. doi:10.1016/j.socscimed.2012.02.043.
- Meleko A, Geremew M, Birhanu F. Assessment of child immunization coverage and associated factors with full vaccination among children aged 12–23 months at Mizan Aman Town, Bench Maji Zone, Southwest Ethiopia. Int J Pediatr. 2017;2017:7976587. doi:10.1155/2017/7976587.
- Awino OJ. 2016. Determinants Of Immunization Coverage Among Children Aged 12-23 Months In Kenya . University Of Nairobi. [accessed 2021 Jun 6]. http://hdl.handle.net/11295/98427 .
- Tesfaye TD, Temesgen WA, Kasa AS. Vaccination coverage and associated factors among children aged 12 – 23 months in Northwest Ethiopia. Hum Vaccin Immunother. 2018;14(10):2348–54. doi:10.1080/21645515.2018.1502528.
- Budu E, Darteh EKM, Ahinkorah BO, Seidu -A-A, Dickson KS. Trend and determinants of complete vaccination coverage among children aged 12-23 months in Ghana: analysis of data from the 1998 to 2014 Ghana Demographic and Health Surveys. PLOS ONE. 2020;15(10):e0239754. doi:10.1371/journal.pone.0239754.
- Farzad F, Reyer JA, Yamamoto E, Hamajima N. Socio-economic and demographic determinants of full immunization among children of 12–23 months in Afghanistan. J Nagoya j med sci. 2017;79:179.
- Geweniger A, Abbas KM. Childhood vaccination coverage and equity impact in Ethiopia by socioeconomic, geographic, maternal, and child characteristics. Vaccine. 2020;38(20):3627–38. doi:10.1016/j.vaccine.2020.03.040.
- Nour TY, Farah AM, Ali OM, Abate KH. Immunization coverage in Ethiopia among 12–23 month old children: systematic review and meta-analysis. BMC Public Health. 2020;20(1):1134. doi:10.1186/s12889-020-09118-1.
- Desta S. Pastoralism and development in Ethiopia. [accessed 2021 Nov 10]. https://media.africaportal.org/documents/Economic_Focus__Vol_9_No_3_0.pdf .
- WHO. Global vaccine action plan priority country reports on progress towards GVAP-RVAP goals. Annex to the GVAP Secretariat Annual Report 2016; 2016 [accessed 2021 Jun 25]. https://www.who.int/immunization/global_vaccine_action_plan/2_Regional_reports_annex_GVAP_secretariat_report_2016.pdf?ua=1.