
 ?Mathematical formulae have been encoded as MathML and are displayed in this HTML version using MathJax in order to improve their display. Uncheck the box to turn MathJax off. This feature requires Javascript. Click on a formula to zoom.
ABSTRACT
In this study, we quantify and evaluate the transmission capacity of different types of influenza, and evaluate the flu vaccination effect. Taking the influenza cases reported by the National Influenza Center of China from 2010 to 2019 as the research object (http://www.chinaivdc.cn/cnic), we established the SEIABR model to calculate the influenza infection rate and R0 for each year from 2010 to 2019, and calculate the influenza A and B influenza infection rates. We further added vaccination measures to the SEIABR model, and analysis the impact of different vaccination rates on the spread of influenza. We find that the range of β(infection rate) is to
, and the average is
, the range of R0 is .98 to 1.47, and the average is 1.21. Simulation result suggest that vaccine coverage needed to reach 60%-80% to control the spread of influenza virus in China when the vaccine effectiveness was 20%-40%. When the vaccine effectiveness is 40%-60%, vaccine coverage needs to reach 40%-60% to control the spread of influenza virus in China. In China, the infection rate of influenza A is higher than influenza B, to better control the spread of the flu virus, we suggest that we also need to increase the number of people vaccinated or improve the efficiency of vaccines(the current vaccination coverage is probably less than 20%).
1. Background
Influenza is an acute respiratory infection caused by a negative-strand RNA virus of the Orthomyxoviridae family.Citation1 Influenza often causes a respiratory infection, atypical gastrointestinal symptoms such as vomiting and diarrhea can occur in children. A minority of patients will experience severe disease due to viral or secondary bacterial pneumonia with respiratory and multiorgan failure.Citation2,Citation3 The incubation period of influenza virus is short, usually 1–7 days. The source of infection is mainly patients and invisible infections. Most of them are transmitted through air and droplets, and they can also be transmitted through mucous membranes, such as oral, nasal, and eye contact. It can occur every year, and the population is generally susceptible.Citation4 According to the difference between (nuclear protein)NP and (matrix protein)MP, influenza can be divided into three different types: A, B, and C.Citation5 Among them, influenza A antigens have the strongest variability, which can often trigger influenza outbreaks and pandemics; influenza B antigens have weaker variability, which can generally cause local outbreaks and pandemics of influenza; influenza C antigens are more stable, Generally does not cause outbreaks and epidemics, and sporadic cases are more common. At present, the common subtypes of human infection are A/H1N1 and A/H3N2 influenza and B/Victoria and B/Yamagata influenza.Citation5 Studies have found that in different countries and regions, the dominant influenza strains may be different. In the same country or region, there are also multiple influenza subtypes co-epidemic. In addition, influenza viruses often undergo antigenic shifts, drifts and mutations. Due to the high frequency of influenza virus mutations, the general public often lacks immunity to new influenza virus subtypes, and it takes several months from the initial discovery of the new virus subtype to the development of a vaccine.Citation6
In 2013, a new type A/H7N9 avian influenza virus was discovered in China Cases, the fatality rate is close to 40%.Citation7–9 From 2010 to 2018, estimated seasonal influenza activity in the United States ranged from 9.3 million to 49 million cases and 12,000 to 79,000 deaths per year.Citation10 The 2017–2018 influenza season was the third most severe since 2003–2004 and was characterized by high severity of disease in all age groups.Citation11 Most cases were secondary to the A/H3N2 subtype, and low vaccine effectiveness was a significant contributing factor. Based on public health laboratory specimens, the predominant influenza A subtype for the 2018–2019 season was (H1N1) pdm09 (56.6% of positive specimens), followed by the A/H3N2 subtype (43.6%) and influenza B(4%).Citation12
We established a compartmental model to estimate the infection rate of the influenza in China, and calculated the basic reproduction number in every year.
2. Methods
Taking the influenza cases reported by the National Influenza Center of China from 2010 to 2019 as the research object, the influenza data comes from the influenza surveillance network of the National Influenza Center of China (http://www.chinaivdc.cn/cnic), and the demographic data comes from the National Bureau of Statistics Official website (http://www.stats.gov.cn). We will use the collected data and the model to calculate the infection rate and basic reproduction number of influenza in China from 2010 to 2019.
2.1. The mathematical model
We have developed two different compartmental models. First, we established the SEIABR model to calculate the infection rate of influenza for each year from 2010 to 2019, and calculate the infection rate of influenza A and influenza B (model 1.1). We further added vaccinated individual to the SEIABR model, and calculated the impact of different vaccination coverage on the spread of influenza using the influenza data in 2019 (model 1.2). The dynamics explained in this subsection are displayed in , also see . for the meaning of the remaining parameters. The description of model’s parameters are given in .
Figure 1. Flow diagram of the models.

Table 1. Description of variables in the model (1.1).
Table 2. The meaning and value of each parameter in the model 1.1 and model 1.2.
In order to build this model 1.1 and model 1.2, we made the following assumptions:
Susceptible persons can be infected by exposed individuals, and become exposed. The infection rate of susceptible with exposed human is
.
The population may become symptomatic or asymptomatic after being infected by flu virus, and the probability of becoming asymptomatic is
The probability that a susceptible individuals will see a doctor after being infected is q.
The recovery rate of symptomatic patients, asymptomatic patients, and non-visit patients is
Symptomatic patients and non-visit patients can die from influenza virus infection, the mortality rate is
The recovered individuals do not acquire the infection again and are not going to infect others.
Based on these assumptions, we proposed a schematic diagram and provided the corresponding model equations:
2.2. Basic reproduction number
According to next-generation matrix method, the new infectious terms and transition terms of the system (1.1) are given by
We find the matrices F and V as
It follows that
Where
Because the basic reproduction number is the same as the FV−1 spectrum radius,
3. Results
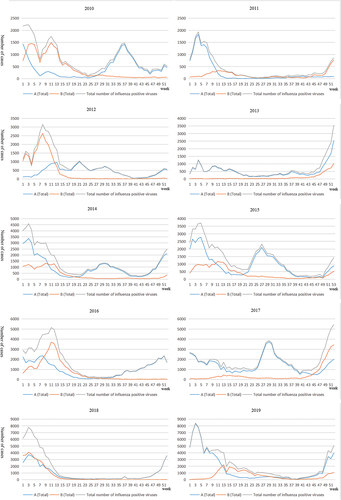
Cases were mainly concentrated in January to April, in 2011, 2012, 2014, 2015, 2016, 2018 and 2019, In 2015 and 2017, cases were mainly concentrated in June to October. Two large-scale influenza transmissions occurred in 2010, the first from January to June, mainly by influenza B viruses, and the second from June to October, mainly by influenza A viruses. From 2010 to 2019, more patients were infected with influenza A than those infected with influenza B, but in 2010, 2012, 2016, and 2018, the number of patients infected with B virus increased significantly ().
Figure 2. Influenza virus epidemic cycle.
3.1. Model calibration
On the basis of the model, obtain the annual flu infection rate (β) to reflect the flu transmission ability. It is calculated that the range of β is to
, and the average is
. β fluctuates from year to year, but the amplitude is not very large. The probability of influenza infection from 2010 to 2013 is relatively high. It remained stable after falling in 2014, and began to show an upward trend in 2018 ().
Table 3. Influenza infection rate in different years.
Further, we calculated the R0 of influenza viruses in China from 2010 to 2019. We found that R0 from 2010 to 2019 ranged from .98 to 1.47, and the average is 1.21. R0 in 2013 was higher than others, and R0 in 2017 was the lowest. Influenza caused continuous infection in China from 2010 to 2013 and was well controlled after 2014. From 2014 to 2018, the R0 of influenza virus in China remained approximately 1 ().
Table 4. R0 in different years.
Separately collate the annual data of influenza A and influenza B, establish a SEIABR model, and combine actual data to simulate the epidemic cycle of different types of influenza each year. On the basis of the model, the annual infection rate (β) of influenza A and influenza B was obtained respectively, and it was found that the average infection probability of influenza A was, and the average infection rate of influenza B was
, the infection rate of influenza A is higher than that of type B influenza ( and ).
Figure 3. The changing trend of the infection rate of different types of influenza viruses.
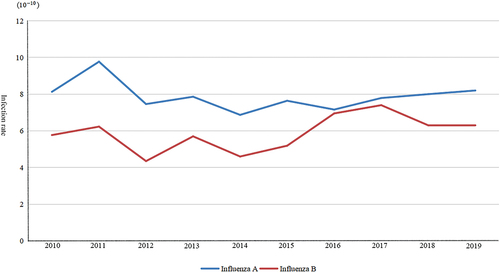
Table 5. Infection rate of the two types of influenza viruses.
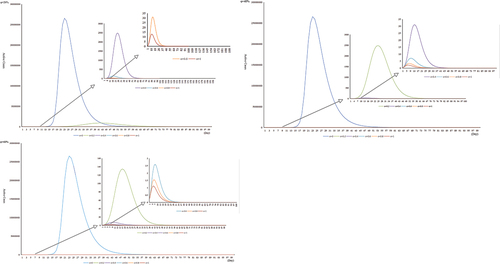
The influenza data of 2019 are used to simulate the vaccination coverage of 0%, 20%, 40%, 60%, 80%, and 100%. Based on the results of previous studies, it is assumed that the vaccine effectiveness(VE) is 20%-60%. The results show that vaccination coverage needed to reach 60%-80% to control the spread of influenza virus in China when the VE was 20%-40%. When the VE is 40%-60%, vaccination coverage needs to reach 40%-60% to control the spread of influenza virus in China. Especially when the VE is 60%, 20% vaccination coverage can keep the maximum number of active cases(patients with existing) below 200 ().
Figure 4. Simulation result.
3.2. Sensitivity analysis
The forward sensitivity index of normalization of function f with variable x is . According to the formula R0, R0 is affected by four parameters
,
,
and
, among which parameters
,
and
are uncontrollable variables with fixed parameter values in the process of disease transmission, so we only need to analyze the sensitivity changes of R0 with
.
We find
Further
We find that for the parameter ,the sensitivity index of R0 is 1. It means that 1% increase in the value of
will result in 1% increase in the value of R0.
4. Discussion
In this study, we first proposed a deterministic compartmental model to describe the disease transmission in the population. We first goal was to calculated the annual influenza infection rate, whereas another aim was to see of the impact of the vaccination on influenza epidemic.
We found that in China, the large-scale transmission of influenza A and influenza B mostly occurred in spring and winter. In 2010, 2014, 2015 and 2017, influenza A also broke out in summer, which may be related to population activities. China has a lot of population activities from July to August, which may lead to large-scale population aggregation. Influenza B basically does not spread on a large scale in summer, which may be one of the reasons why the infection rate of influenza B is lower than that of influenza A. By looking at the estimated parameters, it is observed that the average of β is, this infection rate is similar to the results of other studies.Citation20 Calculating and comparing the infection rate of influenza A and influenza B each year, it is found that the infection rate of influenza A is higher than influenza B. Human influenza A is formed by genetic reassortment of human and avian influenza viruses, influenza A is the only influenza virus subtype that has an animal host.Citation21 Its infectiousness is manifested by the ability of horizontal gene transfer, which can cause the host repeated infections.Citation22 The inherent characteristics of influenza B virus replicase lead to slower changes in its antigenic characteristics and genetic evolution than influenza A,Citation23 and influenza B virus does not have an animal host and does not have the potential for a pandemic. However, studies have found that in recent years, the infection rate of influenza B has been on the rise, in 2016, the infection rate of influenza B was basically the same as that of influenza A. which may be related to avoid the body’s immune defense, by antigen drift and antigen transfer.Citation24,Citation25
Our study also simulated the effects of vaccination, we found that in the season when influenza epidemics are prone to occur, vaccinating the population against influenza can effectively control the spread of the influenza virus. Based on the actual situation in China, the vaccine effectiveness is assumed to be 20%-60%. At 20% vaccine effectiveness, 40% vaccine coverage is not effective in controlling influenza transmission, and the maximum number of active cases is about 2,500. When the vaccine effectiveness is 60%, 20% vaccine coverage keeps the maximum number of active cases within 200. In China, studies have shown that only 3%-4% of children under the age of five are vaccinated against influenza.Citation1 As of November 9, China had received about 25 million doses of flu vaccine, or just 1.8% of the country’s population, the National Health Commission said at a press conference in November 2020. In China, except for some regions, voluntary and self-funded vaccination methods are adopted, and the lower per capita vaccination coverage. Therefore, we suggest that if there are difficulties in the promotion of vaccines, we can improve the efficiency of vaccines to obtain the best prevention and control effect at present.
When an infectious disease breaks out, the protection of susceptible people is one of the key measures for prevention and control, and vaccination is the most effective means to prevent and control influenza. Currently, there are three vaccines approved for vaccination in China, namely trivalent attenuated influenza vaccine (LAIV3), trivalent inactivated influenza vaccine (IIV3), and quadrivalent inactivated influenza vaccine (IIV4). Among them, the trivalent vaccine includes type A H1N1, H3N2 and a single B strain subtype, the quadrivalent vaccine contains A type H1N1, H3N2 and B type Victoria, Yamagata four main influenza subtypes, covering a wider range.
However, vaccine vaccination is affected by many factors, such as vaccine production and storage capacity, the number and load of vaccination clinics, and the participation of susceptible people. Few countries have complete influenza vaccination plans.Citation22 In 2020, after the outbreak of the new crown epidemic, Chinese citizens’ enthusiasm for influenza vaccination was unprecedentedly high.Citation26 However, the production cycle of influenza vaccines needs at least 5 months, and the validity period is 1 year. It cannot be used across the year, and there is little room for regulation of temporary increase in production. In China, only five companies, Hualan Biology, Changchun Biology, Jiangsu Jindike Biology, Beijing Kexing Biology and Wuhan Institute of Biological Products, have been approved for the production and registration of quadrivalent influenza vaccines. Therefore, in the actual prevention and control process, It is recommended that the government adjust vaccine productivity in a planned way to improve vaccine reserve capacity in response to the weak links of vaccination. At the same time, increase the construction of vaccination clinics, increase their workload, and carry out scientific propaganda to effectively mobilize the population, especially those at high risk of influenza. To increase the vaccination rate. In addition, previous studies have found that the effectiveness of influenza vaccines is limited. Two weeks after vaccination, protection begins; one month later, the antibody reaches a higher level; after 6–8 months, the antibody level decays with time; after one year, the serum antibody level decreases significantly.Citation27 Therefore, immunization is required every year, in order to ensure the effectiveness of the vaccine, it is necessary to optimize the vaccination time,Citation28 It should be noted that the flu vaccine can resist the invasion of influenza virus, but it cannot prevent the occurrence of the common cold. In addition, due to the relatively large variability of influenza virus, its antigen will change over time. It is necessary to continuously monitor the influenza epidemic and prepare a suitable vaccine.Citation29
The influenza surveillance network of the National Influenza Center of China was first established in 2000 and now includes 554 sentinel hospitals and 408 network surveillance laboratories, covering all provinces, municipalities and autonomous regions on the Chinese mainland. Influenza surveillance by including influenza A and influenza B two kinds, among them, the influenza A contains A (H1N1), A (H3N2), influenza B contains B (Yamagata), B (Victoria), etc. Sentinel hospitals and network laboratories carry out year-round, uninterrupted surveillance of influenza cases, including general hospitals and specialized hospitals. According to the diagnostic criteria of influenza, the competent departments of sentinel hospitals should register, collect and summarize the number of influenza cases every day, and input the monitoring data into “China Influenza Surveillance Information System” before 24:00 every Monday evening. Upon receipt of influenza samples collected by sentinel hospitals, the network laboratories are required to complete the identification of influenza virus strains or subtypes within three working days, and input the results into the influenza surveillance system within 48 hours after completion of the test.
From 2010 to 2019, sentinel hospitals sent 5,168,766 samples of suspected influenza cases in China, of which 4,460,245 were valid, with an effective rate of 86.29%. 671,693 influenza cases were detected, with a positive rate of 15.06%.
This study did not analyze people of different ages. In China, the vaccination coverage and vaccine effectiveness of different age groups may be different, and the effectiveness of influenza vaccines against different influenza viruses is also different. We will focus on these problems in future study.
Paper context
Influenza has spread around the world. We found that influenza A is more infectious than influenza B, assessed the impact of vaccines on the spread of influenza, and found that influenza outbreaks can be well controlled when vaccination coverage reaches 60%. We should increase vaccination rates for influenza, mainly against type A influenza.
Authors’ contributions
Conceptualization, Nan Zhou; Data curation, Nan Zhou; Formal analysis, Nan Zhou; Funding acquisition, WenTing Zha and Yuan Lv; Investigation, WenTing Zha and Yuan Lv; Methodology, Nan Zhou; Project administration, Nan Zhou; Resources, Nan Zhou; Software, Nan Zhou; Validation, Nan Zhou; Visualization, Nan Zhou; Writing original draft, Nan Zhou; Writing—original draft, Nan Zhou; Writing—review & editing, Nan Zhou. All authors have read and agreed to the published version of the manuscript.
Disclosure statement
No potential conflict of interest was reported by the author(s).
Correction Statement
This article has been republished with minor changes. These changes do not impact the academic content of the article.
Additional information
Funding
References
- Zhang Y, Muscatello DJ, Cao Z, Chughtai AA, Costantino V, Zhang D, Yang P, Wang Q, MacIntyre CR. A model of influenza and vaccination in children aged under 5 years in Beijing, China. Human Vaccines & Immunotherapeutics. 2020;16(7):1685–8. doi:10.1080/21645515.2019.1705692.
- Center for Disease Control and Prevention. Influenza(flu): clinical signs and symptoms of influenza. [Updated March 8, 2019; Accessed October 5, 2019].
- Peteranderl C, Herold S, Schmoldt C. Human influenza virus infections. Semin Respir Crit Care Med. 2016;37(4):487–500. doi:10.1055/s-0036-1584801.
- Xu X, Blanton L, Abd Elal A, Alabi N, Barnes J, Biggerstaff M, Brammer L, Budd AP, Burns E, Cummings CN. Update: influenza activity in the United States during the 2018–19 season and composition of the 2019–20 influenza vaccine. MMWR Morb Mortal Wkly Rep. 2019;68(24):544–51. doi:10.15585/mmwr.mm6824a3.
- Peng Z, Feng L, Carolyn GM, Wang K, Zhu G, Zhang Y, Hu J, Huang Y, Pan H, Guo N. Characterizing the epidemiology, virology, and clinical features of influenza in China’s first severe acute respiratory infection sentinel surveillance system, February 2011 – October 2013. BMC Infect Dis. 2015;15(1):143. doi:10.1186/s12879-015-0884-1.
- Robert GW, Elena AG. Continuing challenges in influenza[j]. Ann N Y Acad Sci. 2014;1323(1):115–39. doi:10.1111/nyas.12462.
- Lim BH, Mahmood TA. Influenza a H1N1 2009(swine Flu) and pregnancy. J Obstet Gynaecol India. 2011;61:286–93. doi:10.1007/s13224-011-0055-2.
- Pandemic Influenza a H1N1: Clinical management protocol and infection control guidelines. Directorate General of Health Services Ministry of Health and Family Welfare Government of India. [Accessed 2015 Mar 1]. http://www.iapsmgc.org/userfiles/3Clinical_Management_Protocol-Pandemic_influenza_A_H1N1.pdf.
- Smith GJ, Vijaykrishna D, Bahl J, Lycett SJ, Worobey M, Pybus OG, Ma SK, Cheung CL, Raghwani J, Bhatt S. Origins and evolutionary genomics of the 2009 swine-origin H1N1 influenza a epidemic. Nature. 2009;459(7250):1122–25. doi:10.1038/nature08182.
- Centers for disease control and prevention. Influenza(flu): burden of influenza. Updated February 19, 2019. [Accessed 2019 Oct 5]. https://www.cdc.gov/flu/about/burden/2018-2019.html.
- Garten R, Blanton L, Elal Al A, Alabi N, Barnes J, Biggerstaff M, Brammer L, Budd AP, Burns E, Cummings CN. Update: influenza activity in the United States during the 2017–18 season and composition of the 2018–19 influenza vaccine. MMWR Morb Mortal Wkly Rep. 2018;67(22):634–42. doi:10.15585/mmwr.mm6722a4.
- Moser MR, Bender TR, Margoils HS, Noble GR, Kendal AP, Ritter DG. An outbreak of influenza aboard a commercial airliner. Am J Epidemic. 1979;110(1):1–6. doi:10.1093/oxfordjournals.aje.a112781.
- Grabowski A, Kosinski RA. The SIS model of epidemic spreading in a hierarchical social network[J]. Acta Physica Polonica Series B. 2005;36:1579–93.
- Wang Y, Jin Z, Yang Z, Zhang Z-K, Zhou T, Sun G-Q. Global analysis of an SIS model with an infective vector on complex networks[j]. Nonlinear Anal Real World Appl. 2012;13(2):543–57. doi:10.1016/j.nonrwa.2011.07.033.
- Jia J, Li Q. Qualitative analysis of an SIR epidemic model with stage structure[J]. Appl Math Comput. 2017;193:106–15.
- Velasco RP. Modelos mixtos para medir la eficiencia de las intervenciones sanitarias: el caso de la inmunización frente al influenza virus en el medio ambiente[D]. Universidad de La Rioja; 2016.
- China Statistical Yearbook. Birth rate, death rate, natural growth rate. National Bureau of Statistic.
- Tchuenche JM, Khamis SA, Agusto FB, Mpeshe SC. Optimal control and sensitivity analysis of an influenza model with treatment and vaccination[j]. Acta Biotheor. 2011;59(1):1. doi:10.1007/s10441-010-9095-8.
- Group EW. Modelling scenarios of diffusion and control of pandemic influenza. Italy. 2017;12:348–50.
- Tracht SM, Del Valle SY, Hyman JM, Carter DA. Mathematical modeling of the effectiveness of facemasks in reducing the spread of novel influenza a (H1N1)[J]. PLoS ONE. 2010;5(2):e9018. doi:10.1371/journal.pone.0009018.
- Russell CA, Kasson PM, Donis RO, Riley S, Dunbar J, Rambaut A, Asher J, Burke S, Davis CT, Garten RJ. Improving pandemic influenza risk assessment [J]. Elife. 2014;3:e03883. doi:10.7554/eLife.03883.
- Petrova VN, Russell C. The evolution of seasonal influenza viruses [J]. Nat Rev Microbiol. 2018;16(1):47–60. doi:10.1038/nrmicro.2017.118.
- Yu H, Alonso WJ, Feng L, Tan Y, Shu Y, Yang W, Viboud C. Characterization of regional influenza seasonality patterns in China and implications for vaccination strategies: spatio-temporal modeling of surveillance data [J]. Plo S Med. 2013;10:e1001552.
- Yang J-R, Kuo C-Y, Huang H-Y, Hsu S-Z, Wu F-T, Wu F-T, Li C-H, Liu M-T. Seasonal dynamics of influenza viruses and age distribution of infected individuals across nine seasons covering 2009-2018 in Taiwan [J]. J Formos Med Assoc. 2019;11. pii: S0929-6646(19)30448-6. doi:10.1016/j.jfma.2019.08.030.
- Yu H, Alonso WJ, Feng L, Tan Y, Shu Y, Yang W, Viboud C. Characterization of regional influenza seasonality patterns in China and implications for vaccination strategies: spatio-temporal modeling of surveillance data [J]. Plo S Med. 2013;10(11):e1001552. doi:10.1371/journal.pmed.1001552.
- Taher Al Hassan Y, Fabella EL, Estrella ED. Association of vaccine awareness and confidence on the influenza vaccination status of Al Ahsa, Saudi Arabia residents [J]. Human Vaccines & Immunotherapeutics. 2021. doi:10.1080/21645515.2020.1855954.
- Guerche-Séblain C E, Caini S, Paget J, Vanhems P, Schellevis F. Epidemiology and timing of seasonal influenza epidemics in the Asia-Pacific region, 2010–2017: implications for influenza vaccination programs [J]. BMC Public Health. 2019;19(1):331. doi:10.1186/s12889-019-6647-y.
- Cowling BJ, Caini S, Chotpitayasunondh T, Djauzi S, Gatchalian SR, Huang QS, Koul PA, Lee P-I, Muttalif AR, Plotkin S. Influenza in the Asia-Pacific region: findings and recommendations from the global influenza initiative [J]. Vaccine. 2017;35(6):856–64. doi:10.1016/j.vaccine.2016.12.064.
- Paules CI, Marston HD, Eisinger RW, Baltimore D, Fauci AS. The pathway to a universal influenza vaccine[J]. Fauci, Immunity. 2017;47(4):599–603. doi:10.1016/j.immuni.2017.09.007.