
ABSTRACT
With the success of COVID-19 vaccines in clinical trials, vaccination programs are being administered for the population with the hopes of herd immunity. However, the success of any vaccination program depends on the percentage of people willing to get vaccination which is influenced by social, economic, demographic, and vaccine-specific factors. Thus, it is important to understand public attitudes and perceptions toward vaccination. This study aims to measure public attitude toward vaccines and vaccinations before and during the COVID-19 pandemic, using public data from Twitter. A total of 880,586 tweets for 57,529 unique users were included in the study. Most of the tweets were posted in five languages: French, English, Swedish, Dutch, and Italian. These tweets were divided into two time periods: before COVID-19 (T1) and during COVID-19 (T2). This study observed the shift in the sentiments of the public attitude toward vaccines before and during COVID-19 pandemic. Both positive and negative shifts in sentiments were observed for the users of various languages but shifts toward positive sentiments were more prominent during the COVID-19 pandemic.
Introduction
About 200 vaccines are developed against the severe acute respiratory syndrome coronavirus 2 (SARS-CoV-2).Citation1 Some of those vaccines have shown promising outcomes in human clinical trials, for example, Pfizer and Moderna have announced 95% and 94.5% efficacy;Citation2,Citation3 and are increasingly becoming available to the population. Nevertheless, the development of vaccines is only part of the solution. Coverage and acceptance of vaccines, among others, are still the major challenges.
In the past, vaccines have been an effective instrument of change in reducing mortality rates for various infectious diseases in the community, including eliminating poliomyelitis in America and controlling measles and rubella worldwide.Citation4 However, vaccine hesitancy remains to be a significant challenge for healthcare organizations.Citation5 The World Health Organization (WHO) highlights vaccine hesitancy as one of the top ten threats to global health.Citation6 The Strategic Advisory Group of Experts on Immunization (SAGE), an advisory group of WHO defines vaccine hesitancy as “a behavior of delaying or refusing vaccine despite its availability.”Citation7 Vaccine hesitancy poses a severe threat in achieving coverage for herd immunity. The proportion of required population to be vaccinated to achieve herd immunity against other infectious diseases such as polio and measles range between 80%-95%,Citation8 but this is unclear for COVID-19. Vaccination against COVID-19 is started in many countries; however, its acceptance rate is still lower than needed. In a survey conducted in 19 countries, the COVID-19 vaccine acceptance rate ranges from 55% to 90%.Citation9 Similar findings were also observed in studies conducted in other countries, where 49% to 65% acceptance rate was reported.Citation10–12
Public opinion might be influenced by social media posts about vaccine and vaccination and can be a contributing factor of vaccine hesitancy.Citation13 The popular microblog platform, Twitter, has up to 300 million active users, out of which 42% use the platform daily.Citation14 The ease of use and convenience of communication make Twitter a preferred source of public opinion, and therefore, it is a popular resource for research to monitor population level vaccine hesitancy.Citation15 Twitter data provides a rich source of opinions and sentiments that can be applied in multi-domain applications like market analysis, political issues, religious views, and the health surveillance monitoring system.Citation16,Citation17 Understanding sentiment of Twitter users talking about vaccines is convenient and useful way to explore public opinion on vaccines and vaccination. Sentiment analysis involves processing unstructured text to identify meaningful patterns and gain new insights. Sentiment analysis often leads to categorization of the text into positive, negative, and neutral classes.Citation18
In this paper, we analyzed vaccines related tweets to understand Twitter users’ attitude and perception about vaccines. We divided the tweets into two timeslots, before COVID-19 and during COVID-19 and measured public sentiments toward vaccines expressed on Twitter in these two timeslots. We observed the sentiment of users of different languages changed through these two timeslots. Both positive and negative shifts in sentiments were observed in users of various languages, but positive shifts were more prominent during the COVID-19 pandemic.
Method
Data collection
Vaccine related tweets were searched using Twitter Academic Research APICitation19 and downloaded through the Tweepy library.Citation20 The corresponding author has expertise in research on vaccine-related social media analysis. Hence, the identification of the relevant keywords relied on his prior knowledge in the domain. The search terms contained “vaccine*” or “immuniz*” or “immunis*” or “vax*” and were used to collect the vaccine-related tweets. These tweets were posted between August 2006 and February 2021, which consisted of a period before and during the COVID-19 pandemic. The downloaded data was processed to extract tweets and metadata such as the tweet ID, timestamp, text, author ID, number of likes, retweets, and replies, and the author’s profile information, including the number of followers, location and type of profile. The extracted data was stored in a PostgreSQL database. The IDs of tweets were used as the table primary keys to avoid duplicate entries of tweets. Although the search terms were English keywords, the downloaded data contained tweets in different languages.
Data pre-processing
The downloaded data was pre-processed to prepare for analysis. Firstly, retweets were removed from the data using string search, and tweets containing “RT @” string were removed. After that, we removed verified users such as celebrities, public figures, and government spokespersons and their tweets from the study data, which helped us to retain tweets from the general public only. This is because, the tweets from verified users are more optimistic and may not be representative of the population. A total of 52 languages were found within these tweets, out of which French, English, Dutch, Italian and Swedish were found to be the topmost used languages with majority of the tweets. Tweets in these five languages comprised 97% of all the tweets. The rest of the tweets (3%) were in other languages, which we ignored.
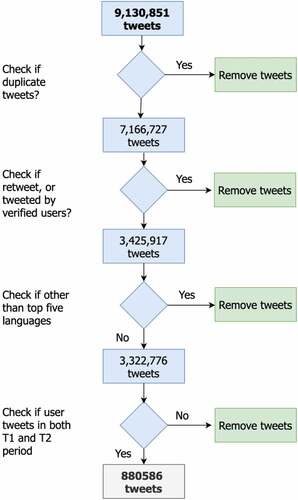
We performed text filtering in accordance with the data cleaning steps typically following in the literature.Citation21,Citation22 We removed punctuation, articles (e.g. a, an, the), and stop words (e.g., to, the, he, have, him) as they do not add much meaning to a sentence and can be ignored. We replaced the username mentions with “@username” in the tweets with an empty string to hide the identities of the users. Then the words were converted to their lemma form, using the WordNetLemmatizer module from the NLTK Python library.Footnotea We separated the data into two parts: T1 (tweeted from 30 August 2006 to 31 December 2019) and T2 (tweeted from 1 January 2020 to 18 February 2021). Finally, only those users who posted at least one tweet in both T1 and T2 were selected for the study. shows the steps included in the data pre-processing.
Figure 1. Selection criteria for screening of tweets.
Data analysis
We applied the SentiStrength library to find the sentiment of each tweet. SentiStrength is designed for social media text to find the strength (both positive and negative sentiment) of each word in a text following lexical approach.Citation23,Citation24 SentiStrength categories each tweet as positive or negative by assigning scores. The positive scores range from +1 (positive sentiment) to +5 (very strong positive sentiment) and the negative scores range from −1 (negative sentiment) to −5 (very strong negative sentiment).Citation25 For example, “Vaccine is good to prevent COVID-19” would be rated as positive (+3). On the contrary, “Vaccine has many side effects” would be labeled negative (−3). SentiStrength library is associated with a lexicon analysis where a lookup table is used. It also supports spelling correction, negation, emoticons, and booster words (e.g., very, hurrah, unlikely). SentiStrength identify and extract all words from the documents that match with their word collection (lookup table) and assign the polarity (+1 to +5 and −1 to −5 for positive and negative word) to each word in the documents. Then the sentiment score is calculated by adding all the words polarity. If overall score is greater than 0, it is rated as positive, and if overall score is less than 0, it is rated as negative. Similarly, if the overall score is 0, then it is rated as neutral. Moreover, if there are no words in the input text that match the words in the lookup table/lexicon terms, then the text is considered as neutral.
The core SentiStrength library is based on a collection of 2,608 words and word stems. There are two modes: supervised and unsupervised mode to find the sentiment.Citation26 In supervised mode, it employs training data set to adjust the weight of lexicon terms and predict sentiments scores. In unsupervised mode, the algorithm predicts the sentiment of input text based on pretrained model weight. In this study, we have utilized unsupervised mode of the SentiStrength model to predict the sentiment of each tweet. This quantification provides an interpretable insight into the perception of people about vaccines before and during the pandemic.
To find out the change of sentiment, we define the following transitions or shifts in the sentiment:
Positive to positive (P2P)
Positive to negative (P2N)
Positive to Neutral (P2U)
Negative to Positive (N2P)
Negative to Negative (N2N)
Negative to Neutral (N2U)
Neutral to Positive (N2P)
Neutral to Negative (N2N)
Neutral to Neutral (U2U)
shows the definitions for the shifts in the sentiments.
Figure 2. Definition of the shifts in sentiments. The shift is shown among the three states positive, negative, and neutral. N2P, U2P and N2U represent a positive shift in the sentiments. P2N, P2U and U2N represent a negative shift in the sentiments. U2U, N2N, and P2P represent a no shift scenario.
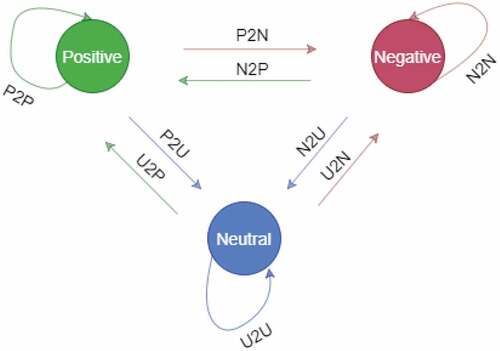
Finally, we measured the number of users whose sentiment shifted toward negative (P2U, P2N, U2N) and toward positive (N2P, U2P, N2U).
Results
Search results
A total of 9,130,851 vaccine-related tweets were retrieved between August 2006 and February 2021. While searching with keywords, many relevant search results were found to have repetition. We found 1,964,124 (21.5%) duplicate tweets and removed them. There were remaining 7,166,727 unique tweets. After that, we excluded retweets and tweets from the verified users. The number of retweets and tweets from the verified users was 3,740,810 (52.19%). The remaining 3,425,917 tweets were in many different languages. However, most of the tweets were in five languages, namely French, English, Dutch, Italian, and Swedish, and comprised 3,322,776 (97%) tweets, while 47 other languages formed only 100,141 (3%) tweets. In this study, we excluded the minor portion of tweets posted in 47 languages. The remaining tweets were divided into two time periods, T1 (before COVID-19) and T2 (during COVID-19). Since the study aims to identify the changing trends, tweets by only those users who had tweeted in both T1 and T2 timeslots were included. Hence, we removed 2,442,190 (73.39%) tweets for users who tweeted in either T1 or T2 but not in both. Finally, 880,586 tweets from 57,565 unique users of having tweets in both periods were included in this study (See for the steps involved in screening of the data).
A total of 57,565 unique users (880,586 tweets) for five different languages were included in this study, as presented in . More than half, 32,598 (56.6%) users and their tweets 524,541 (59.56%), were in French language. This was followed by 14,068 (24.45%) English users who posted 194,629 (22.1%) tweets, which was followed by 4,152 (7.2%) Dutch users who contributed 91,214 (10.35%) tweets.
Table 1. Number of tweets and number of unique users of selected languages.
Change of tweets over time
shows the frequency of vaccine related Tweets posted before and during COVID-19. It shows the period when vaccine topics reached top public concerns and how public sentiment shifted during the period. shows that there is a sharp skewness of negative sentiment in 2017 because pro-vaccine users discussed about the Measles outbreak.Citation27,Citation28 There is another peak in vaccine tweets in 2019 when users discussed about HPV vaccinesCitation29,Citation30 and measles vaccines to disseminate correct information about vaccines.Citation31
Figure 3. Change of Sentiment over time. (a) Before COVID-19 pandemic. (b) During COVID-19 pandemic.
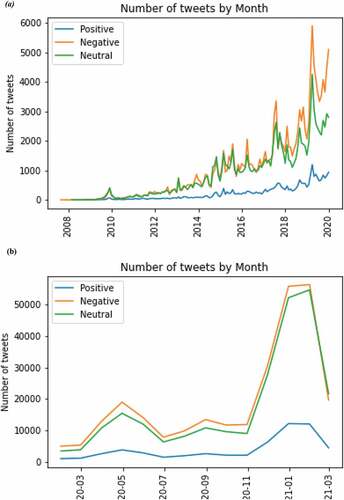
After the outbreak of COVID-19 around the world in March 2020, Twitter users discussed about the importance to find out effective vaccine to fight against Coronavirus.Citation32 In December 2020, Pfizer announced the first approval of human vaccines against COVID-19. During this period, users were concerned about the rapid development of vaccines and so the negative sentiment reached to peak level.Citation33
Sentiment analysis
In the following sub-sections, we present the sentiment analysis performed for the overall data and then for each language separately.
Sentiment shift in tweets
Initially, sentiment analysis was conducted on the entire dataset, without splitting them to timeslots. We observed that almost half 425,286 (48.29%) of the tweets were negative, and only 87,085 (9.89%) tweets were positive, and the rest 368,215 (41.8%) tweets were neutral. summarizes the overall results for positive, negative, and neutral tweets and shows the number of users with positive and negative shifts of sentiments. We also performed sentiment analysis for both periods T1 and T2, separately and compared them. In period T1, 29,460 (9.8%) tweets were positive, 151,157 (50.19%) tweets were negative, and the rest 120,526 (40%) tweets were neutral. In period T2, we found 57,625 (9.77%) tweets were positive, 274,129 (46.5%) tweets were negative, and 247,689 (42.02%) tweets were neutral.
Table 2. The sentiments for the overall tweets and the shift in sentiments.
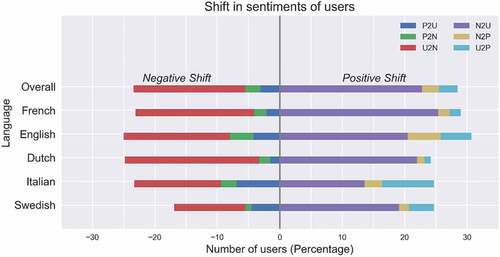
Further, we measured the number of users whose sentiments changed. Overall, in 57,729 unique users, we observed a reduction in the negative sentiments (see trends for positive and negative tweets shown in ). The overall change in the positive sentiments from period T1 to period T2 was prominent. Here, sentiments of 13,798 (24%) users shifted toward negative from period T1 to period T2 as P2U–2,062 (3.6%), P2N–2,013 (3.5%) and U2N–9,723 (16.9%). Whereas the sentiments of 16,976 (29.5%) users shifted toward positive from period T1 to period T2 as N2P–2,360(4.1) N2U–12,529 (21.8%) and U2P–2,087(3.6%). The percentage of users who had negative and positive shifts in the sentiments are summarized in .
Figure 4. Percentage distribution of positive and negative tweets in T1 and period T2. A clear trend of rise in proportion of positive tweets and a decline in proportion of negative tweets can be seen while moving from period T1 to T2.
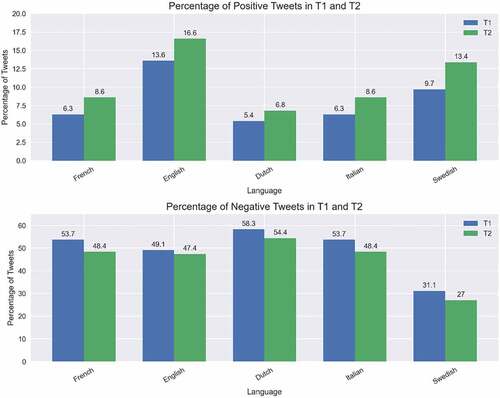
Figure 5. Number of users who demonstrated positive or negative in sentiments. Values are calculated in percentage. The length of the bar in each color corresponds to the percentage of users. For all the languages, the percentage of users showing positive shift exceeds the negative shift.
Sentiment shift based on language
We divided the twitter data according to languages. Then we performed sentiment analysis and observed the shift in the sentiment based on language of the tweet.
Results for French tweets
The highest number of tweets were found in the French language. It has been observed from that in the period T1, 8862 tweets were positive, making 6.3% of all the tweets. Whereas, in the period T2, 33,001 tweets were positive, which was 8.6% of all the tweets. In the period T1, we found 75,360 (53.7%) were negative, and in the period T2, we found 185,624 (48.4%) tweets were negative. The rest 56,205 (40%) tweets for the period T1 and 165,489 (43%) tweets for the period T2 remained unchanged.
Table 3. Sentiment results for French tweets.
We observed the shifts in the sentiments of the users from period T1 to period T2. In the period T2, sentiments of 9,679 (29.7%) users moved toward positive, sentiments of 995 (3%) users shifted from negative to positive (N2P), 7,921 (24.3%) shifted from negative to neutral (N2U), and 763 (2.3%) shifted from neutral to positive (U2P). Whereas in the period T2, sentiments of 7,634 (23.5%) users moved toward negative such that sentiments of 980 (3%) users shifted from positive to negative (P2N), 835 (2.6%) users shifted from positive to neutral (P2U), and 5,819(17.9%) shifted from neutral to negative (U2N). The sentiments of 15,285 (46.9%) users remain unchanged from period T1 to period T2.
We observed the location from where the users tweeted. We found that almost 95% of users were from France, and 5% of users were from Russia, Canada, Qatar, Palestine, Belgium, and Spain.
Results for English tweets
shows that for English language, 14.4% of tweets were positive, 36.8% of tweets were neutral, and 48.4% were negative. We observed that in the period T1, 15,774 (13.6%) tweets were positive, 57,239 (49.1%) tweets were negative, and 43,396 (37.3%) were neutral. Whereas in the period T2, 13,005 (16.6%) tweets were positive, 37,037 (47.4%) tweets were negative, and 28,178 (36%) tweets were neutral.
Table 4. Sentiment results for English tweets.
We measured the shifts in users’ sentiments from period T1 to period T2 for the English tweets. In the period T2, the sentiments of 3552 (31.5%) users shifted toward positive with N2P 1036 users (7.4%), U2P 756 users (5.4%), and N2U 2627 (18.7%). On another hand, sentiments of 1031 (25.2%) users shifted toward negative (with P2U 664 users (4.7%), P2N 719 users (5.1%), and U2N 2169 users (15.4%). A total of 43.3% of users hold same sentiment in both period T1 and T2.
We found the users who tweeted in English were from USA, UK, France, Australia, Canada, Sweden, New Zealand.
Results for Dutch tweets
provides the sentiments analysis of the Dutch language tweets where overall 5,962 (6.5%) tweets were positive, 50,357 (55.2%) tweets were negative, and 34,895 (38.3%) tweets were neutral. In the period T1, 974 (5.4%) tweets were positive, 10,573 (58.3%) tweets were negative and 6,577 (36.3%) were neutral. In the period T2, we found 4,988 (6.8%) tweets were positive, 39,784 (54.4%) tweets were negative, and 28,318 (38.8%) tweets were neutral.
Table 5. Sentiment results for Dutch tweets.
We measured the shifts in users’ sentiments from period T1 to period T2 for the Dutch language. In the period T2, the sentiments of 979 (23.6%) users shifted toward positive with N2P 93 users (2.2%), U2P 52 users (1.3%), and N2U 834 users (20.1%). On the other hand, sentiments of 1031 (24.9%) users shifted toward negative (with P2U 69 users (1.7%), P2N 114 users (2.8%), and U2N 848 (20.4%). A total of 51.6% of users showed no change in the sentiments during this period.
The majority of the tweets were posted from the Netherlands.
Results for Italian tweets
describes tweets posted in the Italian language where a total of 5,466 (18.6%) tweets were positive, 8,151 (27.7%) tweets were negative, and 15,764 (53.7%) tweets were neutral. In the period T1, 2,964 (18.2%) tweets were positive, 4,542 (27.1%) tweets were negative, and 8,789 (53.9%) were neutral, while in the period T2, 2,502 (19.1%) tweets were positive, 3,609 (27.6%) tweets were negative, and 6,975 (53.3%) tweets were neutral.
Table 6. Sentiment results for Italian tweets.
From period T1 to T2, the sentiments shifted toward positive for 27.2% of the users with a distribution of N2P 42% of the users, U2P 9.7% of the users, and N2U 13.3% of the users. The shift toward negative sentiments occurred for 26.7% of the users with a distribution of P2U 8.9% of the users, P2N 3.9%, and U2N 13.9% of the users.
Most of the users were from Italy. But there were also users from France, Spain, England, Scotland, and the Netherlands.
Results for Swedish tweets
represents the sentiment analysis in the Swedish language where overall 5,015 (12.3%) tweets were positive, 11,518 (28.2%) tweets were negative, and 24,288 (59.5%) tweets were neutral. In period T1, we found 1,168 (9.7%) tweets were positive, 3,758 (31.1%) tweets were negative, and 7,145 (59.2%) tweets were neutral. In period T2, we found 3,847 (13.4%) tweets were positive, 7,760 (27%) tweets were negative, and 17,143 (59.6%) tweets were neutral.
Table 7. Sentiment results for Swedish tweets.
We recorded a shift toward positive in the sentiments for 29.2% of the users. The positive shift was distributed as N2P 50 users (2.7%) users, U2P 129 users (5.4%) users, and N2U 672 users (21.1%) users. A shift toward negative was observed for 19.7% of users with a distribution of P2U 177 users (5.5%), P2N 59 users (1.8%), and U2N 394 users (12.4%).
Most of the users tweeted from Sweden. However, some of the users were from the Netherlands, Spain, and France.
Discussion
Principal findings
In this study, vaccine-related tweets were analyzed to determine the change of public attitudes toward vaccines during the outbreak of COVID-19. It is observed that the sentiments of about 29.5% (n = 16,976) Twitter users shifted toward positive, and the sentiments of 24% (n = 13,798) users shifted toward negative. The positive shift in sentiments is slightly higher than the negative shift. The analysis indicates that user’s during COVID-19 pandemic were more optimistic about the fight against COVID-19 pandemic and vaccination. On another hand, the users showing negative shift were more concerned about the safety, efficacy and the side effects of the vaccine. Misinformation on social media about the vaccination might be one reason of this reluctance. A study by the Center for Combating Digital Hate (CCDH) found that social media accounts associated with anti-vax supporters gained 7.8 million followers since 2019.Citation34 Interestingly, most of the users’ overall sentiments persisted the same in both periods and reflecting their negligence about pandemic.
Almost half of the tweets in the collected data were in French, indicating greater French participation in public debates, and reflecting their active concern about the vaccines. It might be one of the reasons that the French government, for example, has shared regular progress reports with the public on the vaccine clinical trials since the outbreak of COVID-19 began.Citation35 Therefore, French social media was more engaged in discussions about vaccines and the public proactively shared their opinion and attitude toward vaccine clinical trials.
We analyzed the shifts in sentiments both toward positive and negative in users from five different languages. For instance, shift in sentiment of French users, toward positive is 29.6%, and toward negative is 23.5%. For English, shift in sentiment toward positive is 31.5%, and toward negative is 25.2%. For Dutch, shift in sentiment toward positive is 24.59%, and toward negative is 23.5%. For Italian, shift in sentiment toward positive is 27.2%, and toward negative is 26.8%. Similarly, for Swedish, shift in sentiment toward positive is 29.1%, and toward negative is 19.9%. This analysis indicates that about 50% to 55% users’ sentiments changed either positively or negatively. The positive shift in users’ sentiments clearly reflect rising trends from period T1 to T2 for each of the five languages and indicating that people were more optimistic about vaccine development and safety. They were hopeful that vaccination could end the pandemic, release lockdown, and travel restrictions.
Practical implications
Social media paves the way to freedom of expression among public. Compared to offline surveys, social media provides a quick and easier way to record feedback and sentiments of the public. The measures of governments worldwide for vaccination of their population against COVID-19 have received mixed responses from the public. The sentiment analysis of the public by using publicly available Twitter data can help to understand the concerns of the population regarding the COVID-19 vaccination.Citation36 This in turn may help governments and healthcare agencies to devise better strategies to address the concerns and to design COVID-19 policies.Citation37 Similarly, this analysis of the public attitudes toward vaccine and vaccination would help the health organization to get an insight on the shift in the public sentiments and devise better awareness campaigns.Citation38 Furthermore, this study shows that continuous research on this topic is the need of time to understand the changing trends in the sentiments and the factors influencing those changes.
Limitations
While measuring public sentiment toward vaccines, this study has some limitations. Firstly, the study reflects the sentiments of the public engage in discussions on Twitter. Consequently, the public who do not post on Twitter or public who posted only in either T1 or T2 is left out.
Secondly, the search keywords used in this study to find vaccine-related tweets might not provide an exhaustive search. The output results for search before 2020 and after 2020 are not equal. Therefore, measuring the shift of sentiment may not be appropriate. Thirdly, in this study, tweets in only five languages were considered while other languages were excluded. So, any interpretation of the results presented should be made in the context of geographical, social, and cultural considerations. In our results, we found half of the tweets were neutral. The lookup table of SentiStrength is based on the general and daily use language. The SentiStrength library assigns the polarity to each word in the input tweet if it is available in the lookup table of the library. However, words outside the library are treated as neutral. Hence, it is possible that the SentiStrength library could not detect the sentiment accurately for complex phrases and language and could assign incorrect sentiment polarity to some of the tweets. Moreover, our tweets were unlabeled. Therefore, we utilized unsupervised SentiStrength library to classify the sentiments of the tweets and hence, our results do not include evaluation of the performance of the SentiStrength library on our data. Hence, we rely on the previous benchmark for the performance of the SentiStrength.Citation25,Citation39 Finally, only social media platforms may not represent the complete image of a demographic region because many people do not use social media. This study considers only Twitter data and social media platforms like Facebook, Instagram, Reddit, WhatsApp, in which people are also active were not considered. The opinions expressed by Twitter users may vary due to geographic location, culture, and political condition. However, these factors were not explicitly considered in this study.
Conclusion
The outcomes of a vaccination program depend on confidence in the vaccine. Therefore, public sentiments toward the vaccine drive the acceptability of the vaccine. In this connection, Twitter has proved to be a quick and easy way for people to express their sentiments about the COVID-19 vaccination. Since the beginning of the COVID-19 pandemic, the platform has underseen a rise in posts related to the pandemic and the vaccinations. The analysis of these posts presented in this work provided a way to find the positive and negative sentiments of the public. It also highlighted the changing trends of these sentiments. Further research into the analysis of such data on COVID-19 related posts is the need to devise strategies for raising awareness and reaching out to the public to address their concerns on the vaccine.
Acknowledgements
Open Access funding provided by the Qatar National Library.
Disclosure statement
No potential conflict of interest was reported by the author(s).
Additional information
Funding
Notes
References
- Parker EPK, Shrotri M, Kampmann B. Keeping track of the SARS-CoV-2 vaccine pipeline. Nat Rev Immunol. 2020;20(11):1. doi:10.1038/s41577-020-00455-1.
- Voysey M, Clemens SAC, Madhi SA, Weckx LY, Folegatti PM, Aley PK, Angus B, Baillie VL, Barnabas SL, Bhorat QE, et al. Safety and efficacy of the ChAdox1 nCov-19 vaccine (AZD1222) against SARS-CoV-2: an interim analysis of four randomised controlled trials in Brazil, South Africa, and the UK. Lancet. 2021;397(10269):99–10. doi:10.1016/S0140-6736(20)32661-1.
- Polack FP, Thomas SJ, Kitchin N, Absalon J, Gurtman A, Lockhart S, Perez JL, Pérez Marc G, Moreira ED, Zerbini C, et al. Safety and efficacy of the BNT162b2 mRNA Covid-19 vaccine. N Engl J Med. 2020;383(27):2603–2615. doi:10.1056/nejmoa2034577.
- Centers for Disease Control and Prevention. Ten great public health achievements – United States, 1900-1999. Morbidity and Mortality Weekly Report. Published 1992. https://www.cdc.gov/mmwr/preview/mmwrhtml/00056796.htm%0Ahttps://www.cdc.gov/mmwr/preview/mmwrhtml/00056796.htm%0Ahttps://www-jstor-org.libproxy.temple.edu/stable/23309163?pq-origsite=summon&seq=1#metadata_info_tab_contents%0Ahttps://www.cdc.gov/mmwr/prev.
- Larson HJ, Jarrett C, Eckersberger E, Smith DMD, Paterson P. Understanding vaccine hesitancy around vaccines and vaccination from a global perspective: a systematic review of published literature, 2007-2012. Vaccine. 2014;32(19):2150–2159. doi:10.1016/j.vaccine.2014.01.081.
- Scheres J, Kuszewski K. The Ten threats to global health in 2018 and 2019. A welcome and informative communication of WHO to everybody. Zdr Publiczne I Zarządzanie. 2019;17(1):2–8. doi:10.4467/20842627oz.19.001.11297.
- MacDonald NE, E J, Liang X, SAGE Working Group on Vaccine Hesitancy. Vaccine hesitancy: definition, scope and determinants. Vaccine. 2015;33(34):4161–4164. doi:10.1016/j.vaccine.2015.04.036.
- Lytras T, Tsiodras S. Lockdowns and the COVID-19 pandemic: what is the endgame? Scand J Public Health. 2021;49(1):37–40. doi:10.1177/1403494820961293.
- Lazarus JV, Ratzan SC, Palayew A, Gostin LO, Larson HJ, Rabin K, Kimball S, El-Mohandes A. A global survey of potential acceptance of a COVID-19 vaccine. Nat Med. 2021;27(2):225–228. doi:10.1038/s41591-020-1124-9.
- Neergaard L, Fingerhut H. AP-NORC poll: half of Americans would get a COVID-19 vaccine. Assoc Press Retrieved Sept. 2020;10:2020.
- Murphy J, Vallières F, Bentall RP, Shevlin M, McBride O, Hartman TK, McKay R, Bennett K, Mason L, Gibson-Miller J, et al. Psychological characteristics associated with COVID-19 vaccine hesitancy and resistance in Ireland and the United Kingdom. Nat Commun. 2021;12(1):1–16. doi:10.1038/s41467-020-20226-9.
- Saied SM, Saied EM, Kabbash IA, Abdo SAEF. Vaccine hesitancy: beliefs and barriers associated with COVID-19 vaccination among Egyptian medical students. J Med Virol. 2021;93(7):4280–4291. doi:10.1002/jmv.26910.
- Piedrahita-Valdés H, Piedrahita-Castillo D, Bermejo-Higuera J, Guillem-Saiz P, Bermejo-Higuera JR, Guillem-Saiz J, Sicilia-Montalvo JA, Machío-Regidor F. Vaccine hesitancy on social media: sentiment analysis from June 2011 to April 2019. Vaccines. 2021;9(1):1–12. doi:10.3390/vaccines9010028.
- Number of monetizable daily active international Twitter users (mDAU). [accessed 2021 Sep 2]. https://www.statista.com/statistics/970920/monetizable-daily-active-twitter-users-worldwide/.
- Piñeiro Pérez R, Hernández Martín D, Carro Rodríguez MÁ, de la Parte Cancho M, Casado Verrier E, Galán Arévalo S, Carabaño Aguado I. Consulta de asesoramiento en vacunas: el encuentro es posible. Anales de Pediatría. 2017;86(6):314–320. doi:10.1016/j.anpedi.2016.06.004.
- Kamyab M, Tao R, Mohammadi MH, Rasool A. Sentiment analysis on Twitter: a text mining approach to the Afghanistan status reviews. ACM Int Conf Proceeding Ser. 2018;9(4):14–19. doi:10.1145/3293663.3293687.
- Ramamoorthy T, Karmegam D, Mappillairaju B. Use of social media data for disease based social network analysis and network modeling: a systematic review. Informatics Heal Soc Care. 2021;46(4):443–454. doi:10.1080/17538157.2021.1905642.
- Yadollahi A, Shahraki AG, Zaiane OR. Current state of text sentiment analysis from opinion to emotion mining. ACM Comput Surv. 2017;50(2). doi:10.1145/3057270.
- Twitter. Twitter API for Academic Research | Products | Twitter Developer Platform. [accessed 2021 May 30]. https://developer.twitter.com/en/products/twitter-api/academic-research.
- Tweepy. [accessed 2021 May 30]. https://www.tweepy.org/.
- Abd-Alrazaq A, Alhuwail D, Househ M, Hai M, Shah Z. Top concerns of tweeters during the COVID-19 pandemic: a surveillance study. J Med Internet Res. 2020;22(4):e19016. doi:10.2196/19016.
- Kim EHJ, Jeong YK, Kim Y, Kang KY, Song M. Topic-Based content and sentiment analysis of Ebola virus on Twitter and in the news. J Inf Sci. 2016;42(6):763–781. doi:10.1177/0165551515608733.
- Sentistrength. [accessed 2021 May 30]. http://sentistrength.wlv.ac.uk/.
- Thelwall M, Buckley K. Topic-Based sentiment analysis for the social web: the role of mood and issue-related words. J Am Soc Inf Sci Technol. 2013;64(8):1608–1617. doi:10.1002/asi.22872.
- Thelwall M, Buckley K, Paltoglou G. Sentiment strength detection for the social web. J Am Soc Inf Sci Technol. 2012;63(1):163–173. doi:10.1002/asi.21662.
- Orasan C Aggressive language identification using word embeddings and sentiment features. COLING 2018 - 1st Work Trolling, Aggress Cyberbullying, TRAC 2018 - Proc Work. Published online 2018:113–119.
- Gunaratne K, Coomes EA, Haghbayan H. Temporal trends in anti-vaccine discourse on Twitter. Vaccine. 2019;37(35):4867–4871. doi:10.1016/j.vaccine.2019.06.086.
- Deiner MS, Fathy C, Kim J, Niemeyer K, Ramirez D, Ackley SF, Liu F, Lietman TM, Porco TC. Facebook and Twitter vaccine sentiment in response to measles outbreaks. Health Informatics J. 2019;25(3):1116–1132. doi:10.1177/1460458217740723.
- Jamison AM, Broniatowski DA, Dredze M, Sangraula A, Smith MC, Quinn SC. Not just conspiracy theories: vaccine opponents and proponents add to the COVID-19 ‘infodemic’ on Twitter. Harvard Kennedy Sch Misinformation Rev. Published online 2020. doi:10.37016/mr-2020-38.
- Himelboim I, Xiao X, Lee DKL, Wang MY, Borah P. A social networks approach to understanding vaccine conversations on Twitter: network clusters, sentiment, and certainty in HPV social networks. Health Commun. 2020;35(5):607–615. doi:10.1080/10410236.2019.1573446.
- Kullar R, Goff DA, Gauthier TP, Smith TC. To Tweet or Not to Tweet—a review of the viral power of twitter for infectious diseases. Curr Infect Dis Rep. 2020;22(6). doi:10.1007/s11908-020-00723-0.
- Durmaz N, Hengirmen E. The dramatic increase in anti-vaccine discourses during the COVID-19 pandemic: a social network analysis of Twitter. Hum Vaccin Immunother. 2022;18(1):1–13. doi:10.1080/21645515.2021.2025008.
- Joshi A, Kaur M, Kaur R, Grover A, Nash D, El-Mohandes A. Predictors of COVID-19 vaccine acceptance, intention, and hesitancy: a scoping review. Front Public Heal. 2021;9(August). doi:10.3389/fpubh.2021.698111.
- Burki T. The online anti-vaccine movement in the age of COVID-19. Lancet Digit Heal. 2020;2(10):e504–e505. doi:10.1016/s2589-7500(20)30227-2.
- Schultz É, Ward JK, Atlani-Duault L, Holmes SM, Mancini J. French public familiarity and attitudes toward clinical research during the covid-19 pandemic. Int J Environ Res Public Health. 2021;18(5):1–15. doi:10.3390/ijerph18052611.
- Han G, Zhu D, Kothari N. Strategic use of Twitter as a source of health information: a pilot study with textual analysis of health tweets. Informatics Heal Soc Care. 2019;44(4):422–437. doi:10.1080/17538157.2019.1656207.
- Maddux JE, Rogers RW. Protection motivation and self-efficacy: a revised theory of fear appeals and attitude change. J Exp Soc Psychol. 1983;19(5):469–479. doi:10.1016/0022-1031(83)90023-9.
- Alhajji M, Abdullah MM. Sentiment analysis of tweets in Saudi Arabia regarding governmental preventive measures to contain COVID-19. Preprints. 2020;(April)16. doi:10.20944/preprints202004.0031.v1.
- Thelwall M. The heart and soul of the web? Sentiment strength detection in the social web with SentiStrength. Published online 2017:119–134. doi:10.1007/978-3-319-43639-5_7.