
ABSTRACT
This study assessed the cost-effectiveness of the 20-valent pneumococcal conjugate vaccine (PCV20) in Canadian infants aged <2 years versus the standard of care (SoC), a 13-valent pneumococcal conjugate vaccine (PCV13), or a potential 15-valent pneumococcal conjugate vaccine (PCV15). A decision-analytic Markov model was developed to compare PCV20 with PCV13 or PCV15 in a 2 + 1 schedule over 10 years. Vaccine effect estimates (direct and indirect) across all ages were informed by PCV13 clinical effectiveness and impact studies as well as PCV7 efficacy studies. Epidemiologic, clinical, health state utilities, utility decrements, cost per event, and list price data were from Canadian sources where available. Clinical and economic outcomes related to invasive pneumococcal disease (IPD), hospitalized and non-hospitalized pneumonia, and simple and complex otitis media (OM) were calculated for each strategy. Cost-effectiveness was evaluated from the publicly funded healthcare system perspective. Over 10 years, PCV20 versus PCV13 was estimated to avert over 11,000 IPD cases, 316,000 hospitalized and non-hospitalized pneumonia cases, 335,000 simple and complex OM cases, and 15,000 deaths, resulting in cost savings of over 3.2 billion Canadian dollars (CAD) and 47,000 more quality-adjusted life years (i.e. dominant strategy). Compared with PCV15, PCV20 was estimated to result in over 1.4 billion CAD in cost savings and 21,000 more QALYs (i.e. dominant strategy). PCV20 was dominant over both PCV13 and PCV15. Given broader serotype coverage, substantial incremental benefits and cost-savings, PCV20 should be considered as a replacement for the SoC in the publicly funded Canadian infant immunization program.
Introduction
Streptococcus pneumoniae (S. pneumoniae) continues to be an important public health concern worldwide.Citation1 Pneumococcal disease is associated with high morbidity and mortality, particularly in young infants and the elderly.Citation2 Pneumococcal conjugate vaccines (PCVs) developed to help prevent disease in infants and toddlers have proven to elicit a robust and long-lasting immune response not only in the pediatric population but also in the adult population.Citation3
PCVs have had an impact in reducing the pneumococcal disease burden when used as a part of a routine immunization program in children aged <2 years.Citation4–7 The use of the 7-valent PCV (PCV7) in the pediatric immunization program in Canada beginning in 2001 substantially decreased the incidence of invasive pneumococcal disease (IPD).Citation4 A 10-valent PCV (PCV10) was introduced in some provinces in 2009, followed by a switch to a 13-valent PCV (PCV13)Citation8 in 2010, which was followed by further reductions in the incidence of IPD. Following the implementation of publicly funded pediatric immunization programs, the incidence of IPD in children aged <2 years decreased from 73 cases per 100,000 population in 2003 to 16.2 cases per 100,000 population in 2019.Citation9 While PCV13 vaccine-type incidence has substantially decreased following the implementation of publicly funded programs,Citation4,Citation10 non-vaccine serotype incidence remains, causing the majority of the remaining disease cases in Canada.Citation4
In July 2022, a 15-valent PCV (PCV15), which includes 2 serotypes (22F and 33F) in addition to the 13 serotypes included in PCV13, was approved by Health Canada for the active immunization of infants, children and adolescents aged from 6 weeks to 17 years for the prevention of IPD. In May 2022, Prevnar 20™, a 20-valent PCV (Diphtheria CRM197 Protein) developed by Pfizer, was approved by Health Canada for the prevention of pneumococcal disease in adults aged ≥18 years caused by serotypes 1, 3, 4, 5, 6A, 6B, 7F, 8, 9 V, 10A, 11A, 12F, 14, 15B, 18C, 19A, 19F, 22F, 23F, and 33F. PCV20 is expected to be approved for use in children and adolescents aged 6 weeks to 17 years in 2023.
Following the approval of new vaccines, economic evaluations assessing the public health impact and economic value of publicly funded programs can help better inform programmatic decision making and routine immunization recommendations. Therefore, in this economic evaluation, we assessed the cost-effectiveness of PCV20 in a 2 + 1 schedule (two primary doses plus one booster dose) as a vaccination strategy in Canadian infants aged <2 years versus the current standard of care (SoC, PCV13 2 + 1). Additionally, we assessed the cost-effectiveness of PCV20 versus PCV15.
Methods
Model description
A decision-analytic Markov (state-transition) model of vaccination for pneumococcal disease was developed to evaluate the potential public health and economic impact of switching from the current SoC (PCV13 in a 2 + 1 schedule) to PCV20 in infants (). Given the recent approval of PCV15 in this age group in Canada,Citation11 we also compared PCV20 versus PCV15. In the model, two primary series doses occur in the first year of life and a booster dose occurs in the second year of life. The entire Canadian population was included to capture the full benefits of the vaccine. The direct effects of vaccination occur immediately in the vaccinated population, while the indirect effects (i.e., herd immunity) gradually accrue in the population over the time horizon of the model.
Figure 1. Model schematic.
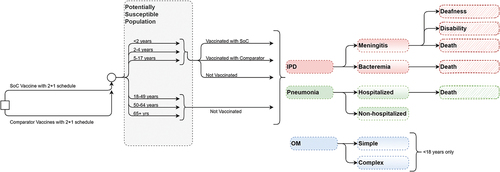
The Markov model tracks pneumococcal disease-related events in one of the following 2 vaccination states: (1) unvaccinated and (2) vaccinated. The transition probabilities associated with the vaccinated Markov states are specific to the vaccine strategy and age. Transitions between Markov states occur at one-year intervals. Within each annual cycle, persons may transition to a disease state, including IPD, pneumonia, OM, or no pneumococcal disease. Cases of pneumonia are classified as either hospitalized or non-hospitalized, and cases of OM are classified as either simple or complex. During each model cycle, persons may survive or die from IPD, inpatient pneumonia, or other causes. Those who survive return to the appropriate Markov state depending on the vaccination status and time since vaccination and age one year per cycle. At the beginning of each model cycle, an incoming birth cohort enters the model, and a new cohort of children is vaccinated.
Target population
The target population for vaccination considered in the model comprises children aged <2 years. The primary doses are administered at 2 and 4 months, and a booster is administered at 16 months. In the model, the population is stratified into one-year age groups to capture age-specific event probabilities, utilities, costs, and mortality, which differ by age. Children aged <5 years are divided into five one-year age groups (<1 year, 1–2 years, 2–3 years, 3–4 years, and 4–5 years), but the event probabilities are stratified according to 2 overall age groups (<2 year and 2–4 years) to capture the vaccine direct effects and dosing schedule. Persons aged ≥5 years are also stratified into one-year age groups, but the event probabilities are stratified according to 4 overall age groups (5–17 years, 18–49 years, 50–64 years, and >65 years) to appropriately capture differences in epidemiology, costs, and indirect effects. All adults are considered unvaccinated in the model. The maximum age in the model is 100 years. The outcomes modeled are reflective of the entire Canadian population.
Time horizon, perspectives and discounting
Previous studies have shown that following the introduction of PCV7 and PCV13 in infants, the indirect effects in those unvaccinated accrue over time and stabilize within 5–10 years after PCV implementation.Citation12,Citation13 Therefore, we adopted a 10-year time horizon and simulated ten successive birth cohorts to capture the full benefits of an infant PCV program.
This study adopted the following two perspectives according to the National Advisory Committee on Immunization (NACI) guidance: the publicly funded health system perspective (i.e., payer perspective) and the societal perspective. The payer perspective only includes direct medical costs, while the societal perspective includes indirect costs, such as caregivers’ productivity loss.
In the base case, discount rates of 1.50% are applied to both the health outcomes and costs, while in the sensitivity analysis, discount rates of 0% and 3% are applied to the health outcomes and costs, respectively. All discount rates were based on recommendations by the NACI.Citation14
Inputs
The key model inputs are summarized in and the input values are provided in supplemental Tables S1–S13 Detailed descriptions of the key model inputs are provided below.
Table 1. Key model inputs.
Disease incidence
The age-specific annual incidence rates of each disease are specified in the model at a rate per 100,000 population (Table S1) and were informed by national-level data and the published literature. The estimates of the IPD incidence (including meningitis and bacteremia) by age group were based on data from 2019 published by the Notifiable Diseases Online tool, which uses annual data from the Canadian Notifiable Disease Surveillance System from the Public Health Agency of Canada (PHAC).Citation15
To estimate the proportion of IPD cases that were meningitis, incidence estimates from Hsu et al.Citation40 were applied to incidence data available from the Centers for Disease Control and Prevention (CDC) and Active Bacterial Core Surveillance (ABC).Citation12 The proportion of IPD cases that were meningitis was 7% across all age groups, and the proportion of IPD cases that were bacteremia was calculated as 93% (one minus the proportion of meningitis cases in each age group).Citation40 The incidence of hospitalized and non-hospitalized pneumonia and simple and complex OM between 2011 and 2018 were informed by a population-based analysis in British Columbia assessing the impact of PCV13.Citation16,Citation17
Long-term complications
The proportion of patients who develop long-term complications from meningitis, including deafness (13%) and disability (7%), was informed by Lieu et al.Citation18 No sequelae of bacteremia and noninvasive diseases were considered.
Mortality
General mortality was informed by the life tables reported by Statistics Canada.Citation19 The 2019 ABC’s report by the CDC provides estimates of the mortality of IPD,Citation12 and the same estimates were assumed to apply to meningitis and bacteremia. Data from Rubin et al.Citation20 were used to inform the infant case fatality rate of hospitalized pneumonia, while data from Averin et al.Citation21 were used to estimate the case fatality rate in the adult population (Table S2). No mortality was assumed for non-hospitalized pneumonia or OM.
Vaccine effects
Unlike PCV7, which was licensed based on clinical efficacy data, PCV13 and PCV15 were licensed based on immunogenicity data for the pediatric indication; PCV20 will also be licensed based on immunogenicity data. With 20 years of PCV use worldwide, there are high-quality observational PCV clinical effectiveness and impact studies that can be used to estimate the direct and indirect effects of higher-valent vaccines. The details of the sources and assumptions are outlined below.
Direct effect
For IPD, the direct effect of PCVs is modeled in the base case using data from a recent multicenter study designed to investigate the vaccine effectiveness of PCV10 and PCV13 against IPD in 12 sites in nine European countries.Citation6 In the base case, we assumed that all vaccine serotypes have a direct effect against VT-IPD of 88.7% (Table S3).
For noninvasive disease (hospitalized pneumonia, non-hospitalized pneumonia, simple OM, and complex OM), we employed a common approach used in cost-effectiveness analysesCitation41–45 to calculate the direct effect of the higher-valent PCVs against all-cause pneumonia and OM. The efficacy against radiographically confirmed pneumonia (based on the World Health Organization classification) is 25.5%.Citation22 This estimate was used for hospitalized pneumonia and was adjusted by the ratio of the serotype coverage of the higher-valent PCVs to the serotype coverage of PCV7 at the time of the original clinical trial (see Table S4 for serotype distribution). The estimates of efficacy against non-hospitalized pneumonia (6%),Citation23 simple OM (6.4%),Citation24 and complex OM (12.3%)Citation24 were also derived from PCV7 trial data (Table S3), and differences in serotype coverage were adjusted in a similar manner.
Each vaccine is assumed to have a full direct effect for 5 years after the final dose, and then, the vaccine effect wanes by 10% annually to 58% of the original effect by year 10. The maximum duration of protection is 10 years after the final dose.
Indirect effect
We assume indirect effects against all disease manifestations but not all age groups. For non-hospitalized pneumonia, indirect effects are only assumed in the <18 years age groups; for simple OM and complex OM, indirect effects are only assumed in the <5 years age groups. For IPD and hospitalized pneumonia, indirect effects are assumed in all age groups. We used observational PCV13 impact data to inform the incidence reduction in the newly covered serotypes.Citation25,Citation26,Citation27,Citation46
The indirect effects on PCV13 serotypes are in a steady state under the SoC. However, the indirect effects on newly covered serotypes in higher-valent vaccines (i.e., PCV15 and PCV20) occur gradually over the time horizon of the model until a new steady state is reached. The accrual of the indirect effects of higher-valent PCVs was informed by IPD surveillance data from the PHAC National Microbiology Laboratory.Citation15 The rate at which indirect effects are accrued until a new steady state is reached is reported in Table S5. All disease states (IPD, hospitalized pneumonia, non-hospitalized pneumonia, simple OM, and complex OM) were assumed to have the same accrual of indirect effects. In all age groups, the maximum reduction in IPD incidence for the additional serotypes in higher-valent PCVs was informed by PCV13-7-ST3 serotype group surveillance data from Canada (PHAC National Microbiology Laboratory)Citation15 (Table S6).
Vaccine uptake
The vaccine uptake applied in the base case for both the priming series and the booster dose of all comparators (full 2 + 1 schedule) was 84% based on the 2019 Childhood National Immunization Coverage Survey published by Statistics Canada,Citation28 which showed an 84% vaccination series (a three dose series) completion rate among 2-year-olds.
Utilities
The age- and sex-specific general population utilities were informed by Janssen et al.Citation29 and the proportion of females in the population was assumed to be 50%. The model applies a QALY multiplier to the general population utilities based on the age of the cohort (Table S7). The quality of life (QoL) multiplier estimates for IPD and noninvasive disease were obtained from Tang et al.Citation30 who conducted a review of health-related QoL estimates associated with pneumococcal disease and reported pooled QALY estimates by age and pneumococcal disease state. The lifetime utility decrements due to sequelae were informed by Oostenbrink et al.Citation47 and Erickson et al.Citation48 (Table S8).
Resource use and costs
The model considers costs in CAD. For cost inputs obtained from US sources, a conversion rate of US dollars to CAD of 1.2655 was used, which was the average exchange rate published by the Bank of Canada between June 29, 2021 and June 28, 2022. The costs are reported as 2022 estimates.
The model considers the following three categories of direct medical costs: vaccine costs (Table S9), medical resource costs (Table S10), and lifetime medical costs of long-term complications (Table S11). Vaccine costs included the costs of PCV13,Citation31 PCV20,Citation31 and PCV15Citation32 at list prices and the cost of vaccine administration.Citation33 Indirect costs included the productivity loss incurred by caregivers of infected infants or patients in the older age groups.
The age-specific direct medical resource costs per acute episode of IPD, hospitalized pneumonia, and complex OM were informed by Canadian Institute for Health Information data from 2019.Citation34 The costs for meningitis due to IPD were available for almost all age groups, except for the 2–4 years; therefore, it was assumed that the 2–4 years age group had the same costs as the <2 years age group. Age-specific medical costs per episode of non-hospitalized pneumonia and simple OM were unavailable in Canada. Therefore, US dataCitation35,Citation36 were used, inflated to 2022 estimates using the medical care component of the consumer price inflation index as published by the Bureau of Labor Statistics from the US Department of Labor,Citation49 and exchanged to CAD estimates using a conversion rate of US dollars to CAD of 1.2655.
The age-specific lifetime medical costs of long-term complications from IPD were unavailable in Canada. Therefore, US dataCitation37 inflated to 2022 estimates and exchanged to CAD as described above were used. Lifetime medical costs per episode of long-term complications are applied as one-time costs in the model.
The indirect non-medical costs per episode of disease were calculated based on the productivity loss incurred by caregivers of infected infants or patients in the older age groups (Table S12). The age-specific average length of hospitalization was informed by the 2016/2017 Ontario Case Costing InitiativeCitation38 and was used to determine the number of working hours missed while in the hospital, with one day equating to 7.46 hours of work missed (based on 37.3 average weekly hours worked as reported by Statistics Canada divided by five working days). Following Wilson et al.,Citation39 an additional loss of five workdays (37.3 working hours) was added to these estimates.Citation38 The number of workdays lost due to non-hospitalized pneumonia and OM was obtained from Wilson et al.Citation39 Statistics Canada reports that 64.7% of the population are members of the workforce.Citation50 To account for those who may not be employed at the time of illness, only 64.7% of caregivers or patients were assumed to miss work because of an episode of pneumococcal disease. Therefore, the total hours of lost productivity per disease case was a product of the number of working hours missed and the proportion of caregivers or patients missing work. The average weekly wage in Canada was divided by the average number of hours worked in a week,Citation51 resulting in an estimated average hourly wage in Canada of CAD $34.01.
Model outcomes
The model generates estimates of the cumulative costs associated with vaccination with the SoC, PCV15, and PCV20 from both the payer and societal perspectives. The cost measures include direct medical costs (i.e., the costs of vaccination, costs of treating pneumococcal disease, and medical costs of managing long-term sequelae) and societal costs (i.e., productivity loss). For each comparator, the model generates estimates of the following: (a) the number of pneumococcal disease cases by IPD (meningitis and bacteremia cases), pneumonia (hospitalized and non-hospitalized cases), and OM (complex and simple OM cases); (b) number of deaths; (c) costs by the cost of the vaccine, cost of the disease and cost of sequelae; (d) life years (calculated by summing all person-years in all states excluding deceased individuals); (e) QALYs (calculated by weighting the time in each health state by the associated health state utility and summing over time); and (f) incremental cost-effectiveness ratios (ICERs; calculated by comparing SoC, PCV15, and PCV20 and calculating the additional cost per additional health benefit in terms of the cost per QALY gained and cost per life year saved). All cost and QALY calculations accounted for lifetime sequelae.
Sensitivity and scenario analyses
We tested the robustness of results using standard methods in health economic analysis: one-way deterministic sensitive analysis (DSA), second-order stochastic probabilistic sensitivity analysis (PSA), and deterministic scenario analysis.Citation52 First, all major model variables were tested in a DSA to identify the model parameters that drive results and therefore present important areas of uncertainty. In the DSA, only PCV13 was applied as the SoC because that is the current SoC; however, the DSA results are expected to be similar for PCV15. When possible, confidence intervals (CIs) were used as the the upper and lower bounds tested, but when not available, bounds were calculated as ± 10% of the mean value. One-way sensitivity analysis was conducted for all model variables including vaccination effectiveness (both direct and indirect effect), incidence of disease (including complication rates as relevant), probability of sequelae, case fatality rate, direct medical costs per episode of each disease outcome, vaccine price and administration cost, and utility decrements. These parameters were all specific to each age group in the DSA.
In order to examine the impact of uncertainty in all parameters jointly, a PSA was performed where each parameter was drawn from a distribution with 1,000 iterations. This PSA provides an estimated range of incremental cost and health outcomes results when jointly accounting for uncertainty in all parameters. Typical probability distributions were used in the analyses following Briggs et al.Citation52 A beta distribution confined by the interval 0–1 was used for inputs, such as proportions and utility values. A gamma distribution confined by the interval 0–infinity was used for costs. When possible, CIs or standard errors (SEs) were used to provide quantified information regarding the parameter uncertainty of a particular input. In the absence of CIs or SEs, upper and lower bounds were used and calculated as ±20% of the point estimate.
In order to test key uncertainty not addressed in either the DSA or PSA, several specific scenario analyses were conducted. Following NACI guidance, discount rates of 0% and 3% were tested.Citation14 The following three alternative methods of computing direct vaccine effects were considered: IPD efficacy-based approach (i.e., using PCV7 serotype specific efficacy data), including cross-protection for serotype 6C, and including cross-protection for serotype 15C. Additional reductions in the price of PCV15 of −10% and −20% were applied to assess any impact on the overall results. The waning profile of PCVs in children is currently unknown; therefore, in the base-case analysis, a 10% decline in the vaccine effect was applied yearly to conservatively account for waning. In a scenario analysis, vaccine waning was adjusted to full vaccine protection for the first 10 years. A scenario with a hypothetical adult vaccination program with 40% uptake of PCV20 in adults 65 and over was considered. Finally, the accrual rate was adjusted to be the same in children and adults.
Results
Base-case results
PCV20 provided the greatest estimated health benefits in terms of the incremental number of cases averted and QALYs gained (). Compared with PCV13, PCV20 averted 11,255 cases of IPD, 219,232 cases of hospitalized pneumonia, 97,361 cases of non-hospitalized pneumonia, 4,362 cases of complex OM, and 331,424 cases of simple OM. Additionally, vaccination with PCV20 averted an estimated 15,680 deaths due to disease across all ages. Compared with PCV15, PCV20 averted 5,559 cases of IPD, 102,976 cases of hospitalized pneumonia, 41,301 cases of non-hospitalized pneumonia, 2,090 cases of complex OM, 153,665 cases of simple OM, and 7,266 deaths due to disease.
Table 2. Impact of PCV20 versus PCV13 as SoC over 10 years.
Table 3. Impact of PCV20 versus PCV15 as SoC over 10 years.
PCV20 averted more cases of IPD and noninvasive hospitalized pneumonia than PCV13 in all age groups, with the greatest impact observed in the >65 years age group (7,519 cases of IPD and 184,018 cases of noninvasive hospitalized pneumonia averted). PCV20 averted more cases of non-hospitalized pneumonia than PCV13 in the <2 years, 2–4 years, and 5–17 years age groups, but the number of cases in the 18–49 years, 50–64 years, and >65 years age groups was higher than that under PCV13. PCV20 was estimated to avert more cases of simple and complex OM than PCV13 in the <2 years and 2–4 years age group, with no difference observed in the other age groups. Finally, PCV20 prevented more deaths due to disease in all age groups, with the greatest reduction observed in the >65 years age group (14,723 deaths averted) (Table S14).
From the payer perspective (CAD), over the time horizon of the model, the additional acquisition costs of PCV20 were more than offset by the medical costs averted due to disease prevention; thus, PCV20 was cost-saving compared with both PCV13 and PCV15, leading to a cost savings of $3,226,480,346 versus PCV13 and $1,484,267,884 versus PCV15. PCV20 also led to higher incremental QALYs (47,056 versus PCV13 and 21,881 versus PCV15). Therefore, PCV20 was dominant over PCV13 and PCV15 (i.e., less costly and more effective). From the societal perspective, vaccination with PCV20 resulted in even greater cost savings than vaccination with PCV13 ($3,882,543,056) and PCV 15 ($1,792,121,460).
Sensitivity analysis
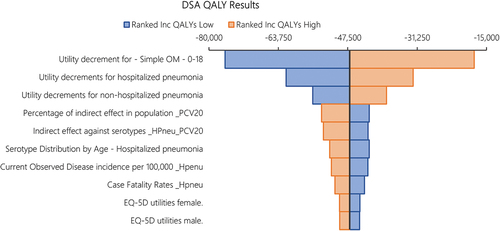
shows a tornado diagram of the one-way sensitivity analysis of the total costs under PCV20 versus PCV13 as SoC, showing the top 10 most impactful parameters. Results indicate that the single most influential parameter impacting costs was the percentage of the indirect effect of PCV20 accrued in the population over time, followed by the level of the steady state indirect effect against hospitalized pneumonia (maximum incidence reduction), the age-specific serotype distribution of hospitalized pneumonia (proxied by the IPD serotype distribution in the base case), and the direct medical costs of hospitalized pneumonia. There was no parameter in which variation led to PCV13 having incremental cost savings vs. PCV20. shows a tornado diagram of the one-way sensitivity analysis of the total QALYs under PCV20 versus PCV13 as SoC, showing the top 10 most impactful parameters. Results illustrate that the main driver impacting QALYs was the utility decrement of simple OM, followed by the utility decrements of hospitalized pneumonia and non-hospitalized pneumonia, the percentage of the indirect effect of PCV20 accrued in the population over time, and the level of the steady state indirect effect against hospitalization (maximum incidence reduction). There was no parameter in which variation led to PCV13 having incremental QALY gains vs. PCV20.
Figure 2. DSA results. Tornado diagram of incremental costs under PCV13 versus PCV20. The color of the bars indicates whether the parameter is at the lower bound or the upper bound. The top 10 most influential parameters are shown.
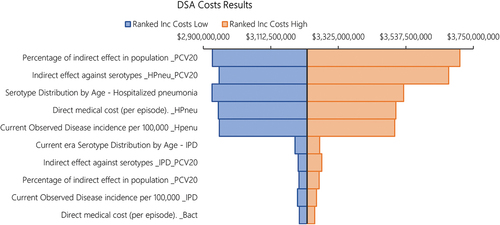
Figure 3. DSA results. Tornado diagram of QALYs under PCV13 versus PCV20. The color of the bars indicates whether the parameter is at the lower bound or the upper bound. The top 10 most influential parameters are shown.
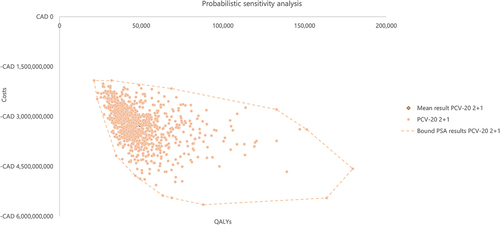
shows the results of the 1,000 iterations of the PSA as a cost-effectiveness plane where incremental health outcomes in terms of the QALYs gained were plotted against the incremental total costs of PCV20 versus PCV13 as SoC. Based on the results of 1,000 iterations, PCV20 was more effective and less costly than PCV13 in 100% of the iterations, with a mean incremental total cost of –$3,247,094,271 and mean incremental QALYs of 48,988. Based on the results of the PSA, PCV20 was dominant over PCV13 in all iterations, highlighting the robustness of results to uncertainty.
Figure 4. PSA of PCV20 versus PCV13 as SoC.
Scenario analysis
Three scenarios were run for the direct effect, namely, using the efficacy-based approach for IPD for all PCVs, including cross-protection against serotype 6C for all PCVs, and including cross-protection against 15C for PCV20. These scenarios ultimately had little impact on the aggregate costs and QALYs, leading to changes of less than 0.25% from the base case. Changes in the discount rate impacted the results, but PCV20 persisted as the dominant strategy over both alternatives. A reduction in the price of PCV15 impacted the results, but PCV20 was still the dominant strategy even with a 20% reduction in the price of PCV15. Assuming full vaccine protection for the first 10 years, adopting a hypothetical scenario of an adult vaccination program with an uptake of PCV20 of 40%, and assuming the same accrual rate for children and adults did not change the results substantially (i.e., PCV20 is more effective and cost-saving). A summary of the results of the scenario analyses is presented in .
Table 4. Scenario analyses: PCV13 as SoC over 10 years.
Table 5. Scenario analyses: PCV15 as SoC over 10 years.
Discussion
Over the 10-year time horizon of the model, our economic analysis of the prevention of pneumococcal disease in Canada showed that PCV20 was a dominant vaccination strategy compared with the SoC (either PCV13 or PCV15) from both a payer perspective and a societal perspective. Compared with PCV13, PCV20 was estimated to prevent over 11,000 IPD cases, 219,000 hospitalized pneumonia cases, 97,000 non-hospitalized pneumonia cases, 4,000 complex OM cases, 331,000 simple OM cases, and over 15,000 deaths associated with IPD and hospitalized pneumonia. By preventing pneumococcal disease and associated deaths, PCV20 is predicted to save over $3.2 billion in direct medical costs and provide over 47,000 additional QALYs compared with PCV13 over 10 years. A similar trend was found when using PCV15 as the SoC; compared with PCV15, PCV20 was predicted to prevent over 5,000 IPD cases, 102,000 hospitalized pneumonia cases, 41,000 non-hospitalized pneumonia cases, 2,000 complex OM cases, 153,000 simple OM cases, and over 7,000 deaths associated with IPD and hospitalized pneumonia. Moreover, compared with PCV15, PCV20 was estimated to save over $1.4 billion in direct medical costs and provide over 21,000 additional QALYs over a 10-year time horizon. The higher vaccine acquisition costs associated with PCV20 were offset by the substantially greater overall direct medical costs saved by preventing pneumococcal disease compared with either PCV13 or PCV15.
The economic benefits of implementing an infant PCV20 program versus PCV13 or PCV15 in Canada were even greater from the societal perspective since non-medical costs were included. In addition to the medical cost savings, PCV20 was predicted to provide an additional $650 million in non-medical cost savings compared with PCV13 and an additional $300 million in non-medical cost savings compared with PCV15.
We tested uncertainty using DSA, PSA, and scenario analyses. In the DSA, the cost results were most sensitive to the accrual of indirect effects associated with PCV20, the steady state indirect effects against hospitalized pneumonia, and the direct medical cost per hospitalized pneumonia episode. These parameters had the most influence on the potential incremental cost savings. However, in all one-way sensitivity analyses, PCV20 remained cost-savings over PCV13. The QALY results were the most impacted by one-way variation in the utility decrements of simple OM, hospitalized pneumonia, and non-hospitalized pneumonia, followed by similar parameters (e.g., indirect effects) in the DSA of costs. However, in all one-way sensitivity analyses, PCV20 remained more effective than PCV13. In the PSA, accounting for joint variation in all parameters, 100% of the 1,000 iterations fell in the lower-right-hand quadrant, indicating that PCV20 vaccination was always less costly and more effective than PCV13 vaccination in 1,000 simulations.
The results of this model are based on several assumptions and therefore subject to limitations. A decision-analytic model provides a simplified representation of disease transmission and outcomes. Static models are more suitable for assessing the cost-effectiveness of PCVs, while dynamic models better account for indirect effects.Citation53 Our model adopted the static Markov framework but incorporated elements typically not included in static models, such as herd effects. Furthermore, the modeling results represent the entire Canadian population; thus, these results may not be generalizable to specific regions or localities because the serotype distribution, disease environment, and age distribution in such regions may differ from those at the national level.
Some of the cost parameters, including the direct medical costs per episode of non-hospitalized pneumonia and simple and complex OM, and the direct medical costs per episode of sequelae, were informed by US studies due to a lack of available data from countries with a healthcare system similar to the Canadian healthcare system, which may have over- or underestimated the actual cost per event in Canada. Vaccines procured for use in a public program in Canada are provided at a confidential contract price; however, this analysis considered vaccine list prices, potentially leading to an overestimation of the vaccination costs of all PCVs and an underestimation of the total costs saved. Scenario analyses were conducted to explore the impact of varying the discount rates and the list price difference between PCV15 and PCV20. Changes in the discount rate impacted the results but did not change the finding that PCV20 is the dominant strategy over both alternatives. A reduction in the price of PCV15 also impacted the results, but PCV20 remained the dominant strategy, even with price reductions up to −20% vs. the current PCV15 list price.
Another limitation is that we did not adjust for the proportion of noninvasive disease caused by S. pneumoniae in the base case; data of this proportion both historically and currently are unknown, and studies that culture noninvasive disease are unlikely to be representative.Citation54 Furthermore, it was assumed that the serotype distribution observed in IPD is the same as that in noninvasive diseases; thus, there could be differences in the serotype distribution between IPD and noninvasive diseases. Each vaccine was assumed to have a full direct effect for 5 years after the final dose based on PCV13 efficacy data from the CAPiTA trial in adults aged >65 years.Citation55 However, the waning profile of PCVs in children is unknown due to a lack of supporting data. Additionally, our model did not consider serotype replacement, which may have resulted in the overestimation of the vaccine effects. Furthermore, we did not consider QALYs in the life expectancy estimations, which significantly underestimates the benefits of the higher-valent PCVs. Despite these limitations and assumptions, our results suggesting that PCV20 is dominant over PCV13 and PCV15 are robust and consistent across various analyses.
Conclusion
The results of this evaluation show that an infant PCV20 program is more effective and less costly than PCV13 (the current SoC) and PCV15 in a 2 + 1 schedule. PCV20 was predicted to prevent over 663,000 cases of disease, avert over 15,000 deaths, save over $3.2 billion in direct medical costs and $650 million in non-medical costs, and provide over 47,000 additional QALYs compared with PCV13 over 10 years. Moreover, compared with PCV15 over 10 years, PCV20 was estimated to prevent over 305,000 cases of disease, avert 7,000 deaths, save over $1.4 billion in direct medical costs and $300 million in non-medical costs, and provide over 21,000 additional QALYs. The dominance of PCV20 was consistently observed when the model parameters were varied in the DSA, PSA and scenario analyses. Given the broader serotype coverage and these substantial incremental benefits and cost-saving outcomes, PCV20 should be considered as a replacement for PCV13 (or PCV15) in the publicly funded infant immunization program in Canada.
Supplemental Material
Download PDF (821.1 KB)Disclosure statement
This study was sponsored by Pfizer Canada ULC. At the time the study was conducted, Derek Lytle, Ana Gabriela Grajales Beltrán, Nassim Ait Yahia and Johnna Perdrizet were full-time employees at Pfizer Canada ULC, and Alejandro Cane was a full-time employee at Pfizer Inc. At the time of the conduct of this study, Ben Yarnoff and Ruth Chapman were full time employee’s at Evidera. Evidera received financial support from Pfizer Inc. for this study (including manuscript preparation).
Supplementary data
Supplemental data for this article can be accessed on the publisher’s website at https://doi.org/10.1080/21645515.2023.2257426
Additional information
Funding
References
- World Health Organization Pneumococcal Disease. Published 2023. [accessed 2023 Feb 8]. https://www.who.int/teams/health-product-policy-and-standards/standards-and-specifications/vaccine-standardization/pneumococcal-disease.
- Dao TH, Rosch JW. JMM profile: streptococcus pneumoniae: sugar-coated captain of the men of death. J Med Microbiol. 2021;70(11):001446. doi:10.1099/jmm.0.001446.
- Ganaie F, Saad JS, McGee L, van Tonder AJ, Bentley SD, Lo SW, Gladstone RA, Turner P, Keenan JD, Breiman RF, et al. A new pneumococcal capsule type, 10D, is the 100th serotype and has a large cps fragment from an oral streptococcus. MBio. 2020;11(3):e00937–11. doi:10.1128/mBio.00937-20.
- Nasreen S, Wang J, Kwong JC, Crowcroft NS, Sadarangani M, Wilson SE, McGeer A, Kellner JD, Quach C, Morris SK, et al. Population-based incidence of invasive pneumococcal disease in children and adults in Ontario and British Columbia, 2002–2018: a Canadian immunization research network (CIRN) study. Vaccine. 2021;39(52):7545–53. doi:10.1016/j.vaccine.2021.11.032.
- Bettinger JA, Scheifele DW, Kellner JD, Halperin SA, Vaudry W, Law B, Tyrrell G. The effect of routine vaccination on invasive pneumococcal infections in Canadian children, immunization monitoring program, active 2000–2007. Vaccine. 2010;28(9):2130–6. doi:10.1016/j.vaccine.2009.12.026.
- Savulescu C, Krizova P, Valentiner-Branth P, Ladhani S, Rinta-Kokko H, Levy C, Mereckiene J, Knol M, Winje BA, Ciruela P, et al. Effectiveness of 10 and 13-valent pneumococcal conjugate vaccines against invasive pneumococcal disease in European children: SpIDnet observational multicentre study. Vaccine. 2022;40(29):3963–74. doi:10.1016/j.vaccine.2022.05.011.
- Quesada MG, Hetrich M, Knoll MD. 1181. Serotype distribution by age of remaining invasive pneumococcal disease after long-term PCV10/13 use: the PSERENADE project. Paper presented at: open forum infectious diseases; 2021.
- Earnshaw SR, McDade CL, Zanotti G, Farkouh RA, Strutton D. Cost-effectiveness of 2 + 1 dosing of 13-valent and 10-valent pneumococcal conjugate vaccines in Canada. BMC Infect Dis. 2012;12(1):1–13. doi:10.1186/1471-2334-12-101.
- Public Health Agency of Canada. Vaccine preventable disease: surveillance report to December 31, 2019. Published 2022. Updated May 20, 2022. [accessed 2022 Aug 31]. https://www.canada.ca/en/public-health/services/publications/healthy-living/vaccine-preventable-disease-surveillance-report-2019.html.
- Wijayasri S, Hillier K, Lim GH, Harris TM, Wilson SE, Deeks SL. The shifting epidemiology and serotype distribution of invasive pneumococcal disease in Ontario, Canada, 2007–2017. PloS One. 2019;14(12):e0226353. doi:10.1371/journal.pone.0226353.
- Merck Canada Inc. Product monograph, VAXNEUVANCE. Published 2022. Updated May 9, 2022. [accessed 2022 Aug 9]. https://pdf.hres.ca/dpd_pm/00066824.PDF.
- US Centers for Disease Control and Prevention. Active bacterial core surveillance report, emerging infections program network, streptococcus pneumoniae 2019. Published 2019. Updated July 16, 2021. www.cdc.gov/abcs/downloads/SPN_Surveillance_Report_2019.pdf.
- Shiri T, Datta S, Madan J, Tsertsvadze A, Royle P, Keeling MJ, McCarthy ND, Petrou S. Indirect effects of childhood pneumococcal conjugate vaccination on invasive pneumococcal disease: a systematic review and meta-analysis. Lancet Glob Health. 2017;5(1):e51–e9. doi:10.1016/S2214-109X(16)30306-0.
- National Advisory Committee on Immunization (NACI). Guidelines for the economic evaluation of vaccination programs in Canada. Published 2022. Updated April 14, 2022. [accessed 2022 Aug 22]. https://www.canada.ca/en/public-health/programs/guidelines-economic-evaluation-vaccine-programs-canada-stakeholder-consultation/guidelines-document.html.
- Public Health Agency of Canada. Notifiable diseases on-line. Published 2019. Updated July 20, 2021. [accessed 2022].
- Vadlamudi NK, Saatchi A, Patrick DM, Rose C, Sadatsafavi M, Marra F. Impact of the 13-valent pneumococcal conjugate vaccine on acute otitis media and acute sinusitis epidemiology in British Columbia, Canada. J Antimicrob Chemother. 2021;76(9):2419–27. doi:10.1093/jac/dkab167.
- Vadlamudi NK, Patrick DM, Rose C, Sadatsafavi M, Hoang L, Marra F. A population-based analysis to determine the impact of the 13-valent pneumococcal conjugate vaccine on community-acquired pneumonia in British Columbia, Canada. Vaccine. 2022;40(7):1047–53. doi:10.1016/j.vaccine.2021.12.065.
- Lieu TA, Ray GT, Black SB, Butler JC, Klein JO, Breiman RF, Miller MA, Shinefield HR. Projected cost-effectiveness of pneumococcal conjugate vaccination of healthy infants and young children. Jama. 2000;283(11):1460–8. doi:10.1001/jama.283.11.1460.
- Statistics Canada. Table 23-10-0837-01, life expectancy and other elements of the complete life table, single-year estimates, Canada, all provinces except Prince Edward Island. Published 2022. Updated May 22, 2023. [accessed 2022 June 17]. https://www150.statcan.gc.ca/t1/tbl1/en/tv.action?pid=1310083701&pickMembers%5B0%5D=1.1&pickMembers%5B1%5D=3.1&pickMembers%5B2%5D=4.3&cubeTimeFrame.startYear=2016&cubeTimeFrame.endYear=2020&referencePeriods=20160101%2C20200101.
- Rubin JL, McGarry LJ, Strutton DR, Klugman KP, Pelton SI, Gilmore KE, Weinstein MC. Public health and economic impact of the 13-valent pneumococcal conjugate vaccine (PCV13) in the United States. Vaccine. 2010;28(48):7634–43. doi:10.1016/j.vaccine.2010.09.049.
- Averin A, Shaff M, Weycker D, Lonshteyn A, Sato R, Pelton SI. Mortality and readmission in the year following hospitalization for pneumonia among US adults. Respir Med. 2021;185:106476. doi:10.1016/j.rmed.2021.106476.
- Hansen J, Black S, Shinefield H, Cherian T, Benson J, Fireman B, Lewis E, Ray P, Lee J. Effectiveness of heptavalent pneumococcal conjugate vaccine in children younger than 5 years of age for prevention of pneumonia: updated analysis using world health organization standardized interpretation of chest radiographs. Pediatr Infect Dis J. 2006;25(9):779–81. doi:10.1097/01.inf.0000232706.35674.2f.
- Black SB, Shinefield HR, Ling S, Hansen J, Fireman B, Spring D, Noyes J, Lewis E, Ray P, Lee J, et al. Effectiveness of heptavalent pneumococcal conjugate vaccine in children younger than five years of age for prevention of pneumonia. Pediatr Infect Dis J. 2002;21(9):810–5. doi:10.1097/00006454-200209000-00005.
- Black S, Shinefield H, Fireman B, Lewis E, Ray P, Hansen JR, Elvin L, Ensor KM, Hackell J, Siber G, et al. Efficacy, safety and immunogenicity of heptavalent pneumococcal conjugate vaccine in children. Northern California kaiser permanente vaccine study center group. Pediatr Infect Dis J. 2000;19(3):187–95. doi:10.1097/00006454-200003000-00003.
- Levy C, Biscardi S, Dommergues MA, Dubos F, Hees L, Levieux K, Aurel M, Minodier P, Zenkhri F, Cohen R, et al. Impact of PCV13 on community-acquired pneumonia by C-reactive protein and procalcitonin levels in children. Vaccine. 2017;35(37):5058–64. doi:10.1016/j.vaccine.2017.06.057.
- Rodrigo C, Bewick T, Sheppard C, Greenwood S, Mckeever TM, Trotter CL, Slack M, George R, Lim WS. Impact of infant 13-valent pneumococcal conjugate vaccine on serotypes in adult pneumonia. Eur Respir J. 2015;45(6):1632–41. doi:10.1183/09031936.00183614.
- Lau WC, Murray M, El-Turki A, Saxena S, Ladhani S, Long P, Sharland M, Wong ICK, Hsia Y. Impact of pneumococcal conjugate vaccines on childhood otitis media in the United Kingdom. Vaccine. 2015;33(39):5072–9. doi:10.1016/j.vaccine.2015.08.022.
- Public Health Agency of Canada. Childhood national immunization coverage survey, 2019. Published 2019. Updated May 3, 2021. [accessed 2022 Aug 13]. https://www150.statcan.gc.ca/n1/daily-quotidien/210503/dq210503b-eng.htm.
- Janssen B, Szende A. Population norms for the EQ-5D. Self-reported population health: an international perspective based on EQ-5D; 2014. 19–30.
- Tang Z, Matanock A, Jeon S, Leidner AJ. A review of health-related quality of life associated with pneumococcal disease: pooled estimates by age and type of disease. J Public Health (Bangkok). 2022;44(2):e234–e40. doi:10.1093/pubmed/fdab159.
- Pfizer data on file. 2022.
- IQVIA. Delta PA database. Published 2022. https://www.iqvia.com/locations/canada/library/fact-sheets/iqvia-deltapa.
- Ontario Ministry of Health. OHIP schedule of benefits and fees. Published 2022. https://www.health.gov.on.ca/en/pro/programs/ohip/sob/physserv/sob_master.pdf.
- Canadian Institute for Health Information. The burden of disease of hospitalization for community acquired pneumonia in Canada: final report Canada (minus Quebec). 2020 Nov 25.
- Weycker D, Farkouh RA, Strutton DR, Edelsberg J, Shea KM, Pelton SI. Rates and costs of invasive pneumococcal disease and pneumonia in persons with underlying medical conditions. BMC Health Serv Res. 2016;16(1):182. doi:10.1186/s12913-016-1432-4.
- Tong S, Amand C, Kieffer A, Kyaw MH. Trends in healthcare utilization and costs associated with acute otitis media in the United States during 2008-2014. BMC Health Serv Res. 2018;18(1):318. doi:10.1186/s12913-018-3139-1.
- Ray GT, Whitney CG, Fireman BH, Ciuryla V, Black SB. Cost-effectiveness of pneumococcal conjugate vaccine: evidence from the first 5 years of use in the United States incorporating herd effects. Pediatr Infect Dis J. 2006;25(6):494–501. doi:10.1097/01.inf.0000222403.42974.8b.
- Government of Ontario. Published 2017. Updated January 13, 2017.
- Wilson MR, Wasserman MD, Breton MC, Peloquin F, Earnshaw SR, McDade C, Sings HL, Farkouh RA. Health and economic impact of routine pediatric pneumococcal immunization programs in Canada: a retrospective analysis. Infect Dis Ther. 2020;9(2):341–53. doi:10.1007/s40121-020-00294-6.
- Hsu HE, Shutt KA, Moore MR, Beall BW, Bennett NM, Craig AS, Farley MM, Jorgensen JH, Lexau CA, Petit S, et al. Effect of pneumococcal conjugate vaccine on pneumococcal meningitis. N Engl J Med. 2009;360(3):244–56. doi:10.1056/NEJMoa0800836.
- Rozenbaum MH, Sanders EA, van Hoek AJ, Jansen AGSC, van der Ende A, van den Dobbelsteen G, Rodenburg GD, Hak E, Postma MJ. Cost effectiveness of pneumococcal vaccination among Dutch infants: economic analysis of the seven valent pneumococcal conjugated vaccine and forecast for the 10 valent and 13 valent vaccines. Bmj. 2010;340:c2509–c2509. doi:10.1136/bmj.c2509.
- Ansaldi F, Pugh S, Amicizia D, Di Virgilio R, Trucchi C, Orsi A, Zollo A, Icardi G. Estimating the clinical and economic impact of switching from the 13-valent pneumococcal conjugate vaccine (PCV13) to the 10-valent pneumococcal conjugate vaccine (PCV10) in Italy. Pathogens. 2020;9(2):76. doi:10.3390/pathogens9020076.
- Kim H-Y, Park S-B, Kang E-S, Lee S-M, Kim H-J, Wasserman M. Cost-effectiveness of a national immunization program with the 13-valent pneumococcal conjugate vaccine compared with the 10-valent pneumococcal conjugate vaccine in South Korea. Hum Vaccin Immunother. 2021;17(3):909–18. doi:10.1080/21645515.2020.1796426.
- Klok RM, Lindkvist R-M, Ekelund M, Farkouh RA, Strutton DR. Cost-effectiveness of a 10-versus 13-valent pneumococcal conjugate vaccine in Denmark and Sweden. Clin Ther. 2013;35(2):119–34. doi:10.1016/j.clinthera.2012.12.006.
- Kulpeng W, Leelahavarong P, Rattanavipapong W, Sornsrivichai V, Baggett HC, Meeyai A, Punpanich W, Teerawattananon Y. Cost-utility analysis of 10-and 13-valent pneumococcal conjugate vaccines: protection at what price in the Thai context? Vaccine. 2013;31(26):2839–47. doi:10.1016/j.vaccine.2013.03.047.
- Levy C, Varon E, Picard C, Béchet S, Martinot A, Bonacorsi S, Cohen R. Trends of pneumococcal meningitis in children after introduction of the 13-valent pneumococcal conjugate vaccine in France. Pediatr Infect Dis J. 2014;33(12):1216–21. doi:10.1097/INF.0000000000000451.
- Oostenbrink R, Moll HA, Essink-Bot M-L. The EQ-5D and the health utilities index for permanent sequelae after meningitis: a head-to-head comparison. J Clin Epidemiol. 2002;55(8):791–9. doi:10.1016/S0895-4356(02)00448-1.
- Erickson LJ, De Wals P, McMahon J, Heim S. Complications of meningococcal disease in college students. Clin Infect Dis. 2001;33(5):737–9. doi:10.1086/322587.
- U.S. Bureau of Labor Statistics. Consumer price index. Published 2022. [accessed 2022 Aug 13]. https://data.bls.gov/pdq/SurveyOutputServlet.
- Statistics Canada. Table 14-10-0287-03 labour force characteristics, monthly, seasonally adjusted and trend-cycle, last 5 months. Published 2022. Updated Sept 9, 2022. https://www150.statcan.gc.ca/t1/tbl1/en/tv.action?pid=1410028701.
- Statistics Canada. Table 14-10-0320-01 average usual hours and wages by selected characteristics, monthly, unadjusted for seasonality, last 5 months (x 1,000). Published 2022. Updated Sept 9, 2022. https://www150.statcan.gc.ca/t1/tbl1/en/tv.action?pid=1410032001.
- Briggs AH, Schulpher CK. Decision modelling for health economic evaluation. Oxford (UK): Oxford University Press; 2006.
- Lochen A, Anderson RM. Dynamic transmission models and economic evaluations of pneumococcal conjugate vaccines: a quality appraisal and limitations. Clin Microbiol Infect. 2021;27(10):1546–57. doi:10.1016/j.cmi.2021.07.002.
- Horn EK, Wasserman MD, Hall-Murray C, Sings HL, Chapman R, Farkouh RA. Public health impact of pneumococcal conjugate vaccination: a review of measurement challenges. Expert Rev Vaccines. 2021;20(10):1291–309. doi:10.1080/14760584.2021.1971521.
- Patterson S, Webber C, Patton M, Drews W, Huijts SM, Bolkenbaas M, Gruber WC, Scott DA, Bonten MJM. A post hoc assessment of duration of protection in CAPiTA (community acquired pneumonia immunization trial in adults). Trials Vaccinol. 2016;5:92–6. doi:10.1016/j.trivac.2016.04.004.