
ABSTRACT
Nucleic acid vaccines are designed based on genetic sequences (DNA or mRNA) of a target antigen to be expressed in vivo to drive a host immune response. In response to the COVID-19 pandemic, mRNA and DNA vaccines based on the SARS-CoV-2 Spike antigen were developed. Surprisingly, head-to-head characterizations of the immune responses elicited by each vaccine type has not been performed to date. Here, we have employed a range of preclinical animal models including the hamster, guinea pig, rabbit, and mouse to compare and delineate the immune response raised by DNA, administered intradermally (ID) with electroporation (EP) and mRNA vaccines (BNT162b2 or mRNA-1273), administered intramuscularly (IM), expressing the SARS-CoV-2 WT spike antigen. The results revealed clear differences in the quality and magnitude of the immune response between the two vaccine platforms. The DNA vaccine immune response was characterized by strong T cell responses, while the mRNA vaccine elicited robust humoral responses. The results may assist in guiding the disease target each vaccine type may be best matched against and suggest mechanisms to further enhance the breadth of each platform’s immune response.
Introduction
The concept of the use of genetic material as vaccines was born out of the observation of in vivo protein production after injection of DNA or RNA into the leg muscles of mice.Citation1 While the instability of mRNA limited its initial use, plasmid DNA was widely explored as a promising new vaccine platform. Early studies of DNA vaccines in small animals supported immunogenicity and safety.Citation2,Citation3 However, the immune responses in larger animal and human studies initially disappointed due to inefficient in vivo gene delivery. In response, physical (electroporation, ultrasound, and gene gun) and chemical (lipids, polymers) in vivo delivery strategies were developed to enhance the passage of pDNA into the target tissue.Citation4–9 These delivery strategies resulted in levels of in vivo gene expression and more robust immune responses.Citation8,Citation10 In 2021, Indian authorities gave emergency approval to the SARS-CoV-2 spike DNA vaccine, ZyCoV-D, the first DNA vaccine approved for human use.Citation11
Initially, mRNA vaccine development was hindered by the instability of the mRNA molecule and its inflammatory nature. Two important findings advanced its progress. First, modifications of the nucleosides were identified which reduced the hosts’ inflammatory responses against the mRNA, allowing for improved in vivo expression of the encoded protein.Citation12 Second, the development of a safe and stable delivery system, lipid nanoparticles (LNPs), has enhanced the efficiency of in vivo delivery of mRNA, by protecting the molecule from immediate degradation and targeting the payload to the immune system.Citation13 Nucleoside-modified mRNA vaccines formulated with LNPs were among the first approved COVID-19 vaccines, demonstrating high levels of protection against SARS-CoV-2 infection which was associated with robust neutralizing antibody induction.Citation14–17
While both DNA and mRNA nucleic acid COVID-19 vaccines were designed to code for the ancestral SARS-CoV-2 spike antigen, quite distinct immune profiles were reported for each platform. The mRNA vaccines elicited strong humoral responses, demonstrating high levels of neutralizing antibody responses primarily targeting restricted regions of the SARS-CoV-2 spike antigen such as the receptor-binding domain (RBD) and the N-terminal domain (NTD).Citation18 The DNA vaccines induced a modest humoral response, but broad T cell responses across the whole Spike antigen.Citation19 Thus, the data from non-head-to-head studies indicate that these nucleic acid vaccine platforms may induce characteristically different immune responses. Here, we sought to further explore and confirm this observation by employing head-to-head analysis of mRNA and DNA vaccine responses against the SARS-CoV-2 spike antigen in preclinical animal models. We used a range of animal models (New Zealand white rabbits, Hartley guinea pigs, and Syrian golden hamsters) which are compatible with the delivery modality (minimally invasive in vivo electroporation at the skin) for DNA vaccines to compare and contrast the cellular and antibody responses raised by each platform. Data indicated distinct immune profiles characterized by broad T cell responses in DNA vaccine immunized animals and high levels of focused neutralizing antibodies after mRNA vaccination. Further mechanistic work was performed in mice, revealing differences in polyfunctional antigen-specific CD4+ and CD8+ T cell responses, as well as T follicular helper cell (Tfh) and B cell generation after vaccination.
Materials and methods
Vaccines
INO-4800, a plasmid DNA encoding the Wuhan-Hu-1 WT full-length spike sequenceCitation19,Citation20 was selected for comparison of the immune responses to mRNA vaccines in all preclinical animal models presented in this study. For immunizations with mRNA vaccine, the monovalent version encoding the Wuhan-Hu-1 Spike sequence for BNT162b2 or mRNA-1273 were used. BNT162b2 was used in the hamster, rabbit, and mouse studies, whereas mRNA-1273 was used in the hamster and guinea pig studies.
Study design and immunizations
Hamster studies
Syrian golden hamsters were purchased from Envigo to assess immune responses in primary immunogenicity or prime-boost studies. For the primary immunogenicity study, animals were divided into groups of six animals and dosed with 50 μg of INO-4800 intradermally (ID) followed by electroporation using the Cellectra 3P™ (EP) device, 5 μg of BNT162b2 intramuscularly (IM), 5 μg of mRNA-1273 IM, or left untreated. Blood samples were collected pre-treatment on Day 0, after first immunization on Day 21 and 14 days post-second immunization on Day 35. Animals were sacrificed and spleens harvested for assessment of T cell responses. For the heterologous prime-boost study, hamsters were divided into groups of six animals that received a primary series with 5 μg of BNT162b2 on Days 0 and 21. After 96 days, one group received a heterologous boost with 50 μg of INO-4800 and the second group a homologous boost with 5 μg of BNT162b2. Serum was collected on Day 96 (pre-boost, baseline) and 14 days post-boost on Day 110 for assessment of humoral responses. Animals were sacrificed on Day 110 and spleens harvested for assessment of T cell response by the IFNγ ELISpot assay.
Rabbit study
White New Zealand rabbits were purchased from Envigo to evaluate primary immunogenicity of clinical dosing of mRNA and DNA vaccines. Rabbits were divided into two groups of five rabbits per group. Each group received either 2 mg of INO-4800 via ID-EP or 30 μg of BNT162b2 IM on Days 0 and 28. Serum samples and peripheral blood mononuclear cells (PBMCs) were collected on Days 0, 14, 35, and 85 for assessment of humoral and T cell responses, respectively.
Mouse studies
C57BL6 and BALB/c mice were purchased from Jackson Laboratories and used to investigate mechanistic pathways involved in the generation of humoral and cellular immune response between nucleic acid platforms or in early work investigating the generation of antibody responses, respectively. The C57BL6 or BALB/c were divided into groups of eight animals and received two doses of 10 μg of INO-4800 via IM-EP delivery or 1 μg of BNT162b2 intramuscularly on Days 0 and 21. In the BALB/c study, mice were also divided into two additional groups that received treatment with 5 μg of DLNP or 5 μg DLNP in combination with 2.5 μg of pDNA encoding IL-6. Both treatments were delivered via IM-EP. Serum samples were collected on Days 0, 21, and 28 and mice were sacrificed on Day 28 for spleen harvest.
Guinea pig study
Hartley guinea pigs were purchased from Elm Hill Labs for assessment of primary immunogenicity between nucleic acid vaccines. Animals were divided into two groups of five animals per group. Groups received either 100 μg of INO-4800 ID-EP or 10 μg of mRNA-1273 IM on Days 0 and 26. Serum samples were collected on Days 0, 14, 26, and 34 and PBMCs collected on Day 34 to assess T cell responses.
SARS-CoV-2 pseudovirus production and neutralization assay
Pseudovirus production
SARS-CoV-2 pseudovirus stocks encoding the Ancestral (WT) or Omicron (BA.1) spike protein were produced using HEK293T cells transfected with Lipofectamine 3000 (ThermoFisher) using IgE-SARS-CoV-2 S plasmid variants (GenScript) co-transfected with pNL4–3.Luc.R-E- plasmid (NIH AIDS reagent) at a 1:8 ratio. Seventy-two-hours post-transfection, supernatants were collected, steri-filtered (Millipore Sigma) and aliquoted for storage at −80°C.
Pseudovirus neutralization assay
CHO cells stably expressing the ACE2 receptor (ACE2-CHOs; Creative Biolabs) were used as target cells at 7,000 cells/well. SARS-CoV-2 pseudoviruses were titered to yield >30 times the relative luminescence units (RLU) of the cells-only control after 72 h of infection. Hamster sera from vaccinated and naive groups were heat inactivated and serially diluted two-fold starting at 1:32 dilution. Sera were incubated with SARS-CoV-2 pseudovirus for 90 min at room temperature. After incubation, the sera-pseudovirus mixtures were added to ACE2-CHOs and allowed to incubate in a standard incubator (37°C, 5% CO2) for 72 h. After 72 h, cells were lysed using Britelite Plus Reporter Gene Luciferase (PerkinElmer), and the RLU was measured using an automated luminometer. Neutralization titers (ID50) were calculated using GraphPad Prism 8 and defined as the reciprocal serum dilution at which RLU was reduced by 50% compared to RLU in virus control wells after subtraction of background RLU in cell-only wells.
Mouse and hamster spleen processing
The mouse or hamster spleens were placed in 15 mL conical tubes containing 6 ml of R10 media (RPMI-1640 with 10% fetal bovine serum, 1% penicillin–streptomycin, and 0.1% 2-mercapthoethanol). Splenocytes were isolated using the Seward Stomacher bag and machine system. Cells were then strained through a 40 mm filter (BD Bioscience), washed, and red blood cells (RBC) were lysed in 3 ml of ACK lysing buffer (Lonza) for 2 min. After washing with 1× PBS, isolated splenocytes were counted using the Vi-Cell-Blu machine (Beckman Coulter) and resuspended at 20 × 106/mL concentration ready to be used for ELISpot.
Rabbit PBMC processing
Peripheral blood (3–5 mL) from the rabbit ear vein was drawn from each rabbit and transferred immediately into EDTA blood collection tubes (BD cat# 367844). Blood was diluted 1:1 with PBS and slowly layered over 3.5 ml of Ficoll-Paque Plus in a 15 mL SepMate tube (StemCell Technologies). Cells were centrifuged at 1200 g for 10 min at RT with brakes on and then washed with R10 medium. The RBCs were lysed in 2 mL of ACK lysis buffer for 2 min and the reaction was stopped with 1× PBS. Cells were washed with 1× PBS, resuspended in 5 mL of R10 media and counted. Cells were diluted to 1 × 10⁶/mL in R10 media for further use in ELISpot assays.
Hamster and rabbit IFNγ ELISpot
For hamster and rabbit ELISpot assays, pre-coated kits from Mabtech were used following the manufacturer’s protocol. For hamster ELISpot Plus: Hamster IFNγ (ALP) 3102-4APW (Mabtech) and for rabbit ELISpot Plus: Rabbit IFNγ (HRP) 3110-4HPW. ELISpot plates were washed five times with sterile PBS, pH 7.4. Plates were then blocked with 200 mL/well of R10 for at least 30 min at room temperature. Peptide megapools, negative control (DMSO), and positive controls (Concanavalin A for splenocytes, PMA/Ionomycin for PBMCs) were added to the wells, followed by addition of cells at 1:1 stimuli-cell ratio (2 × 10⁵cells/well of splenocytes or 1 × 10⁵ cells/well of PBMCs). Peptide pools were divided into five pools spanning the full-length SARS-CoV-2 Spike molecule. These five peptide pools were pooled into a single megapool, with a final concentration of 1 μg per peptide. Megapools were prepared for each of the following variants: ancestral (WT), Beta, Delta, BA.1, BA.2. Plates were incubated in a 37°C humidified incubator with 5% CO2 and for 18–20 h. Cells were removed and plates washed five times with 200 μL/well of PBS. Detection antibody (biotin) was diluted to 1 μg/mL and 0.1 μg/mL for hamster and rabbit ELISpot, respectively, in PBS containing 0.5% FBS and added at a concentration of 100 μL/well, following which plates were incubated for 2 h at RT. Plates were then washed with 200 μL of PBS and further incubated for 1 h at RT with 100 μL of Streptavidin-ALP at 1:1000 dilution in PBS-0.5% FBS. Plates were then washed with PBS, and 100 μL/well of substrate solution BCIP/NBT Plus (Mabtech) was added to the plates and incubated until distinct spots emerged, for approximately 10 min. The reaction was stopped by washing with DI water and left to dry overnight. Spots were scanned and counted the following day using a CTL ImmunoSpot analyzer.
SARS-CoV-2 IgG binding ELISA
The 96-well half area high-binding Costar plates (Corning) were coated with 1 µg/mL of SARS-CoV-2 spike protein, ancestral (wild-type) (Acro Biosystems), in 1× DPBS (Thermo Scientific) overnight at 4°C. The next day, the plates were washed 3× with wash buffer (1× PBS + 0.05% Tween-20) and blocked with 3% BSA in PBS + 0.05% Tween-20 for 2 h at RT. Plates were washed 3× with wash buffer and serially diluted sera samples were added in dilution buffer (1% BSA in PBS + 0.05% Tween-20), and plates were incubated for 2 h at RT. Plates were washed and incubated with a 1:10,000 dilution of anti-mouse IgG1 HRP or IgG2a HRP (Abcam) secondary antibody in a dilution buffer for 1 h at RT. The plates were washed, and 25 µl/well of SureBlue TMB Substrate (KPL 5120–0077) was added to the plates. The reaction was stopped with 25 µL/well of TMB Stop Solution (KPL 5150–0021) after a 10-min incubation, and the plates were read on a Biotek Synergy plate reader at the 450 nm wavelength.
Flow cytometry staining
To assess the B cell response, 4 × 10⁶ splenocytes/well were plated in round 96-well plates. Plates were washed using 200 μL of FACS buffer (2% FBS in 1× PBS) at 1400 rpm for 2 min at 4°C. Cells were incubated with FC block for 15 min at RT prior to staining. Biotinylated SARS-CoV-2 S protein (Acro #SPN-C82E9) was diluted to 0.1 mg/mL using diH2O. BV421 (BD #563259) and FITC (BD #554060) Streptavidin conjugates were diluted to 50 μg/mL in PEB buffer (0.5% BSA and 2 mM EDTA in 1× PBS). Biotinylated spike protein and streptavidin conjugates were combined and incubated at RT protected from the light for 15 min. Cells were double-stained with Spike tetramers and a decoy streptavidin-APC-R700 (BD #565144) for 1 h, at 4°C, in the dark. After washing, the cells were incubated with surface marker antibodies CD95 (BV650 and BD740507), GL7 (PE, Biolegend #144608), B220 (AF647, Biolegend #103226), CD3 (APC-Cy7, BD #560590), and LIVE/DEAD Aqua staining (ThermoFisher #L34966) for 30 min, at 4°C, in the dark. Cells were washed and resuspended in 200 μL of 1% paraformaldehyde solution and stored at 4°C in the dark.
To assess the frequency of Tfh and activated Tfh cells, mouse splenocytes were plated on 96-well round bottom plates at 2 × 10⁶ cells/well. Cells were stimulated with SARS-CoV-2 WT Spike peptide megapool (1 mg/mL/peptide) or DMSO for 16–24 h at 37°C. Plates were centrifuged at 1400 rpm for 2 min to remove peptides and cells stained with CXCR5-biotin (BD, #551960), ICOS (BV650, BD #740556), PD-1 (PE-CF594, BD #562523), CD4 (PerCP-Cy5.5, BD #550954), CD3 (APC-Cy7, BD #560590), CD25 (APC, eBioscience #17-0251-82), and LIVE/DEAD Aqua (ThermoFisher #L34966) for 30 min at 4°C. Cells were washed with FACS buffer and stained with BV421-Streptavidin for 30 min at 4°C. Cells were washed and resuspended in 200 μL of 1% paraformaldehyde solution and stored at 4°C in the dark. Data were acquired on an LSR Fortessa flow cytometer (BD Biosciences) and analyzed using FlowJo V.10 software.
To assess polyfunctional T cell responses in antigen-specific CD4 and CD8 T cells, mouse splenocytes were plated on 96-well round bottom plates at 2 × 10⁶ cells/well. Cells were stimulated with SARS-CoV-2 WT Spike peptide megapool (1 mg/mL/peptide) or DMSO for 20 h at 37°C. GolgiStop (BD Biosciences) and GolgiPlug (BD Biosciences) were added 1 h after incubation with peptides. After 20 h, plates were centrifuged at 1400 rpm for 2 min to remove peptides, and cells were stained with LIVE/DEAD Aqua staining (ThermoFisher #L34966), CD3 APC-Cy7 (BD Biosciences cat# 560590), CD4 PerpCP-Cy5.5 (BD Biosciences cat# 550954), and CD8 BD786 (BD Biosciences cat#563332) for 30 min at 4°C. Cells were centrifuged at 1400 rpm for 2 min and washed with 200 μL of FACS buffer. Cells were fixed with 200 μL of FoxP3fix/perm buffer according to manufacturer’s protocol (eBioscience™) for 30 min at 4°C. After incubation, cells were centrifuged at 2000 rpm for 5 min, and washed with 200 μL of Perm buffer. Cells were stained for intracellular cytokine markers for 30 min at RT with the following antibodies: IFNγ BV605 (Biolegend cat# 505840), TNFα BV650 (BD Bioscience cat# 563943), IL-2 (BD Bioscience cat# 561287), IL-4 AF647 (BD Bioscience cat# 557739), and IL-5 PE (Biolegend cat# 504304). After incubation, cells were washed with Perm buffer, centrifuged at 200 rpm for 5 min, and resuspended in 200 μL of FACS buffer until acquisition. Data were acquired on an LSR Fortessa flow cytometer (BD Biosciences) and analyzed using FlowJo V.10 software.
Statistical analysis
Statistical analyses were performed using GraphPad Prism 9 software (La Jolla, CA). Data were considered statistically significant if p < .05. Graphs display individual animals or mean values (arithmetic or geometric means, as required). Error bars represent the standard deviation, standard error, or 95% confidence interval. Randomization was not performed for animal studies. Samples and animals were not blinded before performing each experiment.
Results
Immune response elicited in Syrian golden hamsters after a primary series of DNA or mRNA vaccinations delivered via intramuscular or intradermal routes
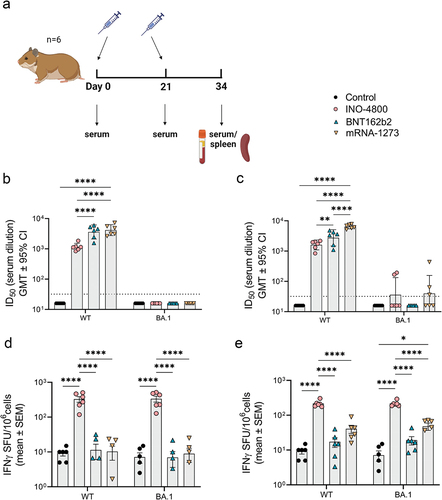
To evaluate the immune response raised by DNA and mRNA vaccines we used INO-4800 as the DNA vaccine and BNT162b2 or mRNA-1273 as the mRNA comparator.Citation14,Citation17,Citation19 These vaccines were evaluated as prophylactics against SARS-CoV-2 infection during the COVID-19 pandemic and BNT162b2 and mRNA-1273 were given EUA in 2020. We first evaluated the immune response raised by these vaccines in the Syrian golden hamster model, which was considered the gold standard small animal model for testing medical countermeasures against COVID-19.Citation21,Citation22 This hamster model is permissive to wild-type SARS-CoV-2 infection and presents similar lung pathology as observed in COVID-19 patients. Based on published preclinical studies evaluating the immune responses of DNACitation20 and mRNACitation23,Citation24 vaccines to SARS-CoV-2, we dosed on a 10:1 ratio of DNA vaccine to mRNA. The hamsters were dosed with 50 μg of INO-4800 or 5 μg of BNT162b2 or mRNA-1273 on days 0 and 21 (). To determine whether site of delivery impacted the immune response, we either administered the vaccine to the skin (ID) or muscle (IM). On day 34 (2 weeks post-second immunization) the immune response targeting the ancestral WT and Omicron BA.1 variant of concern (VOC) SARS-CoV-2 spike antigen was assessed. At day 34 neutralizing antibodies to WT spike pseudovirus was measured in all the vaccinated animals. The WT neutralizing titers were higher in BNT162b2 (mean ID50: IM, 2747 & ID, 3605) and mRNA-1273 (mean ID50: IM, 6452 & ID, 4159) compared to INO-4800 vaccinated animals (mean ID50: IM, 1603 & ID, 1152) (). The BA.1 VOC neutralizing titers were not detected in any of the animals immunized by the ID route (), and only low levels in two of six animals immunized IM with INO-4800 and three out of six animals immunized IM with mRNA-1273 (). The number of lFNγ-producing T cells was significantly higher in the INO-4800 (mean SFU/106 cells: IM, 216 & ID, 326) compared to the BNT162b2 (mean SFU/106 cells: IM, 17 & ID, 11) and mRNA-1273 (mean SFU/106 cells: IM, 41 & ID, 10) vaccinated animals (). In contrast to neutralizing antibodies, the T cell response was maintained against a peptide megapool matched to the BA.1 VOC. The levels of humoral and cellular immune responses of each vaccine were similar between IM and ID delivery, except for mRNA-1273, which showed minimal significant differences (x1.5 higher nAb and x3.8 higher IFNγ T cells between ID and IM). Thus, for subsequent animal studies, we followed the standard clinical route for each vaccine (IM for mRNA and ID for DNA). These findings indicate that the route of delivery did not influence the characteristics of the immune response raised. To determine whether this observation held with a different animal model, we tested the mRNA-1273 vaccine in the Hartley guinea pig model. Similar to the results in the hamster model, guinea pigs raised higher neutralizing antibody responses after vaccination with mRNA-1273, but a lower T cell response compared to animals receiving the DNA vaccine (Figure S1a,b). In summary, immunological data from the hamster and guinea pig models indicated that the mRNA vaccine induced higher humoral immune response, while the DNA vaccine elicited higher cellular response.
Figure 1. Characterization of the immune response in Syrian golden hamsters after a primary series of mRNA and DNA vaccination delivered at different sites. (a) Study schematicCitation25 and dosing schedule in Syrian golden hamster. (b-c) Neutralizing activity (ID50 values) against the WT and BA.1 pseudoviruses are shown (ID delivery, b and IM delivery, c). Each data point represents the mean of technical duplicates for each animal (n = 6). Dashed lines represent the limit of detection (LOD) of the assay. Samples below LOD were plotted at the number equivalent to half of the lowest serum dilution. Data shown represent ID50 (GMT ± 95% CI) for each group of six hamsters. (d-e) Splenocyte cellular responses to WT and BA.1 spike peptide megapools measured by IFNγ ELISpot assay (ID delivery, e and IM delivery, f). Data shown represent IFNγ spots per one million cells of experimental triplicates (mean ± SEM) after DMSO subtraction. ****P ≤ .0001, **P = .0021, *P = .033 (2-way ANOVA, tukey’s multiple comparison).
Immune response elicited in Syrian golden hamsters after a primary series of mRNA vaccination followed by a heterologous DNA or homologous mRNA booster dose.
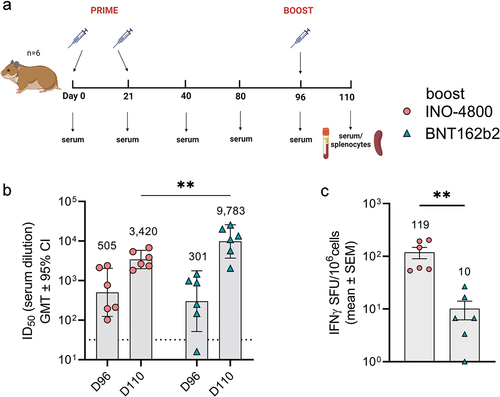
Currently, most COVID-19 vaccines are administered as boosters to subjects who have previously received an EUA vaccine. Thus, we evaluated the immune response raised in animals harboring immunity generated by a mRNA vaccine after heterologous boosting with INO-4800 or homologous boosting with BNT162b2. The hamsters received a prime series of Day 0 and 21 dosing with BNT162b2 (). On day 96, animals received a booster dose, and humoral and cellular responses were measured 14 days later (). In the six animals receiving the INO-4800 booster vaccine, the baseline ID50 titer of neutralizing antibodies against WT SARS-CoV-2 pseudovirus was 505 (day 96) after which it increased to 3420 after boosting (6.8-fold difference) (). Of the remaining six animals receiving the BNT162b2 vaccine, the baseline ID50 titer of neutralizing antibodies against WT SARS-CoV-2 pseudovirus was 301 which was increased to 9,783 after boosting (32.5-fold difference), indicating that a humoral boosting effect of the mRNA vaccine was higher in magnitude compared to the DNA vaccine (). In contrast, the heterologous boost of the T cell response to WT and BA.1 SARS-CoV-2 peptide pools was significantly higher for INO-4800 (mean SFU/106 cells: 119) than BNT-162b2 (mean SFU/106 cells: 10) (). In summary, data from the Syrian golden hamster model indicate that DNA vaccines can perform as heterologous boosters of humoral and T cells after a primary series with a mRNA vaccine.
Figure 2. Heterologous and homologous boost of mRNA vaccinated hamsters. (a) Study schematicCitation25 and dosing schedule in Syrian golden hamsters. (b) Neutralizing activity (ID50 values) against the WT pseudovirus pre-boost (day 96) and post-boost (day 110) are shown. Each data point represents the mean of technical duplicates for each animal (n = 6). Dashed lines represent the limit of detection (LOD) of the assay. Samples below LOD were plotted at the number equivalent to half of the lowest serum dilution. Data shown represent mean ID50 (GMT ± 95% CI) for each group of six hamsters. GMT numbers are plotted above bars for reference. **P < .001. 2-way ANOVA, Sidak’s multiple comparison. (c) Splenocyte cellular responses to WT spike peptide megapool on day 110 measured by IFNγ ELISpot assay. Data shown represent IFNγ spots per one million cells of experimental triplicates (mean ± SEM) after DMSO subtraction. *P < .05 student t-test, Mann Whitney.
Immune response elicited in New Zealand white rabbits after a primary series of clinically relevant doses of DNA or mRNA vaccines
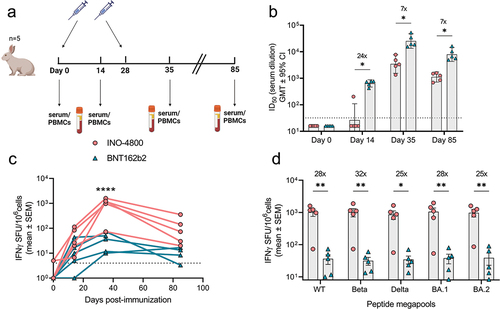
New Zealand white rabbits were vaccinated on days 0 and 28 with doses of BNT162b2 and INO-4800 matching those approved for use in humans (30 μg for BNT162b2) and clinical trials (2 mg of INO-4800)Citation17,Citation19 (). Neutralization titers and IFNγ T cells responses against SARS-CoV-2 Spike antigen were measured on days 0, 14, 35, and 85 (). We observed a rapid rise in neutralizing antibodies in the mRNA-vaccinated animals, with 100% of animals seroconverting by day 14, while it required two doses of DNA vaccine to achieve 100% seroconversion (). In contrast, INO-4800 induced a rapid T cell response that was significantly higher at the peak of response on day 35 after the second dose (mean: 1010.7 SFU/106 cells for INO-4800 vs 36.3 SFU/106 cells for BNT162b2) and was detected through day 85 (mean: 124.7 SFU/106 cells vs 8.3 SFU/106 cells for BNT162b2) (). Further analysis of the T cell response assessed after two immunizations (day 35) revealed that it was maintained across multiple SARS-CoV-2 VOCs, including Beta, Delta, and Omicron BA.1 & BA.2 (). Similar to the results in hamsters and guinea pigs ( and S1b,d), DNA vaccination induced higher T cell response which was broadly maintained across SARS-CoV-2 VOCs, whereas mRNA vaccine induced a strong humoral response.
Figure 3. Characterization of the immune response in New Zealand rabbits after a primary series of mRNA and DNA clinically relevant doses. (a) Study schematicCitation25 and dosing schedule in New Zealand rabbits. (b) Neutralizing activity (ID50 values) against the WT pseudovirus for sera samples from Day 0, Day 14 and Day 35 are shown. Dashed lines represent the limit of detection (LOD) of the assay. Samples below LOD were plotted at the number equivalent to half of the lowest serum dilution. Data shown represent mean ID50 (GMT ± 95% CI) for each group of six rabbits. Numbers above bars represent GMT values and fold-change between treatments. (c-d) PBMC cellular responses to WT spike peptide megapool on (c) days 0, 14, 35 and 85 or (d) responses to WT, Beta, Delta, BA.1 and BA.2 variant spike megapools at Day 35 measured by IFNγ ELISpot assay. Numbers above bars represent fold-change between treatments for each variant. Data shown represent IFNγ spots per one million cells of experimental triplicates (mean ± SEM) after DMSO subtraction. (b-d) ****P < .0001, **P < .01, *P ≤ .05 (2-way ANOVA, sidak’s multiple comparison).
Mechanisms associated with the mRNA and DNA vaccine immune profile
While the rabbit, guinea pig, and hamster studies revealed striking differences in the profiles of immune responses against the SARS-CoV-2 Spike antigen of DNA and mRNA vaccines, a lack of immunological reagents available in these models hampered further mechanistic studies. Thus, we proceeded to explore and identify the mechanisms involved in the mouse model. Our hypothesis was that the strong antibody response observed with mRNA vaccines was associated with the generation of a T follicular helper (Tfh) cell population helping the induction of B cells, while the strong T cell response associated with DNA vaccines may be related to a T helper type 1 (Th1)-biased immune response driving T cell differentiation and effector function (, S2 and S3). Mice received two doses of 10 μg of INO-4800 or 1 μg of BNT162b2 on Days 0 and 21 and immune responses were assessed on Day 28. Interestingly, in the inbred mouse models, the immune profiles observed in the other preclinical models did not hold. In both C57BL6 and BALB/c mice we still observed a strong humoral response after mRNA vaccination ( and S3b), but the T cell response was more balanced compared to DNA vaccination ( and S3c, e). This indicates that different T cell immune mechanisms may be operating in the inbred mouse models, which lack MHC diversity, compared to the other diverse outbred MHC preclinical models. To further explore the mechanisms associated with the observed differences in T cell response, we assessed polyfunctional cellular responses after two doses of INO-4800 or BNT162b2 in BALB/c (Figure S3a). Interestingly, mice immunized with INO-4800 showed significantly higher levels of Th1 cytokines in the activated CD4+ T cell population, compared to BNT162b2 vaccination (Figure S3d,f). Moreover, the Th2 cytokine population in activated CD4+ T cells is comparable between DNA and mRNA, and below the levels observed for the control group (Figure S3g). In contrast, the levels of IFNγ, TNFα, and IL-2 in the activated CD8+ T cell population are significantly higher in the mRNA group, compared with animals immunized with INO-4800 (Figure S3f). These findings are aligned with the IFNγ cellular responses observed in isolated CD4+ and CD8+ T cells from whole splenocytes (Figure S3d,e).
Figure 4. Cellular and humoral mechanisms involved in mRNA and DNA vaccination in C57BL6 mice. (a) Neutralizing activity (ID50 values) against the WT pseudovirus for sera samples from day 28 are shown. Dashed line represents the limit of detection (LOD) of the assay. Samples below LOD were plotted at the number equivalent to half of the lowest serum dilution. Bars represent mean ID50 (GMT ± 95% CI) for each group of eight mice. Numbers above bars represent the GMT. (b) Splenocyte cellular responses to WT spike peptide megapool at day 28, measured by IFNγ ELISpot assay. Bars represent the mean ± SEM of experimental triplicates shown as IFNγ spots per million cells after DMSO subtraction. Frequency of (c) Tfh, (d) activated Tfh, (e) GC B and (f) spike-specific GC B cells from spleens of vaccinated mice on day 28 is shown. To assess frequency of Tfh cells and activated Tfh and CD4 T cells, splenocytes were stained with CD4, CD3, CXCR5, PD-1, live-dead; CD25, and ICOS antibodies. To assess frequency of GC B and spike-specific GC B cells, splenocytes were stained with live-dead staining, biotinylated spike-tetramers, CD3, B220, GL7 and CD95 antibodies for a flow cytometric analysis. ****P < .0001, ***P < .001, **P < .01, *P ≤ .05 (Kruskal Wallis test).
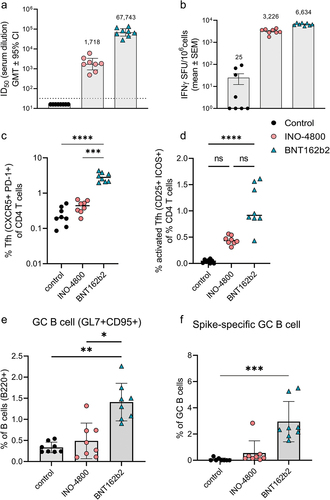
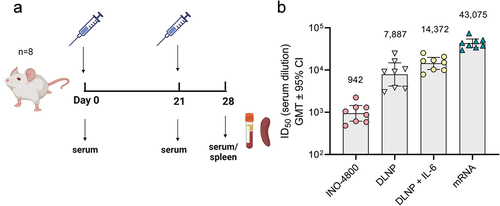
While different mechanisms may operate in the mouse model’s T cell axis, the antibody profile in mice matched the other species after nucleic acid vaccination. We proceeded to compare the mechanisms involved in the induction of antibody responses. The Tfh cells are a specialized population of CD4+ T cells that have been shown to play a critical role in helping B cells produce antibodies in germinal centers of secondary lymphoid organs.Citation28 We measured the Tfh cell frequency as a percentage of CD4+ splenocytes (). In BNT162b2 vaccinated mice, the CXCR5+PD-1+ Tfh cells represented 2.9% of CD4+ T cells compared to 0.44% in INO-4800-vaccinated animals (). We proceeded to measure whether the upregulation of frequency of Tfh cells was antigen-specific. Here, we measured the frequency of activated Tfh cells after stimulation with SARS-CoV-2 spike antigen. We observed a higher level of upregulation in activated Tfh cells in the BNT162b2-vaccinated compared to the INO-4800 vaccinated animals (). Additionally, we measured whether the increased level of Tfh cells correlated with an upregulation of antigen-specific germinal center (GC) B cells. We observed an upregulation of GC B cells in BNT162b2 vaccinated animals (). Employing a SARS-CoV-2 spike tetramer molecule, we measured the upregulation of antigen-specific GC B cells (). These data indicate that mRNA vaccines may more effectively target the Tfh axis to help GC B cell production of antibodies than the iteration of DNA vaccine tested so far. Based on these findings we explored whether components of the Tfh cell GC B cell axis could be exploited to induce stronger humoral responses by a DNA vaccine formulation. We tested a SARS-CoV-2 spike RBD nanoparticle construct encoded by pDNA, termed DNA-launched nanoparticle (DLNP).Citation29 After DNA vaccination, the encoded DLNPs have been shown to traffic to the draining lymph nodes where they can potentially engage the Tfh B cell GC axis.Citation30 Additionally, we assessed whether IL-6 addition may have an immunostimulatory role (). In mice, IL-6 can be induced by the LNPs used in mRNA vaccine formulations and has been shown to drive Tfh cell and GC B cell activation.Citation31 Using a DLNP encoding, the SARS-CoV-2 Spike RBD in combination with IL-6-expressing pDNA, BALB/c mice were immunized, and the humoral response compared against INO-4800 and mRNA-1273. We observed an approximately 15-fold increase in neutralization titers (942 vs 14,372 ID50) compared to standard INO-4800 DNA vaccination (). In summary, the data support the Tfh cell GC axis as an important component of the induction of the humoral response by mRNA vaccines and suggest that targeting of this axis may enhance the humoral response induced by DNA vaccines.
Figure 5. Evaluation of humoral immune response enhancements in BALB/c mice. (a) Study schematicCitation25 and dosing regimen in BALB/c. (b) Neutralizing activity (ID50 values) against the WT pseudovirus for sera samples from day 28 are shown. Data shown represent mean ID50 (GMT ± 95% CI) for each group of eight mice. GMT values are plotted above bars for reference.
Discussion
The data presented here highlight the distinct immune response characteristics related to two different nucleic acid vaccine modalities. In a variety of outbred animal models, we have shown that intramuscular mRNA vaccination presented a strong humoral response and weak T cell response, while the reverse was true with intradermal DNA vaccination.
The studies highlighted the differences using vaccines targeting the SARS-CoV-2 Spike antigen and deployed as medical counter measures during the COVID-19 pandemic. The results support the utility of the mRNA vaccine platform as immediate countermeasure in the protection and control of the initial spread of the virus. The high levels of antibodies associated with the mRNA vaccines may prevent infection by blocking the interaction of the SARS-Cov-2 spike antigen with the human ACE-2 receptor, neutralizing the virus and preventing infection of the human host.Citation33 This mechanism of protection was likely the main component mediating the high efficacy initially reported for the mRNA vaccines and has been predicted as an important correlate of protection.Citation16,Citation34,Citation35 However, the circulating levels of antibodies elicited by vaccination wane over time and have been shown to be susceptible to a loss of activity upon structural changes of the viral target.Citation36–38 For example, the Omicron SARS-CoV-2 VOC demonstrated almost complete escape from neutralization by serum antibodies in vaccinees receiving two doses of the original WT SARS-CoV-2 spike designed vaccines.Citation36,Citation39,Citation40 The loss of neutralizing antibody activity was also observed in the preclinical models employed here. In response, developers have taken advantage of a strength of the nucleic acid vaccine platform, which is the ability to rapidly design and manufacture next-generation vaccines to target new variants of its original viral strain.Citation41 Although mRNA vaccines designed to match SARS-CoV-2 Omicron spike antigen variants are currently being used, antigen imprinting from previous ancestral spike-matched vaccines or infections may negatively impact responses to these new VOCs.Citation42–44
While antibodies have been shown to lose activity against a constantly changing viral target, the T cell response has demonstrated resilience.Citation45,Citation46 While neutralizing antibody targets are restricted to a limited number of structural domains on the spike antigen whose changes are the focus of immune escape mechanisms, T cells recognize a broad range of epitopes across the whole SARS-CoV-2 viral genome.Citation47,Citation48 In fact, in mRNA-vaccinated recipients, T cell responses were preserved across SARS-CoV-2 VOCs, from Alpha to Omicron. However, recognition of Omicron RBD by memory B cells was significantly reduced.Citation49 This indicates the presence of preserved T cell epitopes across a broad range of SARS-CoV-2 VOCs, despite the constant change in viral landscape.Citation49 This is in line with the findings reported in our study, where T cell responses by both mRNA and DNA vaccine modalities were maintained across a wide-breadth of SARS-CoV-2 VOCs spike antigens. However, there was a significant difference in the magnitude of the IFNγ T cell response between the two nucleic acid platforms. T cell responses elicited by mRNA were consistently lower across the outbred preclinical models. A similar finding has been reported in a study where non-human primates boosted with mRNA-1273 following homologous primary series showed low levels of spike-specific CD4+ and CD8+ T cells in the blood following booster vaccination.Citation50
Despite the in-depth characterization of the immune responses in a variety of preclinical animal models, head-to-head data does not exist in humans. The strong cellular profile observed for the DNA vaccine may contribute to disease protection and prevention from severe SARS-CoV-2.Citation51,Citation52 Unfortunately, human efficacy data with INO-4800 are not available, and a correlate between T cell responses and disease protection has yet to be defined with this vaccine. Nevertheless, in the absence or reduction of neutralizing antibodies, T cell responses have been associated with COVID-19 disease protection.Citation53–58 The waning of antibodies without T cell coverage limits the ability of vaccines to confer long-lasting immunity. In turn, the ability of a vaccine to induce T cells may be particularly important in the immunocompromised population who have received B cell-depleting therapies.Citation59 For instance, in cancer patients with B cell deficiencies, CD8 T cell responses were associated with milder COVID-19 disease.Citation60
Limitations of the current study are associated with the lack of analysis of the mechanisms associated with the differential immune responses in the hamster, rabbit, and guinea pig models. Unfortunately, there is a paucity of immunological reagents available in these models to further explore the innate and adaptive immune components associated with vaccine-elicited humoral and cellular responses. Only in recent years have standard T cell assays become available for these models.Citation61,Citation62 In this study, we employed the IFNγ ELISpot to measure T cell responses. More recently, novel technologies with increased sensitivity at detecting antigen-specific CD4+ and CD8+ T cells have been developed, enabling the detection of cellular responses from mRNA vaccination. Using a spheromer technology, which is more sensitive compared to tetramer staining, researchers found distinct CD8+ and CD4+ T cell kinetics after mRNA vaccination.Citation63
To further investigate the mechanism associated with the vaccines, we used two inbred mouse models, BALB/c and C57BL6. Interestingly, while the differential antibody response was replicated in these models, the IFNγ T cell response between the DNA and mRNA vaccines was similar. Thus, we focused our analysis on the mechanisms involved in the generation of humoral immune responses. Previous studies have reported the importance of induction of Tfh cells in mediating robust humoral immune responses to vaccines. Here, we clearly show an upregulated level of these cells in the recipients of the mRNA vaccine. It is predicted that LNP-delivered mRNA may be presented in the secondary lymphoid organs, such as lymph nodes and spleen, to Tfh cells where they interact with B cells and help promote their differentiation into plasma cells and memory B cells.Citation64 Associated with an increase in Tfh, we measured an upregulation of antigen-specific germinal B cells, thus identifying an immune axis that may be targeted to enhance the humoral responses driven by DNA vaccines. To this end, we examined whether targeting the Tfh cell population could enhance the humoral response induced by a DNA vaccine. The DNA vaccine constructs encoding an antigen scaffolded to nanoparticle can traffic efficiently to the draining lymph nodes, potentially targeting this axis. Furthermore, IL-6 is an important cytokine component that can impact the Tfh-B cell axis, which is enhanced by LNP-delivered vaccines.Citation31 Initial study has shown that a formulation of a SARS-CoV-2 RBD with a DNA-launched nanoparticle (DLNP) and IL-6 is associated with a strongly augmented humoral response ().
The data presented here clearly highlight the differences in the quality and magnitude of the immune responses induced by two different nucleic acid vaccine platforms. While DNA vaccines drive strong cellular immunity, mRNA vaccines drive humoral responses. This potentially positions each platform as a choice for different disease types: mRNA vaccines with their robust humoral responses may be ideal as prophylactic vaccines against acute infectious diseases, while therapeutic vaccines targeting chronic viral diseases may require the strong cellular immunity characteristic of DNA vaccines. The latter may also play an important role in protecting individuals from severe disease, particularly those immunocompromised.Citation52 In fact, Post-acute Sequelae of SARS-CoV-2 (PASC) infection, or long COVID, resulting from long-term symptoms associated with SARS-CoV-2 infection, is a significant medical concern that has not yet been fully characterized.Citation65,Citation66 Individuals with underlying pulmonary conditions, and obesity and the elderly are at increased risk for developing PASC.Citation32 mRNA vaccination in the immunocompromised population has been shown to elicit lower cellular responses compared to healthy individuals.Citation26,Citation27 The strong cellular response induced from our DNA vaccine may be a critical component required for the prevention of PASC. In summary, the findings presented herein demonstrate the potential of each vaccine platform to preferentially engage in specific arms of the immune system. Future studies may further investigate how the different nucleic acid vaccine platforms may be best matched to specific disease targets.
Supplementary figure 3_Andrade et al_Oct17 2023.tif
Download TIFF Image (1.7 MB)Supplementary figure 1_Andrade et al_Oct17 2023.tif
Download TIFF Image (477.6 KB)Supplementary figure 2_Andrade et al_Oct17 2023.tif
Download TIFF Image (326.7 KB)Disclosure statement
VMA, IM, RK, LJ, OB, LH, and TRFS are employees of and may hold stock options in Inovio Pharmaceuticals., Inc. DWK is the recipient of research funding from Inovio Pharmaceuticals, Inc.
Data availability statement
All data generated in this study have been presented in this manuscript and supplementary figures and no additional data are available.
Supplementary material
Supplemental data for this article can be accessed on the publisher’s website at https://doi.org/10.1080/21645515.2023.2281733.
Additional information
Funding
References
- Wolff JA, Malone RW, Williams P, Chong W, Acsadi G, Jani A. Direct gene transfer into mouse muscle in vivo. Science. 1990;247(4949 Pt 1):1465–12. doi:10.1126/science.1690918.
- Ulmer JB. Heterologous protection against influenza by injection of DNA encoding a viral protein. Science. 1993;259(5102):1745–9. doi:10.1126/science.8456302.
- Wang B, Ugen KE, Srikantan V, Agadjanyan MG, Dang K, Refaeli Y, Sato AI, Boyer J, Williams WV, Weiner DB, et al. Gene inoculation generates immune responses against human immunodeficiency virus type 1. Proc Natl Acad Sci USA. 1993;90(9):4156–60. doi:10.1073/pnas.90.9.4156.
- Aihara H, Miyazaki J. Gene transfer into muscle by electroporation in vivo. Nat Biotechnol. 1998;16(9):867–70. doi:10.1038/nbt0998-867.
- Felgner PL, Felgner PL, Gadek TR, Holm M, Roman R., Chan HW, Wenz M, Northrop JP, Ringold GM, Danielsen M. Lipofection: a highly efficient, lipid-mediated DNA-transfection procedure. Proc Natl Acad Sci USA. 1987;84(21):7413–7. doi:10.1073/pnas.84.21.7413.
- Johnston SA, Tang DC. Gene gun transfection of animal cells and genetic immunization. Methods Cell Biol. 1994;43 Pt A:353–65.
- Niidome T, Huang L. Gene therapy progress and prospects: nonviral vectors. Gene Ther. 2002;9(24):1647–52. doi:10.1038/sj.gt.3301923.
- Sardesai NY, Wei ner DB. Electroporation delivery of DNA vaccines: prospects for success. Curr Opin Immunol. 2011;23(3):421–9. doi:10.1016/j.coi.2011.03.008.
- Tomizawa M, Shinozaki F., Motoyoshi Y., Sugiyama T., Yamamoto S., Sueishi M. Sonoporation: gene transfer using ultrasound. World J Methodol. 2013;3(4):39–44. doi:10.5662/wjm.v3.i4.39.
- Kichaev G, Mendoza JM, Amante D, Smith TR, McCoy JR, Sardesai NY, Broderick KE. Electroporation mediated DNA vaccination directly to a mucosal surface results in improved immune responses. Hum Vaccin Immunother. 2013;9(10):2041–8. doi:10.4161/hv.25272.
- Sheridan C. First COVID-19 DNA vaccine approved, others in hot pursuit. Nat Biotechnol. 2021;39(12):1479–82. doi:10.1038/d41587-021-00023-5.
- Kariko K, Buckstein M, Ni H, Weissman D. Suppression of RNA recognition by toll-like receptors: the impact of nucleoside modification and the evolutionary origin of RNA. Immunity. 2005;23(2):165–75. doi:10.1016/j.immuni.2005.06.008.
- Hou X, Zaks T, Langer R, Dong Y. Lipid nanoparticles for mRNA delivery. Nat Rev Mater. 2021;6(12):1078–94. doi:10.1038/s41578-021-00358-0.
- Anderson EJ, Rouphael NG, Widge AT, Jackson LA, Roberts PC, Makhene M, Chappell JD, Denison MR, Stevens LJ, Pruijssers AJ, et al. Safety and immunogenicity of SARS-CoV-2 mRNA-1273 vaccine in older adults. N Engl J Med. 2020;383(25):2427–38. doi:10.1056/NEJMoa2028436.
- Baden LR, El Sahly HM, Essink B, Follmann D, Neuzil KM, August A, Clouting H, Fortier G, Deng W, Han S, et al. Phase 3 trial of mRNA-1273 during the Delta-variant surge. N Engl J Med. 2021;385(26):2485–7. doi:10.1056/NEJMc2115597.
- Polack FP, Thomas SJ, Kitchin N, Absalon J, Gurtman A, Lockhart S, Perez JL, Pérez Marc G, Moreira ED, Zerbini C, et al. Safety and efficacy of the BNT162b2 mRNA covid-19 vaccine. N Engl J Med. 2020;383(27):2603–15. doi:10.1056/NEJMoa2034577.
- Walsh EE, Frenck RW, Falsey AR, Kitchin N, Absalon J, Gurtman A, Lockhart S, Neuzil K, Mulligan MJ, Bailey R, et al. Safety and immunogenicity of two RNA-Based covid-19 vaccine candidates. N Engl J Med. 2020;383(25):2439–50. doi:10.1056/NEJMoa2027906.
- Barnes CO, West AP, Huey-Tubman KE, Hoffmann MAG, Sharaf NG, Hoffman PR, Koranda N, Gristick HB, Gaebler C, Muecksch F, et al. Structures of human antibodies bound to SARS-CoV-2 spike reveal common epitopes and recurrent features of antibodies. Cell. 2020;182(4):828–42 e16. doi:10.1016/j.cell.2020.06.025.
- Tebas P, Yang S, Boyer JD, Reuschel EL, Patel A, Christensen-Quick A, Andrade VM, Morrow MP, Kraynyak K, Agnes J, et al. Safety and immunogenicity of INO-4800 DNA vaccine against SARS-CoV-2: a preliminary report of an open-label, phase 1 clinical trial. EClinicalMedicine. 2021;31:100689. doi:10.1016/j.eclinm.2020.100689.
- Smith TRF, Patel A, Ramos S, Elwood D, Zhu X, Yan J, Gary EN, Walker SN, Schultheis K, Purwar M, et al. Immunogenicity of a DNA vaccine candidate for COVID-19. Nat Commun. 2020;11(1):2601. doi:10.1038/s41467-020-16505-0.
- Munoz-Fontela C, Dowling WE, Funnell SGP, Gsell P-S, Riveros-Balta AX, Albrecht RA, Andersen H, Baric RS, Carroll MW, Cavaleri M, et al. Animal models for COVID-19. Nature. 2020;586(7830):509–15. doi:10.1038/s41586-020-2787-6.
- Chu H, Chan JF, Yuen KY. Animal models in SARS-CoV-2 research. Nat Methods. 2022;19(4):392–4. doi:10.1038/s41592-022-01447-w.
- Corbett KS, Edwards DK, Leist SR, Abiona OM, Boyoglu-Barnum S, Gillespie RA, Himansu S, Schäfer A, Ziwawo CT, DiPiazza AT, et al. SARS-CoV-2 mRNA vaccine design enabled by prototype pathogen preparedness. Nature. 2020;586(7830):567–71. doi:10.1038/s41586-020-2622-0.
- Vogel AB, Kanevsky I, Che Y, Swanson KA, Muik A, Vormehr M, Kranz LM, Walzer KC, Hein S, Güler A, et al. BNT162b vaccines protect rhesus macaques from SARS-CoV-2. Nature. 2021;592(7853):283–9. doi:10.1038/s41586-021-03275-y.
- Figure schematics created with biorender.com.
- Oyaert M, De Scheerder M-A, Van Herrewege S, Laureys G, Van Assche S, Cambron M, Naesens L, Hoste L, Claes K, Haerynck F, et al. Evaluation of humoral and cellular responses in SARS-CoV-2 mRNA vaccinated immunocompromised patients. Front Immunol. 2022;13:858399. doi:10.3389/fimmu.2022.858399.
- Amodio D, Ruggiero A, Sgrulletti M, Pighi C, Cotugno N, Medri C, Morrocchi E, Colagrossi L, Russo C, Zaffina S, et al. Humoral and cellular response following vaccination with the BNT162b2 mRNA COVID-19 vaccine in patients affected by primary immunodeficiencies. Front Immunol. 2021;12:727850. doi:10.3389/fimmu.2021.727850.
- Shaan Lakshmanappa Y, Elizaldi SR, Roh JW, Schmidt BA, Carroll TD, Weaver KD, Smith JC, Verma A, Deere JD, Dutra J, et al. SARS-CoV-2 induces robust germinal center CD4 T follicular helper cell responses in rhesus macaques. Nat Commun. 2021;12(1):541. doi:10.1038/s41467-020-20642-x.
- Konrath KM, Liaw K, Wu Y, Zhu X, Walker SN, Xu Z, Schultheis K, Chokkalingam N, Chawla H, Du J, et al. Nucleic acid delivery of immune-focused SARS-CoV-2 nanoparticles drives rapid and potent immunogenicity capable of single-dose protection. Cell Rep. 2022;38(5):110318. doi:10.1016/j.celrep.2022.110318.
- Xu Z, Wise MC, Chokkalingam N, Walker S, Tello‐Ruiz E, Elliott STC, Perales‐Puchalt A, Xiao P, Zhu X, Pumroy RA, et al. In vivo assembly of nanoparticles achieved through synergy of structure-Based protein engineering and synthetic DNA generates enhanced adaptive immunity. Adv Sci (Weinh). 2020;7(8):1902802. doi:10.1002/advs.201902802.
- Alameh MG, Tombácz I, Bettini E, Lederer K, Ndeupen S, Sittplangkoon C, Wilmore JR, Gaudette BT, Soliman OY, Pine M, et al. Lipid nanoparticles enhance the efficacy of mRNA and protein subunit vaccines by inducing robust T follicular helper cell and humoral responses. Immunity. 2021;54(12):2877–92 e7. doi:10.1016/j.immuni.2021.11.001.
- Halpin S, O’Connor R, Sivan M. Long COVID and chronic COVID syndromes. J Med Virol. 2021;93(3):1242–3. doi:10.1002/jmv.26587.
- Chen Y, Zhao X, Zhou H, Zhu H, Jiang S, Wang P. Broadly neutralizing antibodies to SARS-CoV-2 and other human coronaviruses. Nat Rev Immunol. 2023;23(3):189–99. doi:10.1038/s41577-022-00784-3.
- Goldblatt D, Alter G, Crotty S, Plotkin SA. Correlates of protection against SARS-CoV-2 infection and COVID-19 disease. Immunol Rev. 2022;310(1):6–26. doi:10.1111/imr.13091.
- Khoury DS, Cromer D, Reynaldi A, Schlub TE, Wheatley AK, Juno JA, Subbarao K, Kent SJ, Triccas JA, Davenport MP, et al. Neutralizing antibody levels are highly predictive of immune protection from symptomatic SARS-CoV-2 infection. Nat Med. 2021;27(7):1205–11. doi:10.1038/s41591-021-01377-8.
- Evans JP, Zeng C, Carlin C, Lozanski G, Saif LJ, Oltz EM, Gumina RJ, Liu S-L. Neutralizing antibody responses elicited by SARS-CoV-2 mRNA vaccination wane over time and are boosted by breakthrough infection. Sci Transl Med. 2022;14(637):eabn8057. doi:10.1126/scitranslmed.abn8057.
- Horne EMF, Hulme WJ, Keogh RH, Palmer TM, Williamson EJ, Parker EPK, Green A, Walker V, Walker AJ, Curtis H, et al. Waning effectiveness of BNT162b2 and ChAdOx1 COVID-19 vaccines over six months since second dose: OpenSAFELY cohort study using linked electronic health records. BMJ. 2022;378:e071249. doi:10.1136/bmj-2022-071249.
- Cao Y, Wang J, Jian F, Xiao T, Song W, Yisimayi A, Huang W, Li Q, Wang P, An R, et al. Omicron escapes the majority of existing SARS-CoV-2 neutralizing antibodies. Nature. 2022;602(7898):657–63. doi:10.1038/s41586-021-04385-3.
- Kotaki R, Adachi Y, Moriyama S, Onodera T, Fukushi S, Nagakura T, Tonouchi K, Terahara K, Sun L, Takano T, et al. SARS-CoV-2 Omicron-neutralizing memory B cells are elicited by two doses of BNT162b2 mRNA vaccine. Sci Immunol. 2022;7(70):eabn8590. doi:10.1126/sciimmunol.abn8590.
- Sievers BL, Chakraborty S, Xue Y, Gelbart T, Gonzalez JC, Cassidy AG, Golan Y, Prahl M, Gaw SL, Arunachalam PS, et al. Antibodies elicited by SARS-CoV-2 infection or mRNA vaccines have reduced neutralizing activity against Beta and Omicron pseudoviruses. Sci Transl Med. 2022;14(634):eabn7842. doi:10.1126/scitranslmed.abn7842.
- van Riel D, de Wit E. Next-generation vaccine platforms for COVID-19. Nat Mater. 2020;19(8):810–2. doi:10.1038/s41563-020-0746-0.
- Wang Q, Bowen A, Valdez R, Gherasim C, Gordon A, Liu L, Ho DD. Antibody response to Omicron BA.4–BA.5 bivalent booster. N Engl J Med. 2023;388(6):567–9. doi:10.1056/NEJMc2213907.
- Collier ARY, Miller J, Hachmann NP, McMahan K, Liu J, Bondzie EA, Gallup L, Rowe M, Schonberg E, Thai S, et al. Immunogenicity of BA.5 bivalent mRNA vaccine boosters. N Engl J Med. 2023;388(6):565–7. doi:10.1056/NEJMc2213948.
- Wheatley AK, Fox A, Tan H-X, Juno JA, Davenport MP, Subbarao K, Kent SJ. Immune imprinting and SARS-CoV-2 vaccine design. Trends Immunol. 2021;42(11):956–9. doi:10.1016/j.it.2021.09.001.
- Guo L, Wang G, Wang Y, Zhang Q, Ren L, Gu X, Huang T, Zhong J, Wang Y, Wang X, et al. SARS-CoV-2-specific antibody and T-cell responses 1 year after infection in people recovered from COVID-19: a longitudinal cohort study. Lancet Microbe. 2022;3(5):e348–e56. doi:10.1016/S2666-5247(22)00036-2.
- Vardhana S, Baldo L, Morice WG, Wherry EJ. Understanding T cell responses to COVID-19 is essential for informing public health strategies. Sci Immunol. 2022;7(71):eabo1303. doi:10.1126/sciimmunol.abo1303.
- Grifoni A, Weiskopf D, Ramirez SI, Mateus J, Dan JM, Moderbacher CR, Rawlings SA, Sutherland A, Premkumar L, Jadi RS, et al. Targets of T cell responses to SARS-CoV-2 coronavirus in humans with COVID-19 disease and unexposed individuals. Cell. 2020;181(7):1489–501.e15. doi:10.1016/j.cell.2020.05.015.
- Tarke A, Sidney J, Kidd CK, Dan JM, Ramirez SI, Yu ED, Mateus J, da Silva Antunes R, Moore E, Rubiro P, et al. Comprehensive analysis of T cell immunodominance and immunoprevalence of SARS-CoV-2 epitopes in COVID-19 cases. Cell Rep Med. 2021;2(2):100204. doi:10.1016/j.xcrm.2021.100204.
- Tarke A, Coelho CH, Zhang Z, Dan JM, Yu ED, Methot N, Bloom NI, Goodwin B, Phillips E, Mallal S, et al. SARS-CoV-2 vaccination induces immunological T cell memory able to cross-recognize variants from Alpha to Omicron. Cell. 2022;185(5):847–59 e11. doi:10.1016/j.cell.2022.01.015.
- Routhu NK, Stampfer SD, Lai L, Akhtar A, Tong X, Yuan D, Chicz TM, McNamara RP, Jakkala K, Davis-Gardner ME, et al. Efficacy of mRNA-1273 and Novavax ancestral or BA.1 spike booster vaccines against SARS-CoV-2 BA.5 infection in non-human primates. Sci Immunol. 2023;8:eadg7015. doi:10.1126/sciimmunol.adg7015.
- Asplund Hogelin K, Ruffin N, Pin E, Månberg A, Hober S, Gafvelin G, Grönlund H, Nilsson P, Khademi M, Olsson T, et al. Development of humoral and cellular immunological memory against SARS-CoV-2 despite B cell depleting treatment in multiple sclerosis. iScience. 2021;24(9):103078. doi:10.1016/j.isci.2021.103078.
- Hermens JM, Kesmir C. Role of T cells in severe COVID-19 disease, protection, and long term immunity. Immunogenetics. 2023;75(3):295–307. doi:10.1007/s00251-023-01294-9.
- Dowell AC, Ireland G, Zuo J, Moss P, Ladhani S. Association of spike-specific T cells with relative protection from subsequent SARS-CoV-2 Omicron infection in young children. JAMA Pediatr. 2023;177(1):96–7. doi:10.1001/jamapediatrics.2022.3868.
- Scurr MJ, Lippiatt G, Capitani L, Bentley K, Lauder SN, Smart K, Somerville MS, Rees T, Stanton RJ, Gallimore A, et al. Magnitude of venous or capillary blood-derived SARS-CoV-2-specific T cell response determines COVID-19 immunity. Nat Commun. 2022;13(1):5422. doi:10.1038/s41467-022-32985-8.
- Sekine T, Perez-Potti A, Rivera-Ballesteros O, Strålin K, Gorin J-B, Olsson A, Llewellyn-Lacey S, Kamal H, Bogdanovic G, Muschiol S, et al. Robust T cell immunity in convalescent individuals with asymptomatic or mild COVID-19. Cell. 2020;183(1):158–68.e14. doi:10.1016/j.cell.2020.08.017.
- Koutsakos M, Reynaldi A, Lee WS, Nguyen J, Amarasena T, Taiaroa G, Kinsella P, Liew KC, Tran T, Kent HE, et al. SARS-CoV-2 breakthrough infection induces rapid memory and de novo T cell responses. Immunity. 2023;56(4):879–92.e4. doi:10.1016/j.immuni.2023.02.017.
- McMahan K, Yu J, Mercado NB, Loos C, Tostanoski LH, Chandrashekar A, Liu J, Peter L, Atyeo C, Zhu A, et al. Correlates of protection against SARS-CoV-2 in rhesus macaques. Nature. 2021;590(7847):630–4. doi:10.1038/s41586-020-03041-6.
- Kingstad-Bakke B, Lee W, Chandrasekar SS, Gasper DJ, Salas-Quinchucua C, Cleven T, Sullivan JA, Talaat A, Osorio JE, Suresh M, et al. Vaccine-induced systemic and mucosal T cell immunity to SARS-CoV-2 viral variants. Proc Natl Acad Sci USA. 2022;119(20):e2118312119. doi:10.1073/pnas.2118312119.
- Bange EM, Han NA, Wileyto P, Kim JY, Gouma S, Robinson J, Greenplate AR, Hwee MA, Porterfield F, Owoyemi O, et al. CD8(+) T cells contribute to survival in patients with COVID-19 and hematologic cancer. Nat Med. 2021;27(7):1280–9. doi:10.1038/s41591-021-01386-7.
- Wherry EJ, Barouch DH. T cell immunity to COVID-19 vaccines. Sci. 2022;377(6608):821–2. doi:10.1126/science.add2897.
- Schultheis K, Schaefer H, Yung BS, Oh J, Muthumani K, Humeau L, Broderick KE, Smith TRF. Characterization of guinea pig T cell responses elicited after EP-assisted delivery of DNA vaccines to the skin. Vaccine. 2017;35(1):61–70. doi:10.1016/j.vaccine.2016.11.052.
- Yung BS, Pugh H, Generotti AA, Phanhthilath N, Schultheis K, Muthumani K, Broderick KE, Smith TRF. Novel IFN-γ ELISpot reveals robust T cell responses elicited after influenza nucleoprotein DNA vaccination in New Zealand White rabbits. Vaccine. 2019;37(7):903–9. doi:10.1016/j.vaccine.2019.01.006.
- Gao F, Mallajosyula V, Arunachalam PS, van der Ploeg K, Manohar M, Röltgen K, Yang F, Wirz O, Hoh R, Haraguchi E, et al. Spheromers reveal robust T cell responses to the pfizer/BioNTech vaccine and attenuated peripheral CD8+ T cell responses post SARS-CoV-2 infection. Immunity. 2023;56(4):864–78 e4. doi:10.1016/j.immuni.2023.03.005.
- Pardi N, Hogan MJ, Naradikian MS, Parkhouse K, Cain DW, Jones L, Moody MA, Verkerke HP, Myles A, Willis E, et al. Nucleoside-modified mRNA vaccines induce potent T follicular helper and germinal center B cell responses. J Exp Med. 2018;215(6):1571–88. doi:10.1084/jem.20171450.
- Davis HE, Assaf GS, McCorkell L, Wei H, Low RJ, Re’em Y, Redfield S, Austin JP, Akrami A. Characterizing long COVID in an international cohort: 7 months of symptoms and their impact. EClinicalMedicine. 2021;38:101019. doi:10.1016/j.eclinm.2021.101019.
- Thaweethai T, Jolley SE, Karlson EW, Levitan EB, Levy B, McComsey GA, McCorkell L, Nadkarni GN, Parthasarathy S, Singh U, et al. Development of a definition of postacute sequelae of SARS-CoV-2 infection. JAMA. 2023;329(22):1934–46. doi:10.1001/jama.2023.8823.