
ABSTRACT
With the increasing number of genetically modified (GM) events, traits, and crops that are developed to benefit the global population, approval of these technologies for food, feed, cultivation and import in each country may vary depending on needs, demand and trade interest. ISAAA established a GMO Approval Database to document global approvals of biotech crops. GM event name, crops, traits, developer, year of approval for cultivation, food/feed, import, and relevant dossiers were sourced from credible government regulatory websites and biosafety clearinghouses. This paper investigates the trends in GM approvals for food, feed and cultivation based on the number of approving countries, GM crops, events, and traits in the last 23 y (1992–2014), rationale for approval, factors influencing approvals, and their implications in GM crop adoption. Results show that in 2014, there was an accumulative increase in the number of countries granting approvals at 29 (79% developing countries) for commercial cultivation and 31 (70% developing countries) for food and 19 (80% developing developing) for feed; 2012 had the highest number of approving countries and cultivation approvals; 2011 had the highest number of country approvals for feed, and 2014 for food approvals. Herbicide tolerance trait had the highest events approved, followed by insect tolerance traits. Approvals for food product quality increased in the second decade. Maize had the highest number of events approved (single and stacked traits), and stacked traits product gradually increased which is already 30% of the total trait approvals. These results may indicate understanding and acceptance of countries to enhance regulatory capability to be able to benefit from GM crop commercialization. Hence, the paper provided information on the trends on the growth of the GM crop industry in the last 23 y which may be vital in predicting future GM crops and traits.
Abbreviations
| GM/GMO | = | genetically modified/genetically modified organisms |
| GE | = | genetically engineered |
| ISAAA | = | International Service for the Acquisition of Agri-Biotech Applications |
| KFDA | = | Korean Food and Drug Administration |
| EU | = | European Union |
| Bt | = | Bacillus thuringiensis |
| MT | = | million tonnes |
| HT | = | herbicide tolerance |
| IR | = | insect resistance |
| PQ | = | plant quality |
| PC | = | pollination control |
| DR | = | disease resistance |
| ST | = | stress tolerance |
Introduction
Biotech crops are the fastest agricultural technology adopted globally in terms of hectarage and number of farmers. Since the first commercial deployment of a biotech crop, the Flavr Savr tomato in 1992, other biotech crops with various traits have been developed and commercialized. There has been more than 100-fold increase in hectarage of biotech crops recorded from 1996 at 1.7 million hectares to 2014 at 181.5 million hectares (James, Citation2014). Major genetically modified (GM) crops commercialized globally are soybean (90.7 million hectares), maize (55.2 million ha), cotton (25.1 million ha), canola (9.0 million ha) and other minor crops such as sugar beet, alfalfa, papaya, squash and poplar (1.4 million hectares). Agricultural input traits such as herbicide tolerance deployed in 102.6 million hectares of biotech crops, insect resistance at 27.4 million hectares and stacked traits at 51.4 million ha comprise 99% of the global biotech crop traits in 2014 (James, Citation2014).
The phenomenal increase in adoption of biotech crop technology can be attributed to its contribution to: food production increases, thus improving food availability at the local and global levels; food and food quality; and economic and social impact of farming communities (James, Citation2014). During the 19 y of widescale commercialization, the 4 major biotech crops increased crop production valued at $133.5 billion of which 30% were due to reduced production costs and 70% due to substantial yield gains of 441.4 million tonnes (Brookes and Barfoot, 2015). Biotech crops are considered safer than, or as safe as conventional counterparts and emerging biotech crops target nutritional problems of developing countries such as protein, vitamin and mineral deficiencies (Lemaux, Citation2008; Nicolia et al., Citation2014; Paterson, Citation2015). This technology is helping alleviate hunger and poverty of > 16.5 million small farmers and their families totalling > 65 million people, who are some of the poorest people in the world. With the current problems on loss of biodiversity and limited arable lands, biotech crops contribute to a sustainable intensification strategy which allows productivity to be increased only on the current 1.5 billion hectares of global crop land, thereby saving forests and biodiversity. As with conventional crops, the technology also should be used together with good farming practices such as rotations and resistance management (James, Citation2014).
In the development and commercialization of biotech crops, technology providers respond to the needs of farmers and consumers for improved agronomic and nutritional traits. Continuous development of biotech crops is expected as farmers and consumers demand improved agronomic traits and nutritional traits. Such development entails a long process of product development that includes the following stages (Stein and Rodriguez-Cerezo, Citation2010):
Early research and development stages – this is the initial proof of concept stage which involves identifying and isolating the gene in the laboratory; there may as yet be no plan for commercialization;
Advanced research and development – selected transformation events have gone through confined field tests for one location and anticipating multiple location field trials;
Regulatory pipeline – agronomic data and expression level data of introduced genes in the advanced GM line are collected from multiple location field trials as prerequisite to commercialization;
Commercial pipeline – GM event is authorized in at least one country for food/feed/processing, but not marketed yet; and
Commercial GM crops – approved GM event planted and marketed
The range of GM events under research and development, in the course of approval or scheduled for release for commercial use are all part of the GMO pipeline. In addition to the GM events that are commercialized, there are also those which have been developed, tested and then abandoned for commercial purpose, but which may still be present in the environment
Adoption of biotech crops for cultivation and import is dependent on the country's need for the commodity as food, feed, clothing and other diverse purposes. Thus, approval of GM events in various crops varies from year-to-year since wide scale commercialization started in 1996. A GMO Approval Database (http://www.isaaa.org/gmapprovaldatabase/default.asp) was constructed by ISAAA to document global approvals of biotech crops. It features GM event name, crops, traits, developer, year of approval for cultivation for domestic and non-domestic use, food and feed approvals for direct use or processing, list of country authorizations and relevant dossiers sourced from credible government regulatory websites and biosafety clearinghouses.
Approvals are granted for food, feed and cultivation on a per event basis according to the regulations of the country. It is possible then for an event to receive 3 different approvals per country (food, feed and cultivation). All of the cultivation approvals recorded in the database is for planting either for domestic use or non-domestic use. Hence, environmental releases for field testing or in isolated locations are not considered in this database.
This paper investigates the trends in GM crop approvals for cultivation, food and feed for direct use or processing in the last 23 y (1992–2014), the trends in trait approvals, the probable causes and factors that resulted to variation in approvals per country, and their possible significance and implications in GM crop adoption in the future.
Country Approvals from 1992–2014
Country Approvals for Cultivation
1996 is considered to be the year when more than 1M hectares of GM crops were cultivated, thus, GM crop commercialization data used by ISAAA Annual Global Status of Commercialized Biotech/GM Crops is from 1996 to 2014. However, data for this paper is from 1992 to December 2014 – 1992 being the year when the first GM crop Flavr Savr tomato was given approval and commercialized for a limited time in the USA. shows the countries and the number of approvals for cultivation of GM crops within the period. Approvals were divided into 2 time periods: 1992 to 2003 (12 y denoted as first decade) and from 2004 to 2014 (11 years, denoted as second decade) to facilitate discussion and to highlight certain events in the approval history.
TABLE 1. Cultivation approvals from 1992 to 2014
From 1992–2003, 16 countries made a total of 224 planting approvals of biotech crops with the United States, Canada, Australia, South Africa and China being the top 5 countries. These include the 5 pioneering biotech countries: US, Argentina, Canada, China, Australia and Mexico which first approved genetically modified (GM) crops mentioned by James Citation(1996). In 1992–2003, Japan had planting approvals but no actual planting occurred. Costa Rica made its first approval in 2001 for biotech soybean but actual planting commenced in 2009 (James, Citation2009). Hence, cultivation approval is possible in a country but may not necessarily be followed by planting by farmers.
In 2004–2014, cultivation approvals almost doubled to 431, which were recorded in 29 countries, with 13 new countries granting approvals. This may indicate that countries were actively establishing their regulatory capability in order to benefit from GM crop commercialization.
Japan, Canada, USA, Brazil and Argentina were the top 5 approving countries. It can be noted that Japan has the highest number of approvals but has not been cultivating biotech crops up to the present. The EU approved only one GM crop (BASF's Amflora) in 2010. Hence, in the 11-year period, 29 countries (with EU-28 counted as 1) approved 431 applications for cultivation with the top 5 countries being, the US, Japan, Canada, Argentina, and Brazil. Only six in the 29 approving countries are industrial (USA, Canada, Japan, Australia, EU, and South Korea) and the rest (Brazil, Argentina, South Africa, Uruguay, Colombia, Costa Rica, Paraguay, Philippines, China, Mexico, Honduras, India, Chile, Bangladesh, Bolivia, Burkina Faso, Egypt, Iran. Myanmar, Pakistan, Panama, Cuba and Sudan) are developing countries, indicating adoption and acceptance of biotech crops in these countries. In 2014, 8 industrial countries and 20 developing countries planted biotech crops (James, Citation2014) with the EU countries planting biotech crops: Spain, Portugal, Czech Republic, Romania and Slovakia, counted separately.
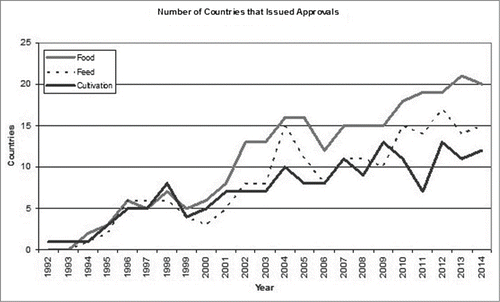
The trend in cultivation approvals presented in shows the gradual increase in the number of countries. There were a number of spikes and lows and the highest peak was recorded in 2012 as 13 countries issued cultivation approvals including Japan, Canada, Argentina, Colombia, Paraguay, Uruguay, Brazil Pakistan, Honduras, Panama, USA, South Africa and Sudan. Japan had the highest number of cultivation approvals at 17 (5 cotton, 6 maize, 5 soybean and 1 canola), followed by Canada with 9 approvals: 3 canola, 2 maize and 4 soybean. A total of 73 GM events were approved for cultivation in 5 crops: 37 for maize, 16 soybean, 13 cotton, 6 canola, and 1 rice. In 2012, James Citation(2012) also recorded the second highest number of countries actually planting biotech crops in a given year at 28. They were in order of hectarage: USA, Brazil, Argentina, Canada, India, China, Paraguay, South Africa, Pakistan, Uruguay, Bolivia, Philippines, Australia, Burkina Faso, Myanmar, Mexico, Spain, Chile, Colombia, Honduras, Sudan, Portugal, Czech Republic, Cuba, Egypt, Costa Rica, Romania, and Slovakia. Cuba and Sudan planted biotech crops for the first time in 2011 and 2012, respectively.
Figure 1. Number of countries that issued approvals (1992–2014).
Country Approvals for Food
In most countries, approval for food and feed are granted by 2 separate government agencies. Hence, food and feed approvals in this paper are treated individually, but not for instances when only one government agency provides both feed and food approvals. In the latter case, the specific approval can be included in both .
TABLE 2. Food approvals from 1992–2014
TABLE 3. Feed approvals granted in 1992–2014
Food approvals for direct use and processing from 1992 to 2014 were granted by 31 countries: 17 countries in the first 12 y and an additional 14 countries in the second 11 y (. The number of food approvals more than doubled from 480 in the first decade to 1025 in the second decade for a total of 1505 approvals. Japan, USA, Mexico, Canada, and South Korea were the top 5 countries that granted food approvals. Japan and South Korea are importing most of their food products from GM producing countries, hence expeditious and numerous approvals of GM crops is necessary to provide a continuous flow of food imports (Japan Ministry of Finance, Citation2013; South Korea, Agri-biotechnology Annual Report, Citation2011). Otherwise, there could be a negative impact in food availability and accessibility. USA, Mexico, and Canada are included in the top 5 countries with cultivation approvals which require food and feed safety approvals, hence, their inclusion in the top 5 countries that granted food and feed approvals. From the 31 countries that provided food approvals, only 9 countries were industrial and 22 countries were developing. This further confirms acceptance of biotech crops in developing countries as they establish and firm up their own regulatory system for continued GM food approvals.
Food approvals peaked in 2013 () where 21 countries approved 80 events in 6 crops: 1 event for alfalfa, 4 events for canola, 8 for cotton, 1 eggplant, 50 maize and 16 soybean. The top 4 approving countries in 2013 were Japan (with 13 approvals), EU (10), USA and China with 5 approvals.
Country Approvals for Feed
From 1992 to 2014, 1034 feed approvals for direct use and processing were granted by 28 countries: 12 countries in the first decade with 309 approvals and additional16 countries in the second decade with 725 approvals, a more than 2-fold increase. Japan, USA, Canada, South Korea and the Philippines were the top 5 countries that issued the highest number of feed approvals. Japan, South Korea and the Philippines are major importers of feed crops: maize and soybean for their livestock industry, which necessitates continuous and expeditious approvals of GM crops for feeds (Philippines Agbiotechnology Annual, Citation2014). In 2001, even if Japan ordered a mandatory labeling of GM food and feed ingredients with a 5% GM content limit, there was an increase in food and feed approvals reaching 40 (Japan Ministry of Finance, Citation2013; US Department of Agriculture, Citation2013). It can be noted that Japan and South Korea with the highest number of food and feed approvals are not included in the planting countries listed by Dr. Clive James in ISAAA's Annual Global Status of Commercialized Biotech/GM Crops. In addition, similar to food approvals, most of the countries that granted feed approvals were from developing countries, 19 out of the 28 total countries.
The highest number of feed approvals was observed in 2012 () where 88 approvals were granted by 17 countries in 55 events and 5 crops: canola with (5 events), cotton (8), maize (27), rice (1) and soybean (14). The top 5 countries with the highest number of feed approvals were South Korea with 16 approvals, Colombia (14) Canada (9), USA and Japan with 8.
Number of Approvals from 1992 to 2014
shows the number of approvals for cultivation, feed and food per year. Cultivation approvals peaked in 2012 with 56 approvals from 14 countries, 46 events in 4 crops. Japan had the highest cultivation approvals with 17 in 5 crops: 1 approval for canola, 5 cotton, 6 maize, and 5 soybean. This is followed by Canada (9), Uruguay (7), Paraguay (6) and Argentina (5). Food approvals were highest in 2014 with 150 approvals from 20 countries in 99 events in 7 crops. Singapore had the highest with 18 approvals, followed by USA (16), South Korea (14), Philippines (12) and Taiwan (11). Feed approvals on the other hand peaked in 2011 with 117 approvals in 14 countries and 79 events in 6 crops. South Africa had the highest number of approvals at 24, followed by Turkey (19), Japan (15), South Korea (11) and Colombia (7).
Figure 2. Number of GM approvals from 1992–2014.
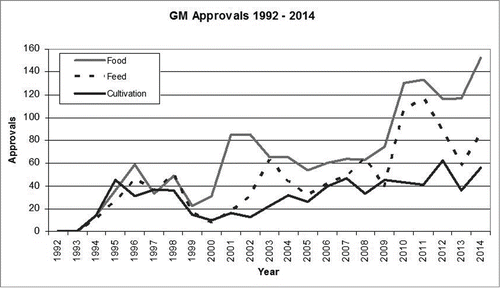
Some of the notable occurrences that have expedited the approval process in some countries include the lifting of temporary regulatory moratorium in South Africa on importing commodity grain containing events not yet approved in the country in 2011, hence expeditious approval of GM crops ensued (James, Citation2014). In 2010, the Turkish Millers Association submitted dossiers for approval of 3 soybean events. Due to the urgent need for these products by the animal sector, the Biosafety Board decided to review the applications under the simplified procedure, designed to reach a conclusion within 90 d as opposed to the 270 d allowed under regular review (Turkey, Agricultural Biotechnology Annual, Citation2012).
Similarly in Argentina, the government unveiled a new plan for commercial registration of GM products that would cut approval times by 50%; comparable to Brazil and the USA (Argentina Agri-biotechnology Annual Report, Citation2011). The US had similar strategy when in 2012, the Agricultural Plant Health Inspection Service took steps to make the approval process more efficient. The move was in response to the issues raised by American Soybean Association that US farmers are disadvantaged compared to farmers in Brazil and other countries which have a faster approval time (Crop Biotech Update, Citation2012). Regulatory framework for GM commercialization in the Philippines has been developed since 2002 and is considered the model in Asia. GM crop planting and food and feed approvals have been systematically granted following the set guideline (Halos and Soriano, Citation2014).
Number of events approved from 1992 to 2014
ISAAA's GM Approval Database records event approvals as reflected in the official regulatory body website. Event approvals follow the regulatory guideline of the country. USA and Canada only provide single event approvals but most countries consider the stacked traits as new events.
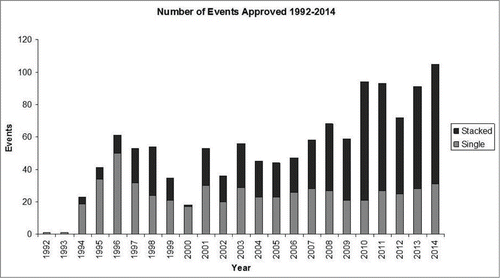
shows accumulated number of events approved for food, feed and cultivation. The number of approved events reached its peak in 2014 as 22 countries approved 105 events in 7 crops for food, feed and cultivation. Singapore approved GM events for the first time in 2014, granting approvals to 20 events in 6 crops while USA follows closely with 19 events in 4 crops. South Korea comes in third with 16 approved events for 2014. The year also marks the planting of Bt eggplant in Bangladesh, approved for planting in 2013; the approval of 10 new potato events, the InnateTM Potatoes, in the USA with reduced acrylamide (a carcinogen) production when exposed to high temperatures; and low lignin alfalfa approved for food and feed in 2014 with probable commercialization in 2015/2016. Vietnam also approved its first 6 GM maize events in 2014 (James, Citation2014).
Figure 3. Number of biotech crops and events approved from 1992–2014.
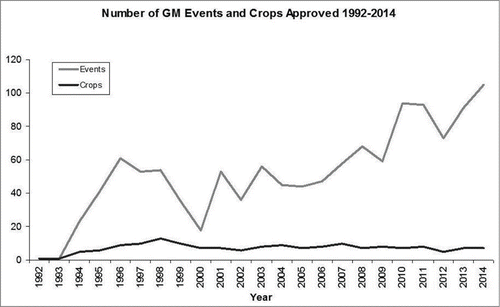
The highest number of crops given approval was recorded in 1998 at 12 crops: Argentine canola, cotton, flax, maize, Polish canola, poplar, potato, soybean, squash, sugar beet, sweet pepper and tomato (). Poplar, sweet pepper and sugar beet were granted approvals for the first time in 1998.
Crops with Event Approvals
There are only 26 genetically modified crops which are given approvals for food, feed and cultivation in the last 23 years; carnation, petunia and rose are not considered crops but were included in the database for record purposes. Maize has the highest number of events approved for food and feed as well as cultivation with 137, followed by cotton (54), potato (41) argentine canola (32) and soybean at 30 (). It may be recognized also that maize has the highest number of stacked trait events at 116. With the upcoming crops in the pipeline (Aldemita et al., Citation2014), maize will remain to be the crop with the highest number of events, followed by soybean as there are also numerous impending approvals (CropLife Resources, Citation2014). Maize is one of the main ingredients in food, feed meals and is currently being used as feedstock in biofuels (US Department of Energy, Citation2012). Although maize is only the second biotech crop after soybean in terms of adoption, maize has been improved the most through genetic engineering with various input, output and consumer traits. Biotech maize is planted in 30% of the 181.5 million hectares of maize grown globally (James, Citation2014).
Figure 4. Number of transgenic events per crop.
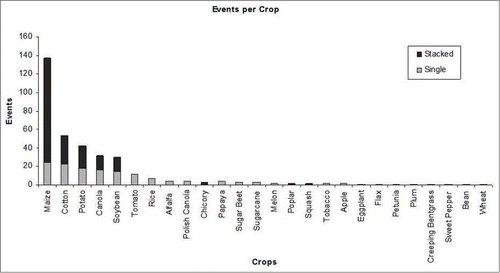
In the span of 23 years, most of the crops cultivated in large hectarages are for feed, fiber and for oil, such as soybean, cotton, maize, and canola. Small hectarages of biotech crops for direct consumption include white maize in South Africa, eggplant in Bangladesh, melon, bean, papaya, plum, potato, rice, squash, sugarbeet, and tomato in the US, Canada and China. USA approved 34 single events for food and feed with 2 canola, 5 cotton, 1 flax, 5 maize, 14 potato, 3 soybean, 2 sugar beet and 2 tomato. There are various research studies on biotech vegetables that include mustard and other solanaceous crops for important traits such as insect and pest resistance, herbicide tolerance and improved nutritional component (James, Citation2014).
Trait approvals
GM crops approved in the last 23 y were improved for 7 marketable traits: insect resistance, herbicide tolerance, modified product quality, pollination control, disease resistance, stress tolerance and altered growth yield. provides an over view of the crops and number of events approved for food, feed and cultivation that contain the specific trait as single, pyramided or stacked. Thus, one event which has both coleopteran and lepidopteran resistance genes is entered twice in the table. Herbicide tolerance trait is approved in 12 crops in a total of 336 events, followed by insect resistance trait in 8 crops and 276 events. Maize is the crop modified with the highest number of traits as mentioned above.
TABLE 4. Traits of GM crops approved in 23 years
There is more number of events approved for insect tolerance traits in the second decade at 213 compared to the first decade (). Lepidopteran resistance traits are in 163 events, approximately 60% of the total number of events with insect resistance trait. This may indicate the relative importance of the trait compared to other insect resistance traits in many crops including cotton, maize, rice, eggplant, and soybean. The GM trait in maize was also the first insect resistant trait developed and commercialized in the USA in 1995. It is also noteworthy that multiple insect resistance traits have been developed early on in poplar and cotton in the first decade and also in maize in the second decade. Gene stacking and pyramiding multiple insect resistant genes is one of the strategies in ensuring stability and durability of the trait (James, Citation2014).
Glyphosate herbicide tolerance trait was initially introduced to GM soybean and was approved for cultivation as early as 1993 in the USA and subsequently in 12 other countries. The gene is also deployed in canola, cotton, creeping bentgrass, maize, potato, alfalfa, sugarbeet and wheat in a total of 167 events or 50% of the total herbicide tolerance traits (). Glufosinate herbicide tolerance is deployed in Argentine canola and was approved for cultivation in the USA in 1995. Other crops that contain glufosinate tolerance trait include cotton, maize, Polish canola, soybean, and rice. In the first decade of commercialization, glyphosate tolerance and glufosinate tolerance were the most common traits deployed in crops, together with a few crops with some oxynil and sulfunyl herbicide tolerance traits. By the second decade, there was a 3-fold increase in the number of events with glyphosate and glufosinate tolerance traits, and new herbicide tolerance traits were approved such as sulfunyl tolerance and mesotrione tolerance in soybean, 2,4 D tolerance in cotton, maize, and soybean, and dicamba tolerance in cotton and soybean.
Since 1996 to 2014, herbicide tolerance has consistently been the dominant trait. In 2014, the global total hectarage of herbicide tolerant crops deployed in soybean, maize, canola, cotton, sugar beet and alfalfa occupied 102.6 million hectares of 57% of the 181.5 million hectares of biotech crops planted globally (James, Citation2014).
The long term use of glyphosate/glufosinate tolerance in GM crops, the non-judicious and continued use of chemical herbicides, and the lack of rotation of herbicide tolerant crops with different mechanism of action are some of the reasons why there are existing herbicide tolerant weeds. The development of new generation of herbicide tolerant crops with differing mechanism of action is one of the most important strategies to avert this problem. In addition, crop producers should understand and use a variety of weed control management tactics: biological, mechanical that would provide a competitive advantage for the crop (Vencill et al., Citation2012).
Crops were modified to improve product quality starting with the approval of delayed fruit softening tomato Flavr Savr in 1992. Since then numerous product quality traits were improved with phytase production in Argentine canola, modified oil in Argentine canola and soybean, modified lysine in maize, and nicotine reduction in tobacco in the first decade (). In the second decade, there was a 5-fold increase in the number of events for modified product quality, from 11 to 51. New traits include amylase content in maize and potato, altered lignin production in alfalfa, reduced acrylamide potential, black spot bruising tolerance and modified carbohydrates in potato, and anti-allergy for pollen in rice. Hence for the last 23 years, 11 different modified product quality were improved in 8 crops that include staple food crops: potato, maize and rice. The increase in the number of traits directed on food quality is a proof that second generation GM crops are indeed geared toward output traits that will benefit the health and well-being of consumers (Martino-Catt, Citation2008).
GM Crops modified for pollination control and fertility restoration were developed to hasten production of improved Argentine canola, maize and chicory (). Most of the transgenic events developed in these crops contain other commercial traits such as insect tolerance and herbicide tolerance.
Virus disease resistance in biotech crops have been developed in the first decade of commercialization, starting with zucchini yellow mosaic virus resistant squash, approved for cultivation in 1994 in the USA (). Although planted in small hectarages in the USA, the zucchini yellow mosaic virus resistant squash became a “proof of concept” strategy that other viral disease resistant crops can be developed through genetic modification. Hence, in the first decade, succeeding virus resistant traits include papaya ringspot virus resistant papaya, potato virus Y and potato leaf roll virus resistant potato, cucumber mosaic virus resistant squash, sweet pepper, and tomato, and watermelon mosaic virus resistant squash. In the second decade, 2 new traits were approved: bean golden mosaic virus resistance in bean and plum pox virus resistance in plum. Industry pipeline shows that there are early development of fungal resistance in maize, and nematode and fungal disease resistance in soybean (CropLife Resources, Citation2014).
The first of a series of abiotic stress tolerance traits was approved and commercialized for drought tolerant maize in 2010 in Canada and 2011 in the USA (USDA-ERS, Citation2012), subsequently, 12 other countries have approved the drought tolerant event for food and/or feed in succeeding years (). The US experienced the worst drought in history in 2012, where about 80% of agricultural land experienced drought extensively. This impacted 60% of cattle production, and about 70–75% of maize and soybean production. The approval for cultivation of the drought tolerant maize at this period was indeed timely.
Multi-trait maize events with drought tolerance, insect resistance, and herbicide tolerance traits have also been approved for food, feed and commercial release in the second decade. In 2014, around 275,000 hectares of drought tolerant maize with Mon 87469 have been planted in the USA (James, Citation2014). Three drought tolerant sugarcane events have been approved for food in Indonesia in 2011 and 2013 and environmental certificates for cultivation in 2013. However, commercial cultivation is delayed because of the pending feed safety approval in the country.
Soybean with enhanced photosynthetic activity was approved for food and cultivation in 2013 in the USA (). Mon87712 contains protein encoded by bbx gene from Arabidopsis thaliana that interacts with one or more endogenous transcription factors to regulate the plant's day/night physiological processes. This new soybean variety is expected to significantly increase yield as compared with other conventional soybean varieties (APHIS USDA, Citation2011).
Approvals of Single and Stacked Traits
As single gene transgenic events were commercialized at the beginning of the first decade, it is noteworthy that by 1996, the first peak in the number of events approved for food, feed and cultivation occurred at 50 single gene events and 11 stacked trait events for a total of 61 (). Approval for single gene events recorded includes: canola (plant quality traits and herbicide tolerance), cotton (HT and IR), maize (HT, IR and pollination control [PC]) with similar traits in papaya, potato, soybean, and tomato. The stacked trait events were for canola (HT+PC), maize (HT+IR) and squash (stacked for disease resistance). The number of single events steadily increased with its characteristic highs and lows with its highest peak in 2014 with the approval of 105 events, 31 single and 74 stacked events, from 7 crops. Maize still had the highest number of single and stacked trait events approved with 12 and 38, respectively.
Figure 5. Distribution of single and stacked events per year.
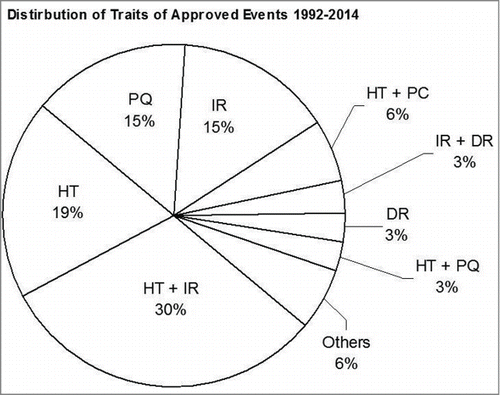
With this trend, it is not surprising that in 23 years, the stacked HT+IR comprise 30% of the total distribution of approved events (). This is followed by HT (19%), IR (15%) and PQ (15%). Farmers recognize the importance of gene stacking in terms of profit gain, reduced cost of production and agronomic trait efficiency. Thus, the fast increase in the number of improved stacked traits caters well to the increasing demand of major crops. Guanming et al. Citation(2013) analyzed grain yield data from annual field experiments conducted from 1990 to 2010 in Wisconsin to test the hypotheses that GE maize has greater productivity (as measured by the mean harvested yield) and lower production risk. Compared to conventional hybrids, the impact of GE traits (both single and stacked traits) on mean yield ranges from −12.2 to +6.5 bushels per acre (0.82 to 0.44 metric tons per hectare). It shows that reducing yield risk is an important source of benefits from GE technology, especially for the stacked traits. These risks benefits are estimated to be equivalent to a yield increase ranging from 0.8 to 4.2 bushels per acre (0.05 to 0.3 metric tons per hectare).
Figure 6. Trait distribution of approved events. Legend: HT, Herbicide Tolerance; IR, Insect Resistance; PQ, Plant Quality; DR, Disease Resistance; PC, Pollination Control; ST, Stress Tolerance; AGY, Altered Growth/Yield and Others: Altered Growth (0.27%), Stress Tolerance (1.08%), Pollination Control (0.81%), HT + ST (0.27%), IR + PQ (0.54%), HT + IR + ST (0.54%), HT + IR + DR (0.81%), HT + IR + PQ (1.6%).
Similarly, Brookes and Barfoot Citation(2015) indicated that the benefits gained from stacking genes can be immense, with provisional single trait benefits for 2014 in insect resistant (Bt) maize of $6 billion and herbicide tolerant maize of $1.7 billion; and $4.6 billion of insect resistant cotton and $123 billion for HT cotton.
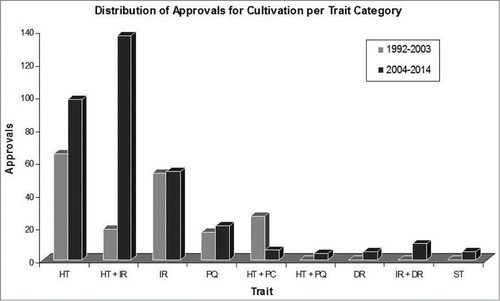
also shows the building up of single gene biotech crops in the first decade of commercialization with 66 approvals for herbicide tolerance and 54 approvals for insect resistance. Hence, by the end of 2003, there were several single trait products that have been approved and provided benefits to the farmers. These important traits were stacked in major crops and by the beginning of the second decade, there was already an abrupt increase of crops with stacked traits.
Figure 7. Distribution of approvals for cultivation per trait category.
The first stack product that gained regulatory approval in 1995 was a dual hybrid cotton stack produced by crossing BollgardTM cotton that expresses the Bt toxin cry1AB and Roundup ReadyTM cotton that produces the epsps enzyme conferring resistance to herbicide glyphosate. Following commercial success of this hybrid stack, developers sought to stack up more biotech traits into their crops portfolio to create multi-stack hybrids. The cotton triple stack which combines 2 Bt genes with the glyphosate resistance gene occupied more than 54% of the US cotton area in 2008. The eight-gene maize stock SmartStaxTM is the result of crossing 4 different biotech maize lines to combine 2 herbicide tolerance genes with 6 Bt genes. The event was launched in the USA and Canada in 2010. The resulting stack features dual modes of control for weeds, lepidopteran insects and coleopteran insects and allowed for the refuge requirement to be reduced from 20 to 5% in the US Maize belt (US EPA, Citation2011).
Stacked traits are favored by farmers in all countries for all crops. The trend for increased use of stacks is expected to continue as country markets mature and more products are offered to farmers. In 2014, stacked traits of insect resistance and herbicide tolerance are deployed in soybean, maize, canola, cotton, sugar beet, and alfalfa, occupying 102.6 million hectares or 57% of 181.5 million hectares of commercialized biotech crops (James, Citation2014). The deployment of stacked traits is most prevalent in the USA which had approximately 62% of the 51.4 million hectares as ‘stacked traits” in 2014. Thirteen other countries are planting stacked traits including Brazil (12.6 million hectares), Argentina (2.6), South Africa (1.2), Canada (1.1), Philippines (0.76), Paraguay (0.5), Uruguay (0.4), Australia and Mexico (with 0.2 each), and Colombia, Honduras, and Uruguay with 0.1 million hectares each). These countries derive significant benefits from deploying stacked products because productivity constraints at the farmer level are related to multiple biotic stresses and not only to a single biotic stress.
The increasing number of biotech traits in recent years has set the trend for the next generation of biotech crops. It is estimated that by 2015 for maize alone, 24 mono-trait events may have been commercialized. This potentially translates to over 2,000 triple-stacks and over 12,000 quadruple stacks that may enter the pipeline (Stein and Rodriguez-Cerezo, Citation2009). Future stacks are likely to involve not only multiple pest resistances but the combination of these traits with engineered metabolic pathways and simultaneous introductions of multiple pathways through metabolic engineering for improved nutritional and product quality.
Conclusion
The preceding analysis of GMO Approval Database of ISAAA reveals important trends that highlight significant milestones in GMO adoption and acceptance in a period of 23 y. Commercialization and planting approvals in the first 12 y (first decade, 1992–2003) showed that after the initial approval of 224 events in 16 countries, the number of countries increased by 13 and was close to double the number of approvals of 431 in the next 11 y of commercialization (second decade, 2004–2014). This may indicate understanding and acceptance by countries to enhance their regulatory capability to be able to benefit from GM crop commercialization. Similar trend was observed for food and feed approvals. From an initial 480 food approvals in 17 countries in the first decade, over 2-fold increase was realized in the next decade at 1025 food approvals, with the addition of 14 more countries, hence a total of 1505 approvals in 31 countries. Feed approvals in 28 countries also showed similar trend: more than a 2-fold increase from 309 approvals in 12 countries in the first decade and 725 approvals with the addition of 16 countries for a total of 725 feed approvals. Increase in approvals in the second decade may be attributed to government measures to expedite the approval process as exemplified by South Africa, Turkey, Argentina, Brazil and the USA.
It was also apparent that the number of approving developing countries for cultivation (22 countries or 79% of total approving countries), for food (22 countries or 70%) and feed (19 countries or 80%) indicate that developing countries have expressed their interest and acceptance of biotech crops. They have thus been benefiting from biotech crops for the last 23 y.
The year 2012 had the highest number of countries that approved GM crops as well as the highest number of cultivation approvals. On the other hand, 2011 had the highest number of countries with feed approvals and 2014 had the highest number of countries with food approvals, and the highest number of events approved.
The highest number of events approved for commercial traits in GM crops was obtained by herbicide tolerant crops at 336 events in 12 crops followed by insect resistant crops at 276 events in 8 crops. Trends in these traits show the generation of increased number of events approved and new generation of mechanism of action for insect resistance and herbicide tolerance. In addition, data on modified product quality provided an insight on the development of new generation GM crops that target the nutritional and product quality for the consumers.
Maize has the highest number of events approved (single and stacked traits), followed by cotton, potato, Argentine canola and soybean. Maize is used as biofuel, feed and food and hence was the first crop to have GM varieties with insect resistance and herbicide tolerance traits, and consequently, the first stacked traits. With the number of new traits for maize in the pipeline, maize will remain to be the number one crop in event approvals.
The number of stacked trait events has gradually increased through the years, which now occupies 30% of the total trait approvals. This does not include the US and Canada that grant approvals only to single events. The benefits that accrue to GM crops with stacked traits in terms of reduced cost of production, increased yield, and less demand on farmer's time have already been realized by farmers, hence, more demand for appropriate stacked traits in major crops are expected.
Finally, the trends in GM crop approvals in the last 23 y have provided information on the growth of the biotech crop industry with agronomic traits in food feed and fiber crops, and more recently on consumer-focused traits. Based on these observations, predicted next wave of biotech crops will be in food crops and with new output traits for the consumers, increased stacking of important genes with focus on traits that will mitigate the effects of climate change, and the continuous increase in the number of developing countries adopting biotech crops.
Disclosure of Potential Conflicts of Interest
No potential conflicts of interest were disclosed.
REFERENCES
- Aldemita RR, Solis RO, Hautea RA. Global Developments in Biotechnology Crops. Proceedings of the Asian Food and Agribusiness Conference. 2013. Biotechnology and Global Competitiveness, 15–18 July, 2014; Taipei, Republic of China. Kuala Lumpur, Malaysia: Editions Didier Millet; in press
- APHIS USDA. 2011. Petition for the determination of non-regulated status for MON 87712 Soybean. Available from http://www.aphis.usda.gov/brs/aphisdocs/11_20201p.pdf
- Argentina Agri-biotechnology Annual Report. 2011. USDA FAS GAIN. July 15, 2011. Available from http://en.biosafetyscanner.org/pdf/doc/668_allegato.pdf.
- Brookes G, Barfoot P. 2015. Global income and production impacts of using GM crop technology 1996–2013. GM Crops & Food: Biotechnology in Agriculture and the Food Chain 2015; 6:1, 13–46. Available from http://www.tandfonline.com/doi/full/10.1080/21645698.2015.1022310
- Crop Biotech Update, 2 March 2012. New soybean varieties introduced in Brazil. Available from http://www.isa22aa.org/kc/cropbiotechupdate/newsletter/default.asp?Date=3/2/2012#9226
- CropLife Resources. An in-depth look at the future of plant biotechnology development from CropLife International Member Companies. 2014. Available from https://croplife.org/wp-content/uploads/2014/06/Plant-Biotech-Pipeline-2014.pdf
- Guanming S, Chavas J-P, Lauer J. Commercialized transgenic traits, maize productivity and yield risk. Nature Biotechnology 2013; 31:111–114. Available from http://www.nature.com/nbt/journal/v31/n2/full/nbt.2496.html
- Halos SC, Soriano T. Ten years of genetically modified crop regulation in the Philippines. Philippine Journal of Crop Science 2014; 39(1):41–50. Avalable from http://www.cssp.org.ph/pjcs-issue/volume-39-no-1
- James C. Global review of the field testing and commercialization of transgenic plants, 1986 to 1995: The first decade of crop biotechnology. Ithaca, NY: ISAAA; 1996. Available from http://www.isaaa.org/resources/publications/briefs/01/download/isaaa-brief-01-1996.pdf
- James C. Global status of commercialized biotech crops for 2009. ISAAA Brief 41. Ithaca, NY: ISAAA; 2009. Available from http://www.isaaa.org/resources/publications/briefs/41/download/isaaa-brief-41-2009.pdf
- James C. Global status of commercialized biotech/GM crops for 2012. ISAAA Brief 44. Ithaca, NY: ISAAA; 2012. Available from http://www.isaaa.org/resources/publications/briefs/44/download/isaaa-brief-44-2012.pdf
- James C. Global status of commercialized biotech crops for 2014. ISAAA Brief 49. Ithaca, NY: ISAAA; 2014. Available from http://www.isaaa.org
- Japan Ministry of Finance. 2013. Japan Ministry of Finance (English). Available from http://www.customs.go.jp/toukei/info/index_e.html
- Lemaux PG. Genetically engineered plants and foods: A scientist's analysis of the issues (Part 1). Annu Rev Plant Biol 2008; 59:771–812; PMID:18284373; http://dx.doi.org/10.1146/annurev.arplant.58.032806.103840
- Martino-Catt S. Editor's Choice Series: The next generation of biotech crops. Plant Physiology 2008; 147(1): 3–5; PMID:18443100; http://dx.doi.org/10.1104/pp.104.900256
- Nicolia A, Manzo A, Veronesi F, Rosellini D. An overview of the last 10 years of genetically engineered crop safety research. Crit Rev Biotechnol 2014; 34(1):77–88; PMID:24041244; http://dx.doi.org/10.3109/07388551.2013.823595
- Paterson O. GM crops are safer than conventional crops, says Environment Secretary Owen Paterson. The Independent. March 3, 2015. Available from http://www.independent.co.uk/life-style/food-and-drink/news/gm-crops-are-safer-than-conventional-crops-says-environment-secretary-owen-paterson-8665872.html
- Philippines Agbiotechnology Annual, 2014. Available from http://gain.fas.usda.gov/Recent%20GAIN%20Publications/Agricultural%20Biotechnology%20Annual_Manila_Philippines_9-16-2014.pdf
- South Korea, Agri-biotechnology Annual Report, 2011. USDA FAS GAIN. September 23, 2011. Available fromhttp://gain.fas.usda.gov/Recent%20GAIN%20Publications/Agricultural%20Biotechnology%20Annual_Seoul_Korea%20-%20Republic%20of_9-23-2011.pdf
- Stein AJ, Rodriguez-Cerezo E. The global pipeline of new GM crops: Implications of asynchronous approval for international trade. European Commission Joint Research Centre. 2009. Available from http://ipts.jrc.ec.europa.eu/publications/pub.cfm?id=2420
- Stein AJ, Rodriguez-Cerezo E. International trade and the global pipeline of new GM crops. Nat Biotechnol 2010; 28:23–25; PMID:20062032; http://dx.doi.org/10.1038/nbt0110-23b
- Turkey, Agricultural Biotechnology Annual. 2012. Available from http://gain.fas.usda.gov/Recent%20GAIN%20Publications/Agricultural%20Biotechnology%20Annual_Ankara_Turkey_7-13-2012.pdf
- US Department of Agriculture, 2013. Available from http://usda.mannlib.maizeell.edu/MannUsda/viewDocumentInfo.do?documentID=1000
- US Department of Energy. Biofuels issues and trends. 2012. Available from http://www.eia.gov/biofuels/issuestrends/pdf/bit.pdf
- USDA-ERS. US drought 2012: Farm and food impacts. 2012. Available from htp://www.ers.usda.gov/topics/in-the-news/us-drought-2012-farm-and-food-impacts.aspx
- US EPA. Pestide fact sheet. 2011. Available from http://www.epa.gov/pesticides/biopesticides/pips/smartstax-factsheet.pdf
- Vencill WK, Nichols RL, Webster TM, Soteres JK, Mallory-Smith C, Burgos NR, Johnson WG, McClelland MR. Herbicide Resistance: Toward an understanding of resistance development and the impact of herbicide-resistant crops. Weed Science Special Issue: 2–30. 2012. Available from http://www.wssajournals.org/doi/pdf/10.1614/WS-D-11-00206.1