
 ?Mathematical formulae have been encoded as MathML and are displayed in this HTML version using MathJax in order to improve their display. Uncheck the box to turn MathJax off. This feature requires Javascript. Click on a formula to zoom.
ABSTRACT
The Brazilian Sucro-energy Sector produces both energy, in the form of ethanol fuel, industrial steam and electricity, and sugar. Centro de Tecnologia Canavieira (CTC), the leading Brazilian sugarcane breeding company, has developed a pipeline of insect-protected sugarcane varieties to control sugarcane borer damage. The goal of this manuscript is to present the results of studies with three genetically modified (GM) sugarcane varieties and to evaluate the published literature regarding the possible presence of GM sugarcane DNA or protein in raw or refined sugar. Specifically, two varieties of approved GM sugarcane, CTC91087-6 and CTC175-A, and an experimental CTC variety, were grown in four individual plots to produce four batches each of processed raw sugar using standard smaller-scale laboratory processing methods resulting in a total of 12 independent batches of raw sugar. Herein, we report the development of event-specific probes and DNA detection methods, designed to detect the junction of sugarcane genomic DNA and the inserted DNA of the two approved GM varieties. An identical approach was used for the testing of sugar made from the experimental CTC variety. The methodology used TaqMan® real-time PCR and ELISA assays validated for the four GM proteins expressed by these three events (Cry1Ab, Cry1Ac, NPTII, and PAT (bar)). The developed assays had very low limits of detection (LODs) for the various event-specific DNA probes (7.2–25 ng/g sugar) and insecticidal and selectable marker proteins (2.9–10.9 ng/g sugar). No event-specific DNA and no GM proteins were detectable in the 12 independent batches of raw sugar produced from these three GM sugarcane events. The results of this study, using very sensitive methods and testing several sugar batches, extend the conclusions of previous studies, reviewed herein, that showed the extensive degradation and removal of DNA and protein during sugarcane processing. Overall, these results indicate that there are no distinguishable differences between the highly purified, chemically defined sugar produced from conventional or GM varieties.
Introduction
The Brazilian sugarcane agro-industry, also described as the Sucro-energy Sector, is a global leader in the use of sugarcane to produce sugar, renewable domestic energy from ethanol for fuel, and from the burning of bagasse to produce industrial steam and electricity. Given the perennial nature of sugarcane production and both the relatively low agronomic inputs and complete domestic re-use of by-products such as bagasse, filter cake and vinasse (), the Sector is an exemplary case of circular energy, producing ethanol fuel with GHG emissions approximately 85% below that of crude oil. Citation1 As such, this Sector is extremely important for both renewable energy production well into the future Citation2 and for Brazil to meet its’ commitment to the Paris Climate Accord (Brazilian Federation, Paris Agreement INDC, 2015). Brazil is the world’s largest exporter of sugar, with exports in 2018 of approximately 780.5 million tons (OECD Database, 2019).
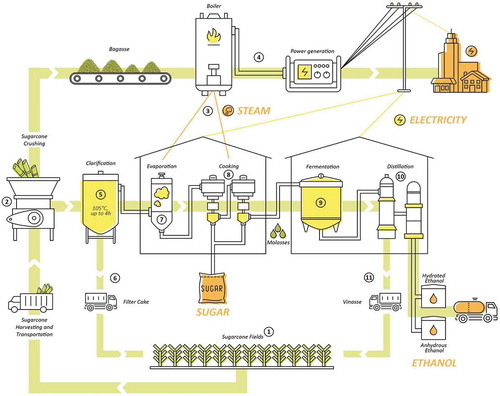
Figure 1. Representation of the processing of sugarcane by the Brazilian Sucro-Energy Sector. 1: Sugarcane fields are located near the mills to allow harvesting and immediate processing to avoid sucrose inversion that starts immediately after stalk cutting. 2: Sugarcane juice is extracted by pressing stalks using either a tandem roller mill or diffuser mill. The tandem mills require that chopped stalks are first shredded, submerged in water and then crushed between sets of rollers to dispense the primary juice. Conversely, in the less common diffuser mill procedures, primary juice is lixiviated by the application of approximately 80°C imbibition water. Both processes produce sugarcane juice and bagasse. 3: Bagasse is burned in the boiler to produce steam. This source of energy is used to either supply thermal demands of sugar/ethanol processing or, 4: to produce surplus electrical energy that is sold to the electrical public grid, to supply energy demand of houses, industries and even electrical cars. 5: The primary juice is heated for 3 h at 105°C with lime (calcium hydroxide) and/or a flocculent to precipitate sugarcane macromolecules (fiber, protein, DNA, etc.). 6: The result is a heavy precipitate of these macromolecules called “mud,” which is then separated and filtered, to produce “filter cake.” This filter cake is usually returned to sugarcane fields as fertilizer. 7: The clarified juice (14–20° Brix), is concentrated by vacuum evaporation, at an initial temperature of approximately 110°C which is then, with simultaneous increase of vacuum, decreased to 85–90°C. When syrup of around 65°Brix is produced, this evaporation process in concluded. 8: At 70°C this syrup is concentrated in an evaporative vacuum crystallizer. After crystallization, the “cooked material” is centrifuged to separate sucrose crystals from the “honey.” These crystals are centrifuged and then dried to produce raw sugar. This step can be repeated several times until no more sucrose crystallizes, producing a residual rich in sugar with an increasing level of difficulty for sucrose crystallization (Molasses A, B, and C). In Brazilian mills, molasses is sent to fermentation to produce ethanol. 9: Fermentation to produce ethanol uses any kind of molasse grades, sugarcane juice or a mixture of them called “must.” The kind of molasses and the ratio among these products vary according to the mill plan to produce more sugar or ethanol. Fermentation is performed by the yeast Saccharomyces cerevisidae, during 4 to 10 hours at 32°C, resulting in the “wine.” 10: Wine is fed into a distillation column to separate ethanol from wine (initially at 7–10° GL) as vapor (phlegma at 40–50° GL). The phlegma from the depuration column feeds into a second column, called the rectification column, to remove impurities and to concentrate to 96° GL. This product is called “hydrated ethanol” and can be used direct to fuel flex cars. Alternatively, hydrated ethanol can be further dehydrated to produce anhydrous ethanol. This ethanol is mixed to Brazilian gasoline in the proportion of 27.5%. 11: The residual of distillation is called vinasse and contains most of the salts and suspensions of solids. Vinasse should not exceed the limit of 0.03° GL of alcohol in its composition. Vinasses is generally returned to sugarcane fields as fertilizer.
Researchers at Centro de Tecnologia Canavieira (CTC) have developed insect-resistant sugarcane varieties to protect against lepidopteran-pest sugarcane borers that cause up to 1.3 billion US dollars in annual damage. Citation3,Citation4 These varieties express either the Cry1Ab or Cry1Ac proteins, familiar insecticidal proteins that have a long history of safe use in microbial spray products in organic agriculture for over 50–60 years and in biotechnology-derived crops for over 20 years. Citation5,Citation6
Given the importance of Brazilian sugar exports, new studies aimed to detect GM DNA or protein in raw sugar using even more sensitive methods were conducted to expand on previous studies. Citation7,Citation8 The studies were done on 12 independent batches of sugar produced from three GM sugarcane varieties, two of which have already been approved by CTNBio, the national authority in Brazil responsible for the review and approval of biotechnology products.
The production of sugar and ethanol, using current Brazilian Sucro-energy Sector processing methods, involves the treatment of sugarcane primary juice with prolonged heating to 105°C and pH adjustments (lime) (), conditions known to denature, precipitate and eliminate virtually all plant DNA and proteins. Citation7–Citation9 Raw sugar is typically required to be refined prior to use as a human food ingredient. Raw sugar is typically 97–99+% sucrose whereas refined sugar is about 99.93% sucrose. Citation10 The only remaining impurities in refined sugar are water, inverted, or reducing sugars (glucose and fructose), ash, colored components, and other organic non-sugar compounds. Citation10
Previous studies have examined the effects of sugarcane processing to sugar on both the concentrations of endogenous and GM DNA and protein. Studies by,Citation9established that no plant 25 S and 18 S ribosomal RNA genes or protein were detectable in refined sugar. Likewise,,Citation7found that processing of sugarcane to raw sugar produced a loss of detectable plant Rubisco DNA and protein. These and other these studies have consistently shown the complete loss of detectable high-copy number endogenous DNA and abundant proteins as a result of sugarcane processing and sugar refining.
In this paper we: 1) describe several validated and very sensitive methods for the detection of relevant event-specific DNA and newly-expressed proteins in raw sugar, 2) present the results of experiments, using these sensitive methods, attempting to detect the presence of GM DNA or protein in 12 batches of raw sugar produced from two approved varieties and one experimental CTC variety, 3) place these results in the context of both the previous literature regarding the destruction and loss of DNA and proteins during processing and the thermostability data for the specific insecticidal and selectable marker proteins expressed in these three GM sugarcane varieties, and 4) we describe the practical implications of no detectable DNA and protein on the safety assessment of raw and refined sugar.
These studies described herein used sensitive Real-Time PCR and ELISA tests to evaluate the possible presence of event-specific DNA and newly-expressed proteins in raw sugar. In total, 12 independently grown plots and the 12 corresponding lots of processed sugar samples were studied from the three GM sugarcane varieties (4 batches/variety). Validated ELISA methods were used to determine the possible presence of the GM sugarcane proteins, Cry1Ab, Cry1Ac, NPTII, and PAT (bar) in the various test and commercial sugar samples. The Limits of Detection (LODs) of these protein detection assays were in the 2.9–10.9 ng protein/g sugar range representing the lowest LOD methods studied to date.
Materials and Methods
Control and Test Sugarcane Varieties
The three GM sugarcane varieties tested in this study were transformed to express one of two Cry1A proteins that are active against the lepidopteran sugarcane borer. The event CTC175-A variety expresses the Cry1Ab and NPTII proteins, event CTC91087-6 sugarcane expresses the Cry1Ac and PAT (bar) proteins and the experimental CTC variety expresses Cry1Ac and NPTII. The CTC175-A and CTC91087-6 varieties have been approved by CTNBio in Brazil for commercial planting.
Production and Harvest of Test and Control Sugarcane
Stalks of events CTC175-A, CTC91087-6, the experimental GM CTC variety, and three commercial non-GM sugarcane varieties, were sampled from plots in regulated CTC field sites in Piracicaba, São Paulo state. The stalks used for sugar production were cultivated in four replicate blocks of the experimental sites. Within those blocks, the plants were distributed into 4–10 rows of 5–12 m spaced by 1.5 m. The plant material from each plot was kept separated so that individual with lots of sugar were produced from the individual plots of sugarcane. Sampling details in each variety of field trial are presented in .
Table 1. Harvest days after planting and sampling of control and insect-protected GM sugarcane plots for sugar production.
The sugarcane stalks of the three GM and three commercial varieties were harvested in the typical harvesting period, approximately 330–380 days after planting. The raw sugar was produced in small lots from stalks using standard industrial processing procedures that mimic the process used in Brazil (). After harvesting sugarcane stalks, the tips and the straw of the sugarcane were cut. The harvested sugarcane was transferred to on-site laboratories where the stalks were submitted to juice extraction in a sugarcane mill (M-730-RI, Maqtron-BR) until about 30 to 40 L of juice was obtained. After the juice extraction, larger particles of bagasse were removed by sieving in a 40 mesh-Aperture (0,42 mm) sieve (stainless steel round sieve (Bronzinox-BR). The brix was measured using a refractometer (RX-5000α, Atago – JP) and the juice was heated in a flash tank (AV-50 Plus Phoenix, Luferco-BR) until it reached the temperature of 70 ± 1°C, under constant agitation. Once the temperature was reached, a lime milk solution was added to neutralize the juice until it reached pH 7 ± 0.02. After neutralization, the juice was heated again until the final temperature of 98°C to 100°C (boiling temperature). The boiling temperature was maintained for 2 minutes to eliminate the air in the juice. Then, 2 mg.L−1 of the polymer was added to proceed with clarification. The clarified juice (supernatant) was separated from the sludge and transferred by vacuum suction into the rotary evaporator (MA-175, Marconi-BR), where it was subjected to the concentration stage. The clarified juice was concentrated between 60° and 65° Brix. The crystallization process was conducted in a crystallizer (NA, Marconi-BR) with an internal volume of 8 l, equipped with a naval propeller-type agitator. The crystallizer was coupled with a vacuum system and an electric coil, for a higher concentration of syrup. A temperature controller (N1040-Novus-BR) was added.
One cycle of the process follows the next steps: 1) loading of syrup in the crystallizer; 2) concentration of the solution for the sowing of crystals in the fed batch (82° to 86° Brix); 3) final concentration of about 90° Brix; and 4) final unloading of mass for centrifugation (NA, SUEG-BR).
The monitoring of the Brix for the syrup concentration was performed by means of the mass balance of the syrup fed versus removed condensate. The crystallizer was fed with 3 to 4 kg of syrup to produce about 1 kg of sugar. Various commercial sugars samples (Native Organic® – Demerara Sugar, Yoki® – Brown Sugar, and Native Organic® – Crystal sugar) were purchased and used to compare the quality with the smaller laboratory scale batches.
Per recommendations from Codex, moisture, polarization, reducing sugars, conductivity ash, ICUMSA color, starch, phenolic compounds, dextran were assessed in a compositional study of the sugar produced from transgenic varieties CTC91087-6, CTC175-A, and the CTC experimental variety. Polarization, a common proxy assessment for purity, was determined via polarimetry, with a normal sugar solution (26 g/100 mL) clarified by the addition of basic lead subacetate and filtered through qualitative filter paper as described in ICUMSA methods book [Method GS1/2/39-1. Citation11 ] The solution was read using a polarimeter, which measures the algebraic sum of optically active components at 587 nm. The polarization result is expressed in °Z and theoretically equates to purity expression in % sucrose. Using this method, the 12 individual batches of raw sugar produced from the three GM varieties were assessed to be 98.6–99.7% sucrose purity and the other tests established that the sugar conformed with international standards for raw sugar.
All sugar production and sugar analysis were performed in laboratories certified with CQB (Certificado de Qualidade em Biossegurança – Biosafety Quality Certification) granted by CTNBio according to Normative Resolution No. 01.
DNA Extraction and Quantification
The description of the event-specific methods for the two approved CTC varieties, CTC175-A, and CTC91087-6 include detailed information on the DNA probes used in the analytical methods. The same methods as described below, however, using the appropriate event-specific probes, were also used for the experimental CTC GM variety. The limits of detection and sample testing results for both the event-specific DNA and ELISA methods assay for both commercial varieties and the experimental CTC variety are provided.
For the detection of event-specific DNA, sugar samples were subjected to the genomic DNA extraction procedure using a commercial kit: NucleoSpin® Plant II in tubes, following the recommendations of the manufacturer MACHEREY-NAGEL GmbH & Co. KG (Germany). In short, 250 (±0.5 mg) of sugar were weighed, placed in a 2.0 mL Eppendorf tube and 400 μL of Lysis Buffer (PL1) and RNase was added. Samples were mixed in a vortex until the complete dissolution of the sugar. This sugar solution was incubated in a water bath at 65°C for 10 minutes. Then, the solution was filtered in the appropriate columns by centrifugation at 11000 x g for 2 minutes. Following filtration, 450 μL of the PC Binding Buffer was added to the filtered solution. This solution was passed through the affinity columns by centrifugation at 11,000 x g for 1 min, in which the DNA was retained. The columns containing the DNA were washed with the Washing Caps (PW1 and PW2), once with 400 μL of PW1 and twice with 700 μL and 200 μL of PW2, respectively. All washings were made in a centrifuge at 11,000 x g for 1 minute. Then, the DNA was eluted from the column in an Elution Buffer (PE) using 50 μL of PE elution buffer heated at 65°C added to the column. After 5 minutes, to ensure total solubilization of DNA, the solution was centrifuged at 11,000 x g by 1 min. This step was repeated once again, totaling 100 μL of the final extract. The DNAs eluted from samples were quantified with a fluorometer using the Qubit® dsDNA BR Assay Kit 2–1000 ng (Invitrogen, US) following the manufacturer’s recommendations.
Event-Specific DNA Analysis
The presence of the GM DNA in sugar was assessed by using a TaqMan® real-time PCR assay with specifically designed initiators (primers) to probe for a unique DNA sequence that occurs at the junction of the endogenous plant DNA and the inserted DNA, thereby permitting detection of each of the three specific genetically modified sugarcane events. Dilution curves of positive controls for event-specific DNA segment were obtained after diluting the positive control extracted DNA in sterile water.
Primers and Probes Used for the CTC 91087-6 and CTC175-A Event-Specific Assay
The following real-time PCR analyses, designed using the specific methodology outlined in the TaqMan® Technology, included specific primers and probes for each event. In the case of specific event CTC91087-6, the detection procedure was established using one primer anchored in the inserted T-DNA spacer sequence between the NOS terminator (PAT/bar cassette) and right border of the construct, and the second primer anchored in the 3ʹ sugarcane genomic flanking DNA sequence. The probe that comprised the detection triad was designed in the genome. The following primers and probes were used: Forward primer, 5ʹ – CGTTTCCCGCCTTCAGTTTA – 3ʹ; Reverse primer, 5ʹ – GCCGTTATGTTGGAAGTAGG – 3ʹ; and probe, FAM – 5ʹ – CGTGTTCCTATCGCCAGC – 3ʹ – MGB. shows the DNA insertion used as template and primers and probe position
Figure 2. Diagram of the right side of T-DNA inserted into CTC91087-6 genome, including the region used for event-specific detection. Pat/Bar refers to PAT (bar) gene. Grey color indicates the spacer sequence between NOS terminator at the right border of T-DNA and CTC91087-6 genome. Light green represents the genomic DNA. The purple names above figure indicate the relative position of the primers and the probe (blue circle) used in the event-specific detection assay.

For detecting specific event CTC175A, one primer was anchored at the end of NOS terminator (NPTII cassette) on T-DNA and the other in the flanking genomic region of insertion #5, contiguous to the T-NOS. The following primers and probes were used: Forward primer, 5ˈ-CATCTATGTTACTAGATCGGCGC-3ʹ; Reverse primer, 5ˈ-GCACTGGCATAAATAAGCCTGTAG-3ʹ; and probe FAM-5ʹ – ATCGAGCTCCCCCAAC-3ʹ – MGB. shows the DNA insertion used as a template and primers and probe position.
Figure 3. Schematic view of the amplified region of insertion #5 of event CTC175A. Grey color indicates the spacer sequence between NOS terminator at the right border of T-DNA and CTC175-A genome. Light green represents the genomic DNA. The purple names above figure indicate the relative position of the primers and the probe (blue circle) used in the event-specific detection assay.

The event-specific detection method for the experimental CTC GM variety was developed using the same approach of the two approved CTC varieties described above. Precisely, a pair of specific initiators (primers) was designed so one primer was anchored in the T-DNA and a second initiator was anchored at the sugarcane genome. For the use of the TaqMan® technology a probe was drawn at the junction between the spacer sequence and the genome.
To confirm the presence and quality of the DNA samples tested, an endogenous reaction control of the polyubiquitin gene of sugarcane was used. In the case of event CTC91087-6 the primers were 5ʹ- TCGCCCGCCGTAATAAATAG – 3ʹand 5ʹ- ATCTGGTTGTGTGTGTGTGCG – 3ʹ; and the probe was VIC-5ʹ- CTCCACACCCTCTTT- 3ʹ-MGB in multiplex. The polyubiquitin assays developed for events CTC175A and experimental CTC GM variety used the primers 5´ACCATTACCCTGGAGGTTGAGA 3´ and 5´GTCCTGGATCTTCGCCTTCA 3´ and probe VIC 5 ‘ CTCTGACACCATCGAC 3 ‘ MGB. The qPCR reactions conditions are presented in . Real – time Taqman PCR reactions were performed using the 7500 Fast Real-Time PCR system (Applied Biosystems, USA).
Table 2. Conditions for the real-time taqman PCR Reactions.
Cycling performed: a cycle of 2 minutes at 50°C for the activation of uracil-N-glycosylase, a cycle of 20 seconds at 95°C for the activation of DNA polymerase, 40 cycles of 3 seconds at 95°C (denaturation) and 30 seconds at 60°C (annealing and extension) in the case of event CTC91087-6 and 60 seconds at 61°C for event CTC175-A. The Cycle threshold (Ct) values are obtained as a real-time amplification measure, where the fluorescence found in the linear portion of the amplification curve corresponds to the number of cycles completed during the assay. These same procedures were used for the detection of event-specific DNA for the experimental CTC variety.
Validation of Quantitative Parameters
A sample of sugar produced from the comparator non-GM varieties (CTC20, CTC9001, and conventional CTC experimental comparator) were spiked with known quantities of genomic DNA. The spiked sugar was submitted to the DNA extraction and quantification methods. The quantified DNA was diluted with water in several different quantities (ng) used to produce the standards curves. Each point of the curves generated Cycle Threshold (Ct) values associated with each of the dilutions, enabling the construction of standard curves. Linear equations were obtained from these curves. With these equations it is possible to estimate the DNA mass in ng, corresponding to the Ct of any sample being compared:
Where:
m is the angular coefficient.
b is the linear coefficient.
Limit of Detection (LOD): LOD was calculated with the Ct values of the event-specific concentrations mentioned in above in triplicates. The dilution of lower value, compliant with the following criteria, was determined as the LOD of the specific event-specific assay: 1) to be greater than the limit of blank (LOB); 2) the standard deviation between the replicates should not be greater than 1 Ct; and 3) the number of replicates with detectable values should be greater than 95% of the total replicates.
Table 3. Real-time PCR taqman analysis for event-specific DNA (ng/g sugar) in 12 sugar batches.
Limit of Blank (LOB): LOB was calculated using the 95 percentile of the detectable Cts values of up to 5 control samples that do not contain the target DNA. With the Ct value obtained from this percentile using the linear equation (Y = mx+c), mass (in ng), corresponding to this Ct, was estimated. In this assay, the sugar obtained from wild plants (WT) were considered as control samples.
Limit of Quantification (LOQ): LOQ was calculated using the average of Cts in the dilution determined in the LOD (CtLOD) as well as the standard deviation of its replicates. The Ct are calculated for the LOQ, using the following formula:
Where , is the standard deviation of CtLOD for this assay. This CtLOQ is then used in the linear equation to estimate the mass, in ng, of DNA present in the tested sample.
The LOB, LOD, and LOQ values were initially obtained as mass unit (ng) of the target (specific event) DNA present in the PCR reaction. However, for a better understanding and discussion of the results obtained, conversions were made to ng DNA/mg of sugar. The mass values (ng) for each parameter were converted to ng of DNA/mg of sugar using the following equation:
Protein Detection Methods
For the detection of the Bt proteins (Cry1Ac or Cry1Ab) and selectable marker proteins (NPTII or PAT(bar)) batches of sugar produced at four experimental plots planted with the specific events and four batches of sugar obtained from plots planted with CTC cultivars (control samples) in Piracicaba/SP, were tested.
For protein quantification (Bt and selectable markers proteins), 60 mg of sugar was used in 375 μL of extraction buffer. In the case of Cry1A and PAT (bar) proteins was added the saline phosphate extraction buffer (PBS) supplemented with Tween 20 (NaCl 0.138 M; KCl 0.027 mM; Tween 20 0.05%, pH 7.4) diluted according to the manufacturer’s instructions (Envirologix™, USA). For NPTII proteins extraction, we used the extraction buffer PEB1 1x (PH 7.0), which comes with the kit used for the quantification of the NPTII protein [Pathoscreen® Kit for NPTII (Agdia)].
After adding the buffer, samples were dissolved using a vortex mixer and centrifuged for 20 minutes at maximum speed. The resultant supernatant was collected and concentrated in Amicon Ultra-0.5 3 k device columns according to the manufacturer’s guidelines (MERK KGaA, Germany). About 300 μL of total protein exudate was added to the column and centrifuged for approximately 40 min at maximum speed until the volume was reduced to about 50 μL.
The quantification of total proteins was done by the Bradford or BCA method according to the manufacturer’s recommendations. The quantification of total protein by the Bradford method was performed according to the recommendations of the ThermoScientific™ Coomassie Plus (Bradford) Protein Assay Kit (23236) – Microplate procedure. The albumin standards kit (BSA) (2 mg/mL) supplied with the kit were used as calibrators. The calibrators used were 250; 125; 50; 25; 5; 2,5 μg/mL, prepared in PBST. The quantification of total proteins by the BCA method was performed according to the recommendations of the Pierce™ BCA Protein Assay Kit (23225) – Microplate procedure kit. The albumin standard (BSA) [2 mg/mL] supplied together with the kit above was used as a calibrator. The standard was diluted in PEB buffer to obtain the following concentrations: 25; 125; 250; 500; 750; 1000; 1500; 2000 μg/mL. In all cases the reading was performed using the Softmax Pro 7.0 software (Molecular Device, USA). Total protein was obtained in triplicate for each batch of sugar analyzed.
Total protein normalization aimed at a final concentration of 1 μg/mL of total proteins for Cry assays and 30 or 150 μg/mL for the selectable marker assays, PAT or NPTII assays, for each sample, respectively.
Results were obtained by spectrometry in 96-well plates with readings at two different wavelengths: 450 nm and 630 nm for Cry1A samples and 450 nm for selectable markers, in a SpectraMax Plate Reader (Molecular Devices, USA). Corresponding commercial kits mentioned above were used during the procedure. In all cases the manufacturer’s recommendations were followed.
Since sugar is a highly-pure substance, the presence of significant amounts of protein in sugar samples is not expected. Two separate standard curves were prepared using sugar samples produced from the conventional variety (non-genetically modified); the individual target proteins were either added before or after the respective sample protein extraction during sample preparation.
The enrichment (spike) before the total protein extraction confirmed the recovery of the analyte with the extraction method described herein. The curve created with the addition of the analyte after the extraction of total proteins, clarified the effect of the matrix (selectivity) in the generated results. With the results generated by the curves, it was possible to estimate the linear equations, with which the concentrations of protein in ng/mL are calculated, the unit in which the results were presented.
Where:
y: concentration (ng/mL)
x: OD value obtained in the assay
m: angular coefficient
c: linear coefficient
Validation of Quantitative Parameters
With said linear equation, it was possible to estimate the following quantitative parameters:
Theoretical Limit of Detection (LOD)
The theoretical limit of detection (LOD) was calculated using the average OD values obtained from 12 conventional plant samples. To this estimated value, 3x the standard deviation value was added. After obtaining the hypothetical OD value, the concentration was calculated using the standard curve equation.
Limit of Quantification (LOQ)
The different concentrations used to obtain the calibration curve were subjected to statistical analyses, such as standard deviation (SD) and coefficient of variation (CV), using formulas in Excel (Microsoft). The relative error (RE) was also calculated according to the following formula:
With the values obtained from each of these parameters, we concluded that the LOQ is the one that meet the following criteria: 1) to be greater than the LOD; 2) SD less than 1; 3) CV below 2, and 4) RE below 10%.
Recovery
To verify the extraction efficiency of the extraction methods used for each analyte: Cry1Ac/Ab and PAT and NPTII, the recovery test was performed. The recovery test is based on the “contamination” or enrichment (spike) of the sugar samples of conventional variety (not transformed) with known concentrations of the analyte to be investigated. Then, the extraction of total proteins from the sugar samples is made and the ELISA quantification method is applied. So, it is possible to obtain the final concentrations (recovered) for each of the expected concentrations. The recovery percentage (RP) was calculated using the following formula:
Results
Event-Specific Real-Time PCR by TaqMan® DNA Analysis of Sugar Batches
Results showed that there was no detectable event-specific DNA in any of the 12 independently produced raw sugar batches from events CTC91087-6, CTC175-A, or the experimental CTC GM variety using methods with very low limits of detection (). Each assay performed as expected following the addition of the positive control DNA (obtained from leaf tissue from the respective GM variety) to create standard curves both in the buffer and in sugar samples spiked with the positive control DNA. The LOD values for these event-specific DNA methods were quite low, ranging from 7.2 to 25 ng DNA per gram of sugar. Therefore, the lack of detection in all 12 independent batches of raw sugar produced from the three sugarcane events establishes that the processing conditions required to produce the raw sugar resulted in the loss of GM DNA.
Because several widely grown GM crops such as soybean also contain the Cry1Ab, Cry1Ac, NPTII, and PAT (bar) genes, it is possible that transportation vessels containing raw sugar may contain trace quantities of crop residues, producing a false positive of these genes in raw sugar. Therefore, any detection of these common insecticidal and selectable marker genes in raw sugar should be considered a false-positive pending confirmation using event-specific methods.
Analysis of four sugar batches produced from the four plots for each of the appropriate non-transgenic comparator varieties also confirmed that event-specific DNA levels were below the LODs indicated. Similarly, there was no event-specific DNA detected in commercially obtained Cristal, Demerara, or Brown sugar samples.
Endogenous Polyubiquitin Real-Time PCR Analysis of 12 Sugar Batches
In the same samples, it was possible also to evaluate the possible effects of processing on the presence of the high-copy endogenous polyubiquitin gene. The polyubiquitin gene is present in the genome of plants in several insertions, with multiple units. For example, more than four loci were reported, with more than 3 units of polyubiquitin each, in the barley genome. Citation12 Furthermore, the polyubiquitin gene family has 14 members in Arabidopsis thaliana. Citation9 The exact number or range of the number of polyubiquitin genes in sugarcane has not been reported. But, considering the high polyploidy of commercial sugarcane hybrids, it is probable that the polyubiquitin gene is present as a high copy number gene in sugarcane.
Even when probed for the endogenous polyubiquitin gene, present in sugarcane DNA at several times the copy number of Bt and selectable marker genes, polyubiquitin gene detection was below the LOD of the assays in raw sugar (). These results included the 12 sugar batches produced from the three GM varieties and in three different types of commercially obtained sugar.
Table 4. Real-Time PCR TaqMan analysis for endogenous polyubiquitin DNA (ng/g sugar) in 12 sugar batches.
ELISA Analysis for GM Proteins in 12 Sugar Batches
ELISA methods were validated in order to obtain the lowest possible LOD values in raw sugar. Studies on the recovery of the four different proteins: Cry1Ab, Cry1Ac, NPTII, and PAT (bar) when spiked into sugar solutions showed recoveries in the range of 89–120%. Studies with the standard curves produced in either buffer or buffer containing sugar showed no matrix effect as the result of the presence of the sugar (data not shown). Given the optimization of the ELISA assays from the raw sugar, a highly purified sample matrix, the LOD values obtained were quite low, in 2.9–10.9 ng/g sugar range (). As a result, the method used to detect the possible presence of GM protein in sugar produced from GM sugarcane was considered adequate for the purpose of this study. There was no detection of any of the appropriate Cry1Ab or Cry1Ac or the NPTII or PAT (bar) proteins, results that were consistent across the 12 distinct batches harvested and processed ().
Table 5. ELISA analysis of gm proteins (ng/g sugar) in 12 sugar batches.
There were no detectable levels of Cry1Ac, Cry1Ab, NPTII, or PAT (bar) proteins in the 12 sugar batches produced from the three non-transgenic comparator varieties or in any of the three commercially obtained Cristal, Demerara, or Brown sugar samples.
Discussion
The research presented in this study adds to previous studies.[Citation7-Citation9,Citation13,Citation14,Citation15] by using very sensitive methods for the possible detection of both the GM event-specific DNA and newly-expressed insecticidal and marker proteins. In the case of proteins, testing was done using methods that were at least 100 times more sensitive than those previously used and reported. The current study also shows the consistency of these results and analyzed 12 separate batches of raw sugar (98.6–99.7% sucrose purity), produced from four plots each from three GM sugarcane varieties. Separate previous detailed studies showed that important stalk tissue components from the three CTC GM sugarcane varieties were substantially equivalent to their conventional comparators using the OECD recommended compositional parameters Citation10 and standard statistical methods. The parameters tested were moisture, dry weight, protein, fat, ash, total fiber, neutral detergent fiber, acid detergent fiber, and sucrose. The concentrations of glucose and fructose were also analyzed. Plant samples were obtained from five representative growing sites within Brazil, and the results of the individual and combined sites were compared. There were no statistically significant differences in combined site parameters for the three GM varieties tested when compared to their conventional comparator varieties for any of the parameters tested. Furthermore, all compositional parameters for all three GM event stalks were within the ranges observed for other commercial sugarcane varieties. Moreover, the 12 batches of very high purity raw sugar produced from the three GM varieties met accepted international standards for sugar and were deemed suitable for the production of refined sugar meeting Codex specifications (1999). A detailed manuscript describes the results specifically of testing of event CTC91087-6 plants and sugar, including compositional analysis. Citation8
In the most comprehensive study of the effects of sugarcane processing used in Brazil, Citation9 followed the fate of endogenous DNA and protein through the serial steps of processing using pressed juice produced from two different standard mill types, a diffuser type, and a tandem roller type. For both endogenous DNA and protein there was evidence for extensive degradation through the purification process, with the final result of no detectable DNA (~<1 ng/g) or protein (~< 1 ug/g) in refined sugar. The loss of DNA through the refining process for both mill types was similar and resulted in fragments of 500 bases or greater being undetectable in raw sugar and no detectable DNA in purified sugar. There was a difference in the number of identifiable proteins in the earlier fractions between the two processing schemes, with a greater number in the various fractions produced from juice extracted from the tandem roller mill than the diffuser mill. Approximately twice the number of proteins were identified in the former compared with the latter. Citation9 Regardless, the molecular weights of the proteins from juice produced from either type of mill decreased substantially with each successive processing step. Thus, the initial pressed juice fraction, before heating and flocculation had approximately 66% of all the proteins with molecular weights greater than 50 kD, whereas there were no proteins of this size in the raw sugar fraction. Additionally, the identification of protein fragments also decreased dramatically with processing. For example, in pressed juice there where 483 protein spots on 2-D gels, 476 peptides of which were identified as plant proteins through informatic searches. However, only 46 peptides fragments were identified in raw sugar and no fragments were detectable in refined sugar. The finding that a very limited number of sugarcane proteins were detectable in raw sugar indicated that a small proportion of endogenous sugarcane proteins might be somewhat resistant to full denaturation and complete removal. However, it is important to note that the overall amount of total protein concentrations detected decreased dramatically from greater than 3500 ppm in unprocessed pressed juice (prior to heating, pH adjustment, and flocculation) to 14 ppm in raw sugar with a significant reduction in both the complexity and molecular weight of the proteins identified. Further refining of the raw sugar, to refined sugar (99.9% purity), resulted in the lack of detection of total protein [<1 ug/g sugar) and a complete loss of detectable complex, higher molecular weight proteins. The results described above by, Citation9 are consistent with the large losses of detectable endogenous Rubisco stalk protein observed Citation7 ] during sugarcane processing, Citation7 reported that Rubisco, the most abundant protein present in sugarcane stalk, was degraded and eliminated during processing to raw sugar to values at least 3–4 orders of magnitude lower than stalk concentrations. These results showing the removal of protein during processing are consistent with several other studies [ Citation7-Citation9,Citation13-Citation15 ] that also showed no detectable GM DNA or protein in sugar produced from GM sugarcane or GM sugar beets.
The Cry1Ab, Cry1Ac, NPTII, and PAT (bar) proteins expressed in the three CTC sugarcane varieties studied herein have undergone various thermostability studies which were intended to mimic food processing conditions. Citation16,Citation17 For example, de Luis et al. Citation18,Citation19 reported that heating (nixtamalization) of maize grain containing Cry1Ab at 85°C for 60 minutes produced a 70% loss of detectable immunoreactive protein whereas a 90% reduction occurred after 3 minutes when heated in porridge at 75°C. Citation19 Susceptibility to denaturation at a temperature of 75–77°C was also shown in studies of maize leaf extracts where 50–70% of immunoreactive protein was lost in just 2 min. Citation18 These results were also consistent with studies of the E. coli produced Cry1Ab that showed a complete loss of insecticidal activity after treatment at 80°C for 10 minutes. Citation20 Similarly, for the Cry1Ac protein, studies of the 133 kDa native protein showed that baking conditions resulted in at least 94% loss of immunoreactive Cry1Ac. Citation21 In other words, the Cry1A proteins found in the CTC sugarcane events are known to denature and to lose immunoreactivity under heating conditions of about ~80°C. Typical industrial sugarcane processing involves heating to over 100°C for up to 3 h ().
Similar conclusions can also be made regarding the susceptibility of the selectable marker enzymes PAT (bar) and NPTII to denaturation and loss of enzymatic activity following heat treatment [ Citation22 , Fuchs et al., Citation23 ]. For example, Citation22 found a complete loss of enzyme activity when the phoshinothricin-N-acetyl-transferase (PAT) was heated at 55°C for 10 minutes. The loss of ELISA detectable NPTII found in the current study is consistent with the results of previous studies that examined NPTII loss during processing. Citation7,Citation14 In conclusion, there is strong evidence that the proteins expressed in the CTC sugarcane varieties tested herein are expected to be denatured and removed at the temperatures used in sugarcane processing.
The results presented herein significantly extend previous studies on the processing of GM sugarcane by using highly sensitive methods and by analyzing 12 batches of three different GM varieties. Specifically, validated ELISA methods established that there were no detectable GM proteins in raw sugar with LOD values of 8.5 ng/g raw sugar for Cry1Ac, 6.0 ng/g for PAT (Bar), 2.9 ng/g for Cry1Ab, and 5.5 ng/g for NPTII. Of course, further refining of the higher purity raw sugar tested herein (98.6–99.7% sucrose) to refined sugar (~99.9%) would only further reduce protein concentrations. These results are consistent with several other studies showing the lack of detection of either the exogenous GM DNA or protein in sugar produced from GM sugarcane or sugar beets[Citation7-Citation9,Citation13-Citation15] or the loss of endogenous high-copy DNA and proteins during the processing of conventional sugarcane. Citation7–Citation9
The lack of detection of the newly-expressed proteins in sugar has direct implications to the evaluation of the safety of the sugar. Safety or risk assessments of proteins examine the know safe protein oral consumption rate compared with the intake of the protein from food (or feed). As noted by,23 the Cry1Ab, Cry1Ac, NPTII, and PAT (bar] proteins expressed in the three sugarcane varieties tested herein are nontoxic, with oral No Observed Adverse Effect Levels (NOAEL) of 4,000 mg/kg bw (body weight). The proteins also have a history of safe use; Cry1A proteins have been used in microbial insecticidal sprays since the 1960 s and have been widely used in various GM crops since the late 1990s [Citation5;Citation6] The NPTII protein is present in the gut microbiome of healthy humans and both NPTII and PAT (bar) proteins have also been used in GM crops for over two decades. In addition to the lack of toxicity of these four proteins, the current study with raw sugar establishes that there is effectively no exposure to these proteins as a result of the consumption of refined sugar by global consumers. Stated differently, the safety of the sugar is established given the very high NOAEL values and the lack of exposure.
In conclusion, these results establish that there is no detectable presence of GM DNA or proteins in 12 batches of raw sugar produced from three separate CTC sugarcane GM varieties using highly sensitive, specific, and validated qPCR and ELISA methods. There was no detectable DNA or Protein in sugar produced from conventional or GM sugarcane.
References
- de Oliveira Bordonal R , Carvalho JLN , Lal R , de Figueiredo EB , de Oliveira BG , La Scala N. Sustainability of sugarcane production in Brazil: A review. Agron Sustain Dev. 2018;38:13.
- Jaiswal D , Souza AP , Larsen S , LeBauer DS , Miguez FE , Sparovek , … Long SP. Brazilian sugarcane ethanol as an expandable green alternative to crude oil use. Nat Clim Chang. 2017;7:788–92.
- CTNBio . 2017. Technical Opinion N° 5.483/2017. Published at DOU (Brazilian Federal Register) at 27th June, 2017.
- CTNBio . 2018. Technical Opinion N°5.837/2018. Published at DOU (Brazilian Federal Register) at 28th March, 2018
- Betz FS , Hammond BG , Fuchs RL. Safety and advantages of Bacillus thuringiensis-protected plants to control insect pests. J Regulat Toxicol Pharmacol. 2000;32:156–73.
- Koch MS , Ward JM , Levine SL , Baum JA , Vicini JL , Hammond BG . The food and environmental safety of Bt crops. Front Plant Sci. 2015;6:283.
- Cheavegatti-Gianotto A , Gentile A , Oldemburgo DA , Merheb GDA , Sereno ML , Lirette RP , Oliveira WSD . Lack of Detection of Bt sugarcane Cry1ab and nptII D and Proteins in sugarcane Processing Products including raw sugar. Frontiers Bioengin Biotechnol. 2018;6:24.
- Cheavegatti-Gianotto , Rocha MS , Cutri L , Lopes FC , Dal’Acqua W , Hjelle JJ , Oliveira WS , Sereno ML . The insect-protected CTC91087-6 sugarcane event expresses Cry1Ac protein preferentially in leaves and presents compositional equivalence to conventional sugarcane. GM Crops Food. 2019. doi:10.1080/21645698.2019.165119.
- Cullis C , Contento AL , Schell MA . DNA and protein analysis throughout the industrial process of refining sugar cane. Int J Agricult Food Res. 2014;3(2):1.
- Organisation for Economic Co-operation and Development . 2011. Consensus Document on Compositional Considerations for New Varieties of Sugarcane (Saccharum ssp. hybrids): key Food and Feed Nutrients, Anti-Nutrients and Toxicants. ENV/JM/MONO(2011)51.
- ICUMSA , 2019. International Commission for Uniform Methods of Sugar Analysis. http://www.icumsa.org/index.php?id=121
- Sharp PM , Li WH . Ubiquitin genes as a paradigm of concerted evolution of tandem repeats. J Mol Evol. 1987;25:58–64.
- Joyce PA , Dinh SQ , Burns EM , O’shea MG . Sugar from genetically modified sugarcane: tracking transgenes, transgene products and compositional analysis. Int Sugar J. 2013;12:860–63.
- Klein J , Altenbuchner J , Mattes R . Nucleic acid and protein elimination during the sugar manufacturing process of conventional and transgenic sugar beets. J Biotechnol. 1998;60:145–53.
- Oguchi T , Onishi M , Chikagawa Y , Kodama T , Suzuki E , Kasahara M , Furui N . Investigation of DNA in residual sugar from sugar beet (Beta vulgaris l.). Shokuhin eiseigaku zasshi. J Food Hygiene Soc Jpn. 2009;50:41–46.
- Hammond B , Jez JM . Impact of food processing on the safety assessment for proteins introduced into biotechnology-derived soybean and corn crops. Food and Chemical Toxicol. 2011;49:711–21.
- Hammond B , Kough J , Herouet-Guicheney C , Jez JM , ILSI International Food Biotechnology Committee Task Force on the Use of Mammalian Toxicology Studies in the Safety Assessment of GM Foods . Toxicological evaluation of proteins introduced into food crops. Crit Rev Toxicol. 2013;43(sup2):25–42.
- De Luis R , Perez MD , Sanchex L , Lavilla M , Calvo M . Kinetic and Thermodynamic Parameters for Heat Denaturation of Cry1A(b) Protein from Transgenic Maize (Zea mays). J Food Sci. 2008;73:447–51.
- de Luis R , Lavilla M , Sanchez L , Calvo M , Perez MD . Immuno-chemical detection of Cry1Ab protein in model processed foods made with transgenic maize. Eur Food Res Technol. 2009;229:15–19.
- Perferoen M . Environmental Protection Agency’s White Paper on Bacillus Thuringiensis Plant-Pesticide Resistance Management. (USA): EPA; 1998.
- Kough J , Wozniak C , Vaituzis Z , Borges S , Reynolds A , Martinez J , Mendelson M . Bacillus thuringiensis Cry1Ac Protein and the Genetic Material (Vector PV-GMIR9) Necessary for Its Production in MON 87701 (OECD Unique Identifier: MON 877Ø1-2) Soybean. U.S. Environmental Protection Agency: Environmental Production Agency; 2010.
- Herouet C , Esdaile JD , Mallyson A,B , Debruyune E , Schulz A , Currier T , … Hendrick K . Safety evaluation of the phosphinothricin acetyltransferase proteins encoded by the pat and bar sequences that confer tolerance to glufosinate-ammonium herbicide in transgenic plants. Regulat Toxicol Pharmacol. 2005;41:134–49.
- Fuchs R. L , Ream J. E , Hammond B. G , Naylor M. W , Leimgruber R. M Berberich S. A . Safety assessment of the neomycin phosphotransferase ii (nptii) protein. Biotechnology(N Y). 1993;11():1543-7.
- Kennedy RD , Cheavegatti-Gianotto A , De Oliveira WS , Lirette RP , Hjelle JJ . A general safety assessment for purified food ingredients derived from biotechnology crops: case study of Brazilian sugar and beverages produced from insect-protected sugarcane. Frontiers Bioengin Biotechnol. 2018;6:45.