
 ?Mathematical formulae have been encoded as MathML and are displayed in this HTML version using MathJax in order to improve their display. Uncheck the box to turn MathJax off. This feature requires Javascript. Click on a formula to zoom.
ABSTRACT
Evolution of resistance to genetically modified Bacillus thuringiensis (Bt) crops in pest populations is a major threat to the sustainability of the technology. Incidents of field resistance that have led to control problems of Bt crops or significantly reduced susceptibility of individual Bt proteins in pyramided plants have increased dramatically across the world, especially in recent years. Analysis of globally published data showed that 61.5% and 60.0% of the cases of resistance with major alleles that allowed homozygous resistant genotypes to survival on Bt crops were functionally non-recessive and did not involve fitness costs, respectively. Dominance levels (DFLs) measured on Bt plants ranged from −0.02 to 1.56 with a mean (± sem) of 0.35 ± 0.13 for the 13 cases of single-gene resistance to Bt plants that have been evaluated. Among these, all six cases with field control problems were functionally non-recessive with a mean DFL of 0.63 ± 0.24, which was significantly greater than the DFL (0.11 ± 0.07) of the seven cases without field resistance. In addition, index of fitness costs (IFC) of major resistance was calculated for each case based on the fitness of resistant (R’R’) and heterozygous (R’S’) genotypes on non-Bt plants divided by the fitness of their susceptible (S’S’) counterparts. The estimated IFCs for 15 cases of single-gene resistance were similar for R’R’ and R’S’, and for the cases with and without field resistance; and the values averaged 1.10 ± 0.12 for R’R’ and 1.20 ± 0.18 for R’S’. Limited published data suggest that resistance of insects to dual/multiple-gene Bt crops is likely to be more recessive than the related single-gene resistance, but their IFCs are similar. The quantitative analysis of the global data documents that the prevalence of non-recessive resistance has played an essential role in the widespread evolution of resistance to Bt crops, while the lack of fitness costs is apparently not as critical as the non-recessive resistance. The results suggest that planting of ‘high dose’ traits is an effective method for Bt crop IRM and more comprehensive management strategies that are also effective for functionally non-recessive resistance should be deployed.
Introduction
The year of 1996 marked the first year that genetically modified (GM) crops expressing Bacillus thuringiensis (Bt) genes were officially commercialized in the US and several other countries.Citation1 Since then, Bt crops have gained widespread acceptance throughout the world. By 2018, a total of more than one billion hectares of Bt crops had been planted in more than 20 countries.Citation1 The predominant Bt crops planted are maize, cotton, and soybean. Bt crop traits are usually highly effective in controlling some major insect pests; thus, considerable economic, environmental, and social benefits have been gained from planting Bt crops in both industrial and developing countries.Citation1–5
However, evolution of resistance in target insect populations is a great threat to the sustainability of the Bt crop technology.Citation6–8 To delay resistance evolution, a ‘high dose/refuge’ (HDR) insect resistance management (IRM) strategy has been recommended in the U.S. and several other countries. Citation9,Citation10 This strategy requires crop growers to plant a portion of the crop with ‘high dose’ Bt plants that can kill almost all homozygous-susceptible (SS) individuals and heterozygous-resistant (RS) individuals of the target pest species, while the remaining portion of the crop is planted with non-Bt plants to serve as a ‘refuge’ for SS populations. In this scenario, abundant SS individuals from the refuge plants will be available to mate with the rare homozygous-resistant (RR) survivors from the Bt plants. In this way, the majority of the offspring, if they possess resistance alleles, should be heterozygous, and these RS individuals will be killed by the ‘high dose’ Bt plants. As a result, resistance evolution should be greatly delayed.Citation9,Citation11 The current HDR for Bt crop IRM was largely based on knowledge generated from earlier laboratory studies of resistance to purified Bt proteins and Bt insecticides. Several earlier studies showed that high-level resistance to purified Bt proteins or Bt insecticides was typically recessive.Citation11–14 In addition, it was also thought that Bt plants might be able to make ‘genetically’ non-recessive resistance functionally recessive because GM plants could be engineered to consistently express high levels of Bt proteins that would be capable of killing a large portion of ‘genetically’ non-recessive RS individuals. Citation11,Citation15 Thus, functionally recessive resistance is a key foundation for the success of HDR strategy.Citation14,Citation16,Citation17 Another IRM strategy for Bt crops is ‘gene pyramiding’ of two or more Bt genes with dissimilar modes of action.Citation18–20 In the gene pyramiding, if individuals in insect populations carrying resistance alleles to one Bt protein are rare, the individuals simultaneously possess resistance alleles to two or more Bt proteins must be very rare. No significant cross-resistance that allows survival of resistant insects to one Bt protein on pyramided plants is a key assumption for the success of this strategy.
Fitness costs of resistance refers to a reduced fitness (e.g. delayed development, higher mortality, lower reproduction) of RR or RS individuals relative to SS individuals in the absence of selection. If both RR and RS individuals show fitness costs, the phenomenon is called non-recessive fitness costs. Otherwise, if only RR individuals show fitness costs, but RS performs similarly to SS, the fitness cost is considered recessive.Citation21–23 Both the dominance level and fitness costs of resistance are important factors in resistance evolution. Fitness costs of resistance could result in declines in resistance and even reversion to susceptibility after selection pressure is removed.Citation21–23 Earlier studies with purified Bt proteins or Bt insecticides showed that Bt resistance, especially high-level resistance, was often associated with fitness costs. Citation12,Citation23,Citation24 Thus, fitness costs are also considered a positive factor that may elevate the effectiveness of refuge planting for Bt crop IRM.Citation23
After 20+ years of global Bt crop use, field resistance that has resulted in reduced efficacy of Bt crops or significantly reduced susceptibility of individual Bt proteins in pyramided Bt plants has been documented in at least 20 cases involving seven major pest species of maize and cotton in six countries across four continents.Citation6–8 In addition, major resistance alleles that allow RR individuals to survive and complete their life cycle on Bt plants,Citation25 while susceptible individuals of the species are controlled by the Bt plants, have also been isolated in several cases.Citation6,Citation7 To avoid any confusions with the survival due to natural tolerance, in this review, the term ‘major resistance allele’ for Bt plants is defined as RR individuals (populations, colonies, strains) possessing homozygous resistance alleles should exhibit a significantly greater rate to survive and complete their life cycles on the Bt plants, relative to their susceptible counterparts. It should be pointed out that there is variability in Bt susceptibility within populations of a same pest species even before Bt crops are commercialized. Information that was used to judge if a case of resistance qualified as ‘a major resistance allele’ in this review was based on only the resistant and susceptible insect populations used in the peer-reviewed studies. Based on this definition, ‘field resistance’ certainly qualifies as ‘major resistance’. However, finding major resistance alleles in a pest population does not necessarily indicate an immediate threat of field resistance to the Bt plants.Citation26 Field resistance can occur when the frequency of major resistance alleles becomes sufficiently common to reduce efficacy of the Bt crop in field.Citation6,Citation17 During the last two decades, many studies have been conducted in the world to characterize the resistance (e.g. dominance, fitness costs, etc.) for some of these cases involving major resistance alleles including field resistance. Several previous reviews have analyzed the general conditions that are associated with the evolution of resistance to Bt proteins and/or Bt plants.Citation6,Citation7,Citation11,Citation12,Citation14,Citation17,Citation23,Citation27–30 In this mini review, I focus on only two important aspects that are closely related to resistance management: dominance level and fitness costs of resistance to Bt plants. More specifically, in the current review I will first extend the methods that are used to measure dominance levels/fitness costs of resistance in insect on single-gene Bt plants to pyramided Bt plants and then use the related globally published data to quantitatively analyze the relationship between dominance levels/fitness costs and the evolution of resistance to Bt crops. In addition, variations in the dominance levels/fitness costs among pest populations, Bt proteins, test methods, and crop-pest systems are also discussed. Knowledge generated from this analysis should be useful in understanding the reasons that have led to the recent wide occurrence of field resistance to Bt crops in the world and in refining current IRM strategies for the sustainable use of Bt crop technology.
Criteria for literature selection and cases of resistance to Bt crops
Google Scholar (https://scholar.google.com/) was used to search the related literature published before January 31, 2020. Because Bt proteins expressed in GM plants can be different from the proteins produced by B. thuringiensis bacteria, information generated from the studies that used Bt protoxin, activated proteins, or microbial insecticides may not directly represent the status of insect resistance to Bt crops.Citation31 To ensure data used in this review more accurately reflect the real situation of resistance to Bt crops, the following three criteria were used in selection of literature. First, only articles published in peer-reviewed journals were used. Second, resistant insects used in studies must have possessed major resistant genes to the Bt plants as defined above.Citation17,Citation25 Third, biological parameters measured in the studies must have been obtained from assays using whole plants/plant tissues of maize or cotton, because, by far, field resistance to Bt crops has been found only in Bt maize or Bt cotton.Citation7 In other words, those studies using the ‘resistant’ populations that had not been documented to carry major resistance alleles to Bt plants, as well as data generated from assays on meridic diet or Bt protein-treated diet, or plants other than maize or cotton, were not included in this review. Use of published data was approved by the senior or corresponding author of each selected publication. To facilitate the analysis, the definition of a ‘case’ of resistance described in referenceCitation7 was adopted, which means that each case of single-gene resistance represents a resistance of one pest species in one country to one Bt protein in the crop plant. In addition, in this review, the definition of ‘case’ of single-gene resistance was also extended to include dual-/multiple-gene resistance. A case of resistance to dual/multiple-gene Bt gene plants means a resistance of one pest species in one country to the dual-/multiple-Bt proteins expressed in a pyramided crop trait. A pyramided crop trait is a GM plant product that contains two or more Bt genes with dissimilar modes of action for a target pest species.Citation32
Based on the literature selection criteria described above, dominance level of resistance to Bt plants was evaluated in a total of 26 studies, which involved 17 cases of major resistance in seven target insect species to eight Bt proteins in maize or cotton ( and Supporting information: ). The seven insect species comprised almost all global major target pests of Bt maize and Bt cotton, and the eight Bt proteins included almost all the Bt proteins expressed in Bt crops currently available in the global market. Among the 17 cases, 13 cases were resistant to single-gene Bt crops and the rest four were associated with resistance to dual/multiple-gene Bt crops. Resistance accompanied by field control problems, defined as field resistance mentioned above, has been reported in six of the 13 cases of single-gene resistance. The term ‘field resistance’ in this review means that the resistance has resulted in field control problems of a Bt crop, or significantly reduced susceptibility of individual Bt proteins in pyramided Bt plants, which is similar to the ‘practical resistance’ defined in the reference.Citation6 Besides the condition of field control problem, the criteria for ‘practical resistance’ also include that >50% of individuals in a population are resistant.Citation6,Citation60 Because resistance allele frequencies for some cases that qualify as ‘field resistance’ as described above have not been reported, or the rate of the resistant individuals for some cases was <50%, the term ‘field resistance’ is used in this review. The six cases with field resistance are the resistance of Busseola fusca to Cry1Ab maize in South AfricaCitation61; Spodoptera frugiperda to Cry1F maize in BrazilCitation59 and in the U.S.Citation62,Citation63; Diabrotica virgifera virgifera to Cry3Bb1 maize in the U.S.Citation64; D. virgifera virgifera to eCry3.1Ab maize in the U.S.Citation65; and S. frugiperda to Cry1A.105 maize in the U.S.Citation63,Citation66 The documented high resistance allele frequency in S. frugiperda to Cry1A.105 maize and the observed high cross-resistance of the insect between Cry1F and Cry1A.105 maizeCitation63,Citation66 were similar to the results reported in the resistance of Diatraea saccharalis to Cry1A.105 maize in ArgentinaCitation67 which was listed as a case of ‘practical resistance’ in the reference.Citation7 Thus, the resistance of S. frugiperda to Cry1A.105 maize in the U.S was also considered a case of field resistance in the current review. Major resistance of the seven cases without field control problems was usually isolated through laboratory selections. Three of the seven laboratory cases were established using massive-selections, while the rest four were isolated with F2 screen. As mentioned above, these laboratory selections may not exactly reflect the real situation of the field selections, especially for those cases established from long-term and massive-selections on Bt protein-treated diet.Citation31 Thus, it is possible that the selection methods might confound the analysis in this review.
Table 1. Dominance levels (DFLs) of 17 cases of major resistance to Bt crops in seven target pest species
On the other hand, fitness costs of resistance to Bt plants have been investigated in a total of 28 studies in the world, which involved 20 cases of major resistance in eight insect species to eight Bt proteins in maize or cotton ( and Supporting information: ). The eight insect species included all the seven species described above in which the dominance level of resistance has been investigated, plus Trichoplusia ni, a secondary target species of Bt cotton in the U.S. In addition, the eight Bt proteins are the same as those evaluated in the studies of dominance levels. Among the 20 cases, 15 cases involved single-gene resistance and five cases were associated with resistance to dual/multiple-gene Bt plants. The 15 cases of single-gene resistance also included all the six cases with field resistance mentioned above, while field resistance has not been documented for all other cases.
Table 2. Index of fitness costs (IFCs) of 20 cases of major resistance to Bt crops in eight target pest species
Measurement and calculation of dominance levels of resistance to Bt plants
As described in the referenceCitation14, dominance of a single gene resistance can be measured in three ways: dominance of insecticide resistance (e.g. DLC), which is based on the dose-mortality response curves of RR, RS and SS genotypes; effective dominance (DML), which is based on the mortality levels of the three genotypes at a given toxin concentration; and dominance of relative fitness in the treated area (DWT), which is based on the fitness of the three genotypes at a given toxin concentration. These three measurements are related, but they are not the same. Among the three, DWT provides the most useful information for resistance management.Citation14 However, measurement of DWT is usually more difficult than measurements of DLC and DML. For this reason, most of the early studies of Bt resistance measured only DLC or DML. In this study, I extend the methods for calculating the dominance levels of single-gene resistance described in the referenceCitation14 to also include the cases of resistance to dual/multiple-gene Bt plants. More specifically, the dominance for single- or dual/multiple-gene resistance to Bt plants can be calculated as:
Here, D’ML is the effective dominance of single- or dual/multiple-gene resistance to Bt plants based on the mortality levels of the three genotypes (R’R’, R’S’, and S’S’) on Bt plants; and D’WT is the dominance of relative fitness in the treated area based on the fitness of the three genotypes on Bt plants. MR’R’, MR’S’, and MS’S’ are the mortality levels of the single- or dual/multiple-gene homozygous-resistant (R’R’), heterozygous (R’S’), and homozygous-susceptible (S’S’) genotypes on the corresponding single- or dual/multiple-gene Bt plants, respectively. For examples, If A, B, and C represent three different resistant alleles and a, b, and c refers to the three corresponding susceptible alleles of the three genes, R’R’, R’S’, and S’S’ represent AA, Aa, and aa for a single-gene resistance; AABB, AaBb, and aabb for a dual-gene resistance; or AABBCC, AaBbCc, and aabbcc for a triple-gene resistance. The measurement of D’ML or D’WT described here can also be used to calculate the dominance levels for other genotypes in dual/multiple-gene resistance (e.g. AABb, AaBB, AABBCc, etc.) as described in reference.Citation56 Among the 22 studies that evaluated the dominance level of resistance to single-gene Bt crops, five studies measured D’WT, while the other 17 measured D’MLs that were based on survivorship of S’S’, R’S’, and R’R’ individuals on whole Bt plants or plant tissues using exposure times from 7 d to a period encompassing neonate-to adult development (). Among the five studies that evaluated dominance level of dual/multiple-gene resistance to Bt plants, one study evaluated D’WT and the other four measured D’ML ().
In this review, dominance level (functionally) (hereafter referred to as DFL) was calculated for each case of single- or dual/multiple-gene resistance to Bt plants based on the values of D’ML or D’WT reported in each study. Similarly, as described in the referenceCitation14, DFL values normally vary from 0 to 1 (DFL = 0, functionally completely recessive; DFL = 1, functionally completely dominant). In the situations in which >1 study was conducted, >1 insect population was evaluated, or >1 trial was performed for a case, the DFL for the case was calculated as the average of D’MLs or D’WTs, or the mixed D’MLs and D’WTs across studies, populations, or trials. Data sources and calculations of DFLs of the 17 cases are listed in the Supporting Information (Appendix ) linked to this publication.
Measurement and calculation of index of fitness costs of resistance to Bt plants
To facilitate quantitative analysis of the fitness costs of resistance to Bt plants, a term, index of fitness cost (IFC), is used in this review. IFC for both single- and dual/multiple-gene resistance is calculated using the formulaCitation81:
Here IFCR’R’ and IFCR’S’ refer to the index of fitness costs of resistant-homozygous (R’R’) and – heterozygous (R’S’) genotypes, respectively. R’R’, R’S’, and S’S’ represent the three genotypes as described in the measurement of D’ML or D’WT. FS’S’, FR’S’, and FR’R’ refer to the fitness of S’S’, R’S’, and R’R’ genotypes on non-Bt plants or non-Bt plant tissues, respectively. IFC < 1 means that fitness costs are associated with the resistance; IFC = 1 suggests lack of fitness costs; and IFC > 1 indicates that there are fitness advantages. If IFCR’R’ < 1 but IFCR’S’ = 1 for a resistance, fitness costs are recessive, while if both IFCR’R’ and IFCR’S’ are < 1, fitness costs are non-recessive. Non-recessive fitness costs are considered more important in resistance management than recessive fitness costs, because R’S’ individuals are usually much more abundant than R’R’ individuals in the absence of Bt selection.Citation23 Similarly as mentioned for D’ML or D’WT, the measurement of IFC described here could also be used to calculate the fitness costs of other genotypes in dual/multiple-gene resistance to Bt crops (e.g. AaBB, AABbCc, etc.).
In the review of the 28 studies, only oneCitation71 reported the IFC value directly, while all others showed various fitness parameters. These biological parameters included insect survivorship with a wide range of exposure period, insect development, growth (e.g. larval and/or pupal body mass), sex ratio, egg production, and egg hatching rate (Supporting Information Appendix ). One study evaluated fitness for both field-collected parental (F0) and F1 generations.Citation68 In this review, a ‘combined fitness index’ was used to measure the fitness (FS’S’, FR’S’, or FR’R’) of each insect genotype on plants or plant tissue. Combined FS’S’, FR’S’, or FR’R’ values were calculated based on the most comprehensive measurements reported in each study with the methods described below:
If the intrinsic rate of population increase, rm, was available in a study, rm was used as the combined fitness index and no other parameters were considered in IFC calculation for the study.
If rm was not available, but insect survivorship, developmental time, egg production, and egg hatching rate were reported, the combined fitness index was calculated as: (insect survivorship x egg production x egg hatching rate)/insect developmental time. No other parameters were considered in IFC calculation for the study.
If any of the parameters in the formula described in b was not available, the item for that parameter was excluded in calculation of the combined fitness index.
IFC was calculated for both R’R’ and R’S’ (if data available) for each population in each study. Similarly, as described for the DFL calculation, in situations in which >1 study was conducted, >1 insect population was evaluated, or >1 trial was performed for a case, the IFC of the case was calculated as the average of IFCs across studies, populations, or trials. Data sources and detailed IFC calculations for the 20 cases are listed in the Supporting Information (Appendix ).
Dominance, DFL, of Resistance to Bt crops
Analysis of global studies showed that DFLs of the 13 cases of major resistance to single-gene Bt crops ranged from −0.02 to 1.56 with a mean of 0.35 ± 0.13 (). Among the 13 cases, functionally recessive resistance was reported in only five cases (or 38.5% of the total) with a DFL of zero or close to zero. These five cases were the resistance of Ostrinia nubilalis to Cry1F maize in the U.S. (DFL = 0.04), S. frugiperda to Cry2Ab2 maize in the U.S. (DFL = −0.02), S. frugiperda to Vip3A maize in Brazil and the U.S. (DFL = 0 for both cases), and Pectinophora gossypiella to Cry1Ac cotton in the U.S. (DFL = 0). To date, field resistance has not been reported for any of these five cases. Resistance in the other eight cases (61.5%) was functionally non-recessive with a DFL of 0.10 or greater ().
All of the six cases with field resistance were functionally non-recessive with a DFL ranging from 0.10 to 1.56 (). The resistance in two of the six cases was completely or even over-completely dominant: resistance in B. fusca to Cry1Ab maize in South Africa, with a DFL of 1.56, and D. virgifera virgifera to eCry3.1Ab maize in the U.S. with a DFL of 1.16. Resistance in the other four cases of field resistance ranged from incompletely recessive to co-dominant. The mean DFL for the six cases with field resistance was 0.63 ± 0.24 (mean ± sem), while it was 0.11 ± 0.07 for the seven cases without practical field resistance (). The difference in DFLs between the cases with and without field resistance was significant (SAS PROC NPAR1WAY Wilcoxon, P = .0309) (). The four cases of dual/multiple-gene resistance in which DFL has been evaluated involved only the resistance of S. frugiperda to Bt maize in Brazil and the U.S. These limited data suggest that dual/multiple-gene resistance is more likely to be recessive than the related single-gene resistance. Three of the four dual/multiple-gene resistance cases were functionally recessive with a DFL of zero and the remainder was incompletely recessive with a DFL of 0.20 ().
Table 3. Comparison of dominance levels (DFLs) and index of fitness costs (IFC) of single-gene resistance between cases with and without field resistance to Bt crops
As mentioned above, because it is usually difficult to measure D’WT, 10 of the 13 single-gene resistance cases actually measured only D’MLs, which is calculated based on mortality only. It is believed that the dominance level can be over-estimated using only D’ML, because R’S’ survivors can be less fit than R’R’ survivors.Citation14 GM Bt plants are usually very effective against S’S’ and thus S’S’ individuals rarely survive on Bt crops. In this situation, if R’S’ survivors are less fit than R’R’ survivors, the actual D’WT will be lower than D’ML. However, data from the 13 cases of single-gene resistance analyzed in this review do not provide any evidence to indicate that D’ML is greater than D’WT. For example, both D’ML and D’WT were estimated for the Brazilian case of Cry1F resistance in S. frugiperda. Based on neonate-to-adult survivorships on Cry1F leaf tissue, Farias et al.Citation34 reported a D’ML of 0.15 for the population BR25R. In another study, Leite et al.Citation35 assessed the dominance levels of two populations (IrmaF and IrmaD) based on a ‘fitness index’ on Cry1F maize leaf tissue. The ‘fitness index’ was calculated using the formula, fitness index = (neonate-to-pupal survival x pupal weight)/neonate-to-pupal development time. Using this method, the dominance levels for IrmaF and IrmaD were estimated to be 0.36. In addition, Santos-Amaya et al.Citation36 also examined the dominance levels of two other populations (MTH and MRH) on Cry1F plants using the same ‘fitness index’ as described in reference.Citation35 The estimated dominance levels for MTH and MRH were 0.12 and 0.17, respectively. Studies have shown that pupal body weight is usually highly correlated to reproduction in many lepidopteran species.Citation82 Thus, the estimated dominance levels in the four populations evaluated in referencesCitation35,Citation36 could be considered a close estimate to the true DWT. The average dominance level (or D’WT) of the four populations was 0.25, which was somewhat greater than the D’ML (0.15) estimated in reference.Citation34 In addition, three of the five cases of single-gene resistance that were identified to be completely recessive or nearly completely recessive were based on the measurement of D’MLs. More importantly, the significantly greater overall DFL values for the six cases with field resistance, relative to the seven cases without field resistance, are particularly telling and document that DFLs estimated in these studies were closely correlated to the resistance evolution in the field.
There were a few cases in which DFL of a case have been evaluated for multiple populations. In some cases, DFL values among populations within a case were consistent. For example, the resistance of S. frugiperda to Cry1F maize was incompletely recessive in all five Brazilian populations examined (). Similarly, the resistance of D. virgifera virgifera to Cry3Bb1 maize in five U.S. populations was all incompletely recessive or codominant with DFL values ranging from 0.27 to 0.59 (). However, in some cases, notable variations were observed. For example, the resistance of Helicoverpa armigera to Cry1Ac cotton in Australia was completely recessive on 4-week old cotton,Citation49 while it was incompletely dominant on 14-week cotton.Citation50 Variations in DFLs among populations in a case were also observed for the resistance of S. frugiperda to Cry1F maize and Cry1A.105 maize in the U.S. (Table A1).Citation37,Citation38,Citation43 In addition, differences in DFLs were noted among cases of a same pest-Bt crop system, but the differences were relatively small. For example, both cases of S. frugiperda resistance to Cry1F maize in Brazil and the U.S. were incompletely recessive. Similarly, both cases of resistance to Vip3A maize were completely recessive in the two countries. In contrast, variation in DFLs for a target pest species appeared to be greater among different Bt protein-crop systems. For example, DFLs of S. frugiperda resistance varied from −0.02 on Cry2Ab2 maize to 0.34 on Cry1A.105 maize, and DFLs of D. virgifera virgifera resistance differed from 0.41 on Cry3Bb1 maize to 1.16 on eCry3.1Ab maize. Nevertheless, the published data showed that all three cases of resistance associated with maize plants expressing the Vip3A protein were completely recessive with a DFL of zero which provides evidence that GM plants containing Vip3A gene most likely produce the necessary ‘high dose’ as required for the HDR strategy. The observed variation in DFLs among populations or among cases within the same species could be due to genetic differences in resistant genes and/or differences in test conditions, such as differences in plant growth stages or tissues used in bioassays. Thus, experiments testing with multiple insect populations under different environmental conditions are necessary in order to generate robust DFLs.
It should be pointed out that the estimated dominance of resistance for dual/multiple- gene resistance to Bt plants may not only reflect the inheritance of survival/fitness to each Bt protein in a pyramid, but also can be associated with the interactions of different Bt proteins in plants, such as effects of cross-resistance and the extent of redundant killing. Exploring such relations in detail is beyond the scope of this review. Nevertheless, information on the dominance of dual/multiple-gene resistance to Bt plants should also be useful in resistance management as for the single-gene resistance. Additional studies are necessary to analyze the dominance levels of dual-/multiple-gene resistance to Bt plants. However, the lower dominance levels observed from the limited cases of dual-/multiple-gene resistance relative to single-gene resistance are an encouraging sign for the use of pyramided Bt crop traits for IRM.Citation10 The results suggest that pyramiding with dissimilar Bt proteins could make a non-recessive resistance to single-gene Bt plants functionally more recessive. In the U.S., single-gene Bt cotton has already been completely phased out of the market and replaced by pyramided varieties. Pyramided Bt maize was first commercialized in 2010 and since then pyramided Bt maize traits have been widely planted in the U.S. and several other countries. However, individual Bt proteins in all current pyramided crop traits have been used sequentially. In the sequential use of Bt proteins, there is possibility as only one active Bt gene being introduced in each ‘new pyramided trait’ if the target insects already become resistant to all other Bt proteins after being used for many years. In such cases, a new ‘pyramided trait’ essentially functionally just likes a single-gene trait, which would dramatically reduce the effectiveness of pyramiding for IRM.Citation6,Citation81,Citation83–86 It is believed that sequential use of Cry1 than Cry1 + Cry2 proteins in Bt maize and cotton could be a key factor that has contributed to the recent widespread occurrence of the field resistance of H. zea to pyramided Cry1A/Cry2A maize and cotton in the U.S. and the field resistance of P. gossypiella to Cry1A/Cry2A cotton in India.Citation80
Fitness costs, IFCs, of resistance to Bt crops
Global data analysis of the 28 studies showed that only six (or 40.0% of the total) of the 15 cases of major resistance to single-gene Bt crops were likely associated with fitness costs (). These six cases were the resistance of S. frugiperda to Cry1F maize in the U.S. (IFCR’R’ = 0.68), O. nubilalis to Cry1F maize in U.S. (IFCR’R’ = 0.77), S. frugiperda to Vip3A maize in Brazil (IFCR’R’ = 0.80), H. armigera to Cry1Ac cotton in Australia (IFCR’R’ = 0.71) and China (IFCR’R’ = 0.77), and P. gossypiella to Cry1Ac cotton in U.S. (IFCR’R’ = 0.48) (). Five cases (33.3%) of single-gene resistance showed some level of fitness advantage; these were the resistance of B. fusca to Cry1Ab maize in South Africa (IFCR’R’ = 1.91), D. virgifera virgifera to eCry3.1Ab maize in the U.S. (IFCR’R’ = 1.64), S. frugiperda to Cry1A.105 (IFCR’R’ = 1.65) and Cry2Ab2 (IFCR’R’ = 1.87) maize in the U.S., and D. saccharalis to Cry1Ab maize in the U.S. (IFCR’R’ = 1.28). The rest of the four cases (33.3%) exhibited IFCR’R’ values from 0.94 to 1.08, indicating lack of fitness costs or advantages. The 15 cases of single-gene resistance had a mean IFCR’R’ of 1.10 ± 0.12 (mean ± sem) and the IFCR’R’ (1.32 ± 0.20) of the six cases with field resistance was statistically similar to that (0.96 ± 0.14) of the nine cases without field resistance (SAS PROC NPAR1WAY Wilcoxon, P = .1941) ().
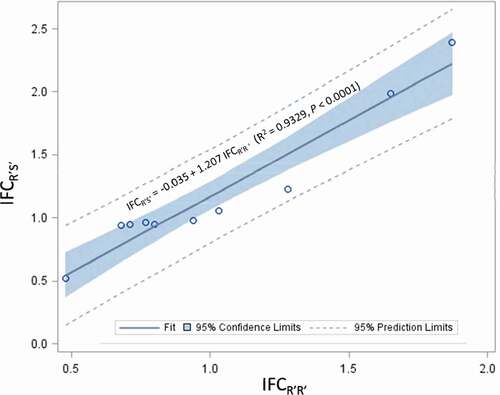
In addition, fitness costs of R’S’ were also evaluated for 10 of the 15 single-gene resistance cases, which included three cases with field resistance and seven cases without field resistance (). Fitness costs of R’S’ were clearly observed in only one of the ten cases, which was the resistance of P. gossypiella to Cry1Ac cotton in the U.S. with an IFCR’S’ of 0.51. In contrast, R’S’ individuals in three cases had a greater fitness than SS individuals; these cases were the resistance of S. frugiperda to Cry1A.105 (IFCR’S’ = 1.99) and Cry2Ab2 (IFCR’S’ = 2.39) maize and D. saccharalis to Cry1Ab maize (IFCR’S’ = 1.23) in the U.S. IFCR’S’ values of the remaining six cases ranged from 0.94 to 1.06, suggesting lack of fitness costs for R’S’. The mean IFCR’S’ (1.30 ± 0.34) of the three cases with field resistance was not different compared to that (1.15 ± 0.22) of the seven cases without field resistance (SAS PROC NPAR1WAY Wilcoxon, P = 1.000) (). IFCR’S’ is not independent of IFCR’R’; analysis of the ten cases in which both R’R’ and R’S’ were available showed a strong linear relationship between the two indices (IFCR’S’ = −0.035 + 1.207 IFCR’R’; R2 = 0.9329, P < .0001) (). In addition, a paired t-test with ‘case’ as the subject factor also showed that the mean IFCR’S’ (1.20 ± 0.18) was significantly greater than the IFCR’R’ (1.02 ± 0.14) for the ten cases (t = −3.23, df = 9, P = .0103).
Figure 1. Correlation analysis on index of fitness costs (IFC) of ten single-gene major resistance cases to single-gene Bt plants between resistant-homozygous (R’R’) and -heterozygous (R’S’) genotypes. Analysis was performed by treating the index of fitness costs for R’R’ (IFCR’R’) of a case as the independent variable and the index of fitness costs for R’S’ (IFCR’S’) of the case as the dependent variable
Fitness costs of dual/multiple-gene resistance were evaluated for only five cases and involved only two pest species, S. frugiperda and T. ni (). Fitness costs were likely associated with R’R’ in three of the five cases, which were the resistance of S. frugiperda to Cry1A.105/Cry2Ab2 maize in the U.S. (IFCR’R’ = 0.73) and to Cry1Ab/Vip3A maize in Brazil (IFCR’R’ = 0.86), and T. ni to Cry1Ac/Cry2A cotton in the U.S. (IFCR’R’ = 0.81). Fitness costs were not associated with the remaining two cases (IFCR’R’ = 1.0 for both cases). The mean IFCR’R’ for the five cases of dual-/multiple-gene resistance was 0.88 ± 0.05. IFCR’S’ has been evaluated for four of the five cases of dial/multiple-gene resistance and none of the four cases showed any fitness costs with an IFCR’S’ ranging from 0.98 to 1.15 and an average of 1.07 ± 0.04 ().
Fitness costs of resistance can vary depending on Bt protein, crop, insect species and population, test conditions, etc.Citation23 As observed for the DFLs, variations in IFCs were also reported among populations and cases within the same pest-crop system. For example, in the Brazilian Cry1F-resistant populations, fitness costs were likely associated with the MRH population on non-Bt maize in the studyCitation36 and a population on non-Bt cotton evaluated in the referenceCitation54, while lack of fitness costs was observed for other populations and test conditions (). Similarly, notable fitness costs were observed in two U.S. Cry3Bb1-resistant populations of D. virgifera virgifera, but lack of fitness costs was detected for other populations (). In addition, fitness costs were observed in the resistance of s, frugiperda to Vip3A maize for both the Brazilian and U.S. populations on non-Bt maize plants, but not for the U.S. population on non-Bt cotton.Citation46,Citation76 In contrast, in some cases, fitness costs were consistent among populations within a pest-crop system. For examples, all of the three U.S. Cry1F-resistant populations of S. frugiperda exhibited some level of fitness costs (). Considerable fitness costs were also observed in the two Australian Cry1Ac-resistant populations of H. armigera. In addition, both U.S. Cry1A.105-resistant populations of S. frugiperda studied in the referenceCitation43 performed similarly on non-Bt maize and both did not show any fitness costs.
The significant number (33.3%) of cases of single-gene resistance with fitness advantages observed in this review is a surprise. Fitness advantage of Bt resistance has been supposed to be very rare.Citation87 However, it is also believed that selection for Bt resistance could be linked to some genes that are favorable for insect growth and development.Citation72,87 In addition, some of the comparisons might involve the use of unrelated resistant and susceptible strains that may have differed for reasons unrelated to resistance. Unfortunately the available data listed in and could not clarify the situation. Further studies are warranted to understand the biological mechanisms or other factors behind the observed ‘fitness advantages’ of Bt resistance. The greater IFC for RS than RR in the ten cases of single-gene resistance is not surprised, because the fitness costs in four of five cases were recessive. In addition, in the two cases of S. frugiperda resistance to Cry1A.105 and Cry2Ab2 maize in which the resistance showed a fitness advantage (IFCRR > 1), the IFCRSs were still somewhat greater than the corresponding IFCRRs (). A possible reason for the greater performance of the RS relative to both RR and SS may be hybrid vigor, which could occur when crossing two populations that were inbred and had different genetic backgrounds.Citation23 Differences between resistant and susceptible strains of an insect species that are unrelated to the Bt resistance could be caused by many factors such as sources of insect strains, lab adaptation, diet adaptation, or isolation in resistance selections. To ensure a similar genetic background between SS and RR, the RR populations used in the two studies had been backcrossed with SS for at least two times and then reselected for resistance before they were used for the crosses to generate RS genotypes. If the better performance of the RS genotypes reported in the two cases was truly caused by hybrid vigor, it suggests that additional backcrossing would be necessary to ensure a more similar genetic background between RR and SS to avoid any possible confounding effect of ‘hybrid vigor’. The use of a susceptible comparator with different genetic bases could undermine the importance of fitness costs in the field.Citation23 In addition, choice of susceptible insect strain could also affect estimation of dominance because hybrid vigor would artificially inflate the apparent fitness of heterozygotes on Bt plants, as well as on non-Bt plants, and therefore could affect the calculated functional dominance values. However, a linear regression analysis (SAS PRO REG) with the ten cases that both IFR’S’ (x) and DFL (y) data are available failed to find any linkage between the fitness advantage of RS and the functional dominance levels of the resistance (y = 0.106 + 0.031 x, correlation coefficient R = 0.10 (P = .7762)). Nevertheless, as described above, it is critical in study of fitness costs and dominance levels of resistance to ensure a similar genetic basis among insect populations. A common method used to achieve similar genetic bases is to backcross the resistant populations to their susceptible comparator and reselect the resistance in the backcrossed populations. Theoretically, the similarity in genetic background among insect populations increases as the number of back-crosses increases.
Conclusion
It should be noted that major resistance genes for some insect-Bt crop systems, such as resistance of O. nubilalis to Cry1Ab maize, have not been identified yet. However, the 13 (for DFL) and 15 (for IFC) cases of major resistance to single-gene Bt crops analyzed in this review have included almost all the global major target pest species and all Bt proteins expressed in the world market of GM Bt crops. The surprisingly high rates of functionally non-recessive resistance (61.5%) and lack of fitness costs (60.0%) of resistance reported in this review clearly documented that high levels of resistance to Bt crops are usually non-recessive with no fitness costs. Use of insect populations with similar genetic background is critical in study of fitness costs and dominance levels of resistance. Otherwise, use of a susceptible comparator with different genetic background could undermine the importance of fitness costs in the field. Limited available data suggest that dual/multiple-gene Bt resistance is likely to be more recessive than the related single-gene resistance, but their IFCs are similar. Many factors can influence the speed of resistance development, but the documentations that all six cases of field resistance are functionally non-recessive, as well as the significantly greater DFLs of the cases with field resistance than those without field resistance provide clear evidence that the prevalence of non-recessive resistance has certainly played an essential role in the widespread occurrence of field resistance to Bt crops. In addition, the documented high rate of non-recessive resistance also provides solid counterevidence against a general application of the assumption of functionally recessive resistance for the recommended HDR strategy, at least for single-gene Bt crops. The lack of fitness costs might be associated with the widespread of the field resistance. However, the similar IFCs observed between the cases with and without field resistance suggest that the role of the lack of fitness costs is apparently not as critical as the non-recessive resistance. Information generated from this review suggests that planting of ‘high dose’ traits is an effective method for Bt crop IRM and more comprehensive management strategies that are also effective for functionally non-recessive resistance should be deployed.
Disclosure of potential conflict of interest
I have read the journal’s policy and the author declares no competing financial interests.
Supplemental Material
Download MS Word (43.8 KB)Acknowledgments
The author thanks Drs. Mike Stout, Jian-Zhou Zhao, and Ying Niu for reviewing an earlier draft of the manuscript. This publication has been approved by the Associate Vice President & Program Leader of the Louisiana State University Agricultural Center as manuscript No. 2020-234-34269. This study was sponsored by Hatch funds from the USDA National Institute of Food and Agriculture, and the USDA Multistate Research Project NC-246.
Supplementary material
Supplemental data for this article can be accessed on the publisher’s website.
References
- ISAAA. Global status of commercialized biotech/GM crops in 2018: biotech crops continue to help meet the challenges of increased population and climate change. Ithaca (NY); ISAAA Brief 2018; No. 54.
- Wu KM, Lu YH, Feng HQ, Jiang YY, Zhao JZ. Suppression of cotton bollworm in multiple crops in China in areas with Bt toxin-containing cotton. Science. 2008;321:1676–78. doi:https://doi.org/10.1126/science.1160550.
- Hutchison WD, Burkness EC, Mitchell PD, Moon RD, Leslie TW, Fleischer SJ, Abrahamson M, Hamilton KL, Steffey KL, Gray ME, et al. Areawide suppression of European corn borer with Bt maize reaps savings to non-Bt maize growers. Science. 2010;330:222–25. doi:https://doi.org/10.1126/science.1190242.
- Kathage J, Qaim M. Economic impacts and impact dynamics of Bt (Bacillus thuringiensis) cotton in India. Proc Natl Acad Sci USA. 2012;109:11652–56. doi:https://doi.org/10.1073/pnas.1203647109.
- Dively GP, Venugopal PD, Bean D, Whalen J, Holmstrom K, Kuhar TP, Doughty HB, Patton T, Cissel W, Hutchison WD. Regional pest suppression associated with widespread Bt maize adoption benefits vegetable growers. Proc Natl Acad Sci USA. 2018;115:3320–25. doi:https://doi.org/10.1073/pnas.1720692115.
- Tabashnik BE, Carrière Y. Surge in insect resistance to transgenic crops and prospects for sustainability. Nat Biotech. 2017;35:926–35. doi:https://doi.org/10.1038/nbt.3974.
- Tabashnik BE, Carrière Y. Global patterns of resistance to Bt crops highlighting pink bollworm in the United States, China, and India. J Econ Entomol. 2019;112:2513–23. doi:https://doi.org/10.1093/jee/toz173.
- Smith JL, Farhan Y, Schaafsma AW. Practical resistance of Ostrinia nubilalis (Lepidoptera: crambidae) to Cry1F Bacillus thuringiensis maize discovered in Nova Scotia. Can Sci Rep. 2019;9:18247. doi:https://doi.org/10.1038/s41598-019-54263-2.
- Ostlie KR, Hutchison WD, Hellmich RL, editors. Bt-Corn & European corn borer, Long term success through resistance management. St. Paul: North Central Region Extension Publication 602. University of Minnesota; 1997.
- Matten SR, Frederick RJ, Reynolds AH. United states environmental protection agency insect resistance management programs for plant-incorporated protectants and use of simulation modeling. In: Wozniak CA, McHughen A editors. Regulation of agricultural biotechnology: the United States and Canada. Springer; New York, USA: 2012. p. 175–267.
- Gould F. Sustainability of transgenic insecticidal cultivars: integrating pest genetics and ecology. Ann Rev Entomol. 1998;43:701–26. doi:https://doi.org/10.1146/annurev.ento.43.1.701.
- Tabashnik BE. Evolution of resistance to Bacillus thuringiensis. Ann Rev Entomol. 1994;39:47–79. doi:https://doi.org/10.1146/annurev.en.39.010194.000403.
- Alstad D, Andow DA. Managing the evolution of insect resistance to transgenic plants. Science. 1995;268:1894–96. doi:https://doi.org/10.1126/science.268.5219.1894.
- Bourguet D, Genissel A, Raymond M. Insecticide resistance and dominance levels. J Econ Entomol. 2000;93:1588–95. doi:https://doi.org/10.1603/0022-0493-93.6.1588.
- Metz TD, Roush RT, Tang JD, Shelton AM, Earle ED. Transgenic broccoli expressing a Bacillus thuringiensis insecticidal crystal protein: implications for pest resistance management strategies. Mol Breed. 1995;1:309–17. doi:https://doi.org/10.1007/BF01248408.
- Huang F, Buschman LL, Higgins RA, McGaughey WH. Inheritance of resistance to Bacillus thuringiensis toxin (Dipel ESTM) in European corn borer. Science. 1999;284:965–67. doi:https://doi.org/10.1126/science.284.5416.965.
- Huang F, Andow DA, Buschman LL. Success of the high-dose⁄refuge resistance management strategy after 15 years of Bt crop use in North America. Entom Exp App. 2011;140:1−16. https://doi.org/10.1111/j.1570-7458.2011.01138.x
- Roush RT. Two–toxin strategies for management of insecticidal transgenic crops: can pyramiding succeed where pesticide mixtures have not? Phil Trans R Soc Lond B. 1998;353:1777–86. doi:https://doi.org/10.1098/rstb.1998.0330.
- Zhao JZ, Cao J, Li Y, Collins HL, Roush RT, Earle ED, Shelton AM. Transgenic plants expressing two Bacillus thuringiensis toxins delay insect resistance evolution. Nat Biotech. 2003;21:1493–97. doi:https://doi.org/10.1038/nbt907.
- Carriere Y, Crickmore N, Tabashnik BE. Optimizing pyramided transgenic Bt crops for sustainable pest management. Nat Biotech. 2015;33:161–68. doi:https://doi.org/10.1038/nbt.3099.
- Carriere Y, Tabashnik BE. Reversing insect adaptation to transgenic insecticidal plants. Proc R Soc London B. 2001;268:1475–80. doi:https://doi.org/10.1098/rspb.2001.1689.
- Gould F, Cohen MB, Bentur JS, Kennedy GG, VanDuyn J. Impact of small fitness costs on pest adaptation to crop varieties with multiple toxins: a heuristic model. J Econ Entomol. 2006;99:2091–99. doi:https://doi.org/10.1093/jee/99.6.2091.
- Gassmann AJ, Carrière Y, Tabashnik BE. Fitness costs of insect resistance to Bacillus thuringiensis. Ann Rev Entomol. 2009;54:147–63. doi:https://doi.org/10.1146/annurev.ento.54.110807.090518.
- Ferré J, van Rie J. Biochemistry and genetics of insect resistance to Bacillus thuringiensis. Ann Rev Entomol. 2002;47:501–33. doi:https://doi.org/10.1146/annurev.ento.47.091201.145234.
- Andow DA. The risk of resistance evolution in insects to transgenic insecticidal crops. ICGEB Collect Biosaf Rev. 2008;4:142–99.
- Huang F, Leonard BR, Andow DA. Sugarcane borer resistance to transgenic Bacillus thuringiensis-maize. J Econ Entomol. 2007;100:164–71. https://doi.org/10.1603/0022-0493(2007)100[164:SBLCRT]2.0.CO;2.
- Tabashnik BE, Gassmann AJ, Crowder DW, Carriére Y. Insect resistance to Bt crops: evidence versus theory. Nat Biotech. 2008;26:199–202. doi:https://doi.org/10.1038/nbt1382.
- Tabashnik BE, Van Rensburg JBJ, Carrière Y. Field-evolved insect resistance to Bt crops: definition, theory, and data. J Econ Entomol. 2009;102:2011–25. doi:https://doi.org/10.1603/029.102.0601.
- Tabashnik BE, Brévault T, Carrière Y. Insect resistance to Bt crops: lessons from the first billion acres. Nat Biotech. 2013;31:510–21. doi:https://doi.org/10.1038/nbt.2597.
- Tabashnik BE, van Bensburg JBJ, Carrière Y. Field-evolved insect resistance to Bt crops: definition, theory, and data. J Econ Entomol. 2019;102:2011–25.
- National Research Council. Environmental effects of transgenic plants: the scope and adequacy of regulation. Vol. 320. Washington (DC): National Academy; 2002.
- Ghimire MN, Huang F, Leonard RB, Head GP, Yang Y. Susceptibility of Cry1Ab-susceptible and -resistant sugarcane borer to transgenic corn plants containing single or pyramided Bacillus thuringiensis genes. Crop Prot. 2011;30:74–81. doi:https://doi.org/10.1016/j.cropro.2010.09.008.
- Campagne P, Kruger M, Pasquet R, le Ru B. and van den Berg J. Dominant inheritance of field-evolved resistance to Bt Corn in Busseola fusca. PLoS ONE. 2013;8:e69675. doi:https://doi.org/10.1371/journal.pone.0069675.
- Farias JR, Andow DA, Horikoshi RJ, Sorgatto RJ, Dos Santos AC, Omoto C. Dominance of Cry1F resistance in Spodoptera frugiperda (Lepidoptera: noctuidae) on TC1507 Bt maize in Brazil. Pest Manag Sci. 2016;72:974–79.
- Leite NA, Mendes SM, Santos‐Amaya OF, Santos CA, Teixeira TP, Guedes RN, Pereira EJ. Rapid selection and characterization of Cry1F resistance in a Brazilian strain of fall armyworm. Entomol Exp Appl. 2016;158:236–47. doi:https://doi.org/10.1111/eea.12399.
- Santos-Amaya OF, Tavares CS, Monteiro HM, Teixeira TP, Guedes RN, Alves AP, Pereira EJ. Genetic basis of Cry1F resistance in two Brazilian populations of fall armyworm, Spodoptera frugiperda. Crop Prot. 2016;81:154–62. doi:https://doi.org/10.1016/j.cropro.2015.12.014.
- Niu Y, Meagher JRL, Yang F, Huang F. Susceptibility of field populations of the fall armyworm (lepidopteran: noctuidae) from florida and puerto rico to purified Cry1F protein and corn leaf tissue containing single and pyramided Bt genes. Florida Entomol. 2013;96:701–13.
- Camargo AM, Castañera P, Farinós GP, Huang F. Comparative analysis of the genetic basis of Cry1F resistance in two strains of Spodoptera frugiperda originated from Puerto Rico and Florida. J Invertebr Pathol. 2017;146:47–52. doi:https://doi.org/10.1016/j.jip.2017.03.013.
- Petzold-Maxwell JL, Cibils-Stewart X, French BW, Gassmann AJ. Adaptation by western corn rootworm (Coleoptera: chrysomelidae) to Bt maize: inheritance, fitness costs, and feeding preference. J Econ Entomol. 2012;105:1407–18. doi:https://doi.org/10.1603/EC11425.
- Ingber DA, Gassmann AJ. Inheritance and fitness costs of resistance to Cry3Bb1 corn by western corn rootworm (Coleoptera: chrysomelidae). J Econ Entomol. 2015;108:2421–32. doi:https://doi.org/10.1093/jee/tov199.
- Paolino AR, Gassmann AJ. Assessment of inheritance and fitness costs associated with field-evolved resistance to Cry3Bb1 maize by western corn rootworm. Toxins. 2017;9:159.
- Geisert RW, Ellersieck MR, Hibbard BE. Tolerance of eCry3.1Ab in reciprocal cross offspring of eCry3.1Ab-selected and control colonies of Diabrotica virgifera virgifera (Coleoptera: chrysomelidae). J Econ Entomol. 2016;109:815–20. doi:https://doi.org/10.1093/jee/tov335.
- Niu Y, Head GP, Price PA, Huang F. Inheritance and fitness costs of Cry1A.105 resistance in two strains of Spodoptera frugiperda (J.E. Smith). Crop Prot. 2018;110:29–235. doi:https://doi.org/10.1016/j.cropro.2017.06.022.
- Pereira EJG, Storer NP, Siegfried BD. Inheritance of Cry1F resistance in laboratory-selected European corn borer and its survival on transgenic corn expressing the Cry1F toxin. Bull Entomol Res. 2008;98:621–29. doi:https://doi.org/10.1017/S0007485308005920.
- Acharya B, Head G, Price P, Huang F. Inheritance and fitness costs of Cry2Ab2 resistance in Spodoptera frugiperda. J Invertebr Pathol. 2017;149:8–14. doi:https://doi.org/10.1016/j.jip.2017.06.014.
- Bernardi O, Bernardi D, Horikoshi RJ, Okuma DM, Miraldo LL, Fatoretto J, Medeiros FCL, Burd T, Omoto C. Selection and characterization of resistance to the Vip3Aa20 protein from Bacillus thuringiensis in Spodoptera frugiperda. Pest Manag Sci. 2016;72:1794–802. doi:https://doi.org/10.1002/ps.4223.
- Miraldo LL, Bernardi O, Horikoshi RJ, Berardi FSAAD, Omoto C. Functional dominance of different aged larvae of Bt-resistant Spodoptera frugiperda (Lepidoptera: noctuidae) on transgenic maize expressing Vip3Aa20 protein. Crop Prot. 2016;88:65–71.
- Yang F, Morsello S, Head GP, Huang F, Gilreath RT, Kerns DL. F2 screen, inheritance and cross-resistance of field-derived Vip3A resistance in Spodoptera frugiperda (Lepidoptera: noctuidae) collected from Louisiana, USA. Pest Manag Sci. 2018;74:1769–78. doi:https://doi.org/10.1002/ps.4805.
- Bird LJ, Akhurst RJ. Relative fitness of Cry1A-resistant and-susceptible Helicoverpa armigera (Lepidoptera: noctuidae) on conventional and transgenic cotton. J Econ Entomol. 2004;97:1699–709. doi:https://doi.org/10.1603/0022-0493-97.5.1699.
- Bird LJ, Akhurst RJ. Fitness of Cry1A-resistant and -susceptible Helicoverpa armigera (Lepidoptera: noctuidae) on transgenic cotton with reduced levels of Cry1Ac. J Econ Entomol. 2005;98:1311–19. doi:https://doi.org/10.1603/0022-0493-98.4.1311.
- Liu YB, Tabashnik BE, Dennehy TJ, Patin AL, Sims MA, Meyer SK, Carrière Y. Effects of Bt cotton and Cry1Ac toxin on survival and development of pink bollworm (Lepidoptera: gelechiidae). J Econ Entomol. 2001;94:1237–42. doi:https://doi.org/10.1603/0022-0493-94.5.1237.
- Wu X, Huang F, Leonard BR, Moore SH. Evaluation of transgenic Bacillus thuringiensis corn hybrids against Cry1Ab-susceptible and -resistant sugarcane borer (Lepidoptera: crambidae). J Econ Entomol. 2007;100:1880–86. doi:https://doi.org/10.1093/jee/100.6.1880.
- Wangila DS, Leonard BR, Bai Y, Head G, Huang F. Larval survival and plant injury of Cry1Ab-susceptible, -resistant, and -heterozygous genotypes of the sugarcane borer on transgenic corn containing single or pyramided Bt genes. Crop Prot. 2012;42:108–15. doi:https://doi.org/10.1016/j.cropro.2012.06.005.
- Horikoshi RJ, Bernardi D, Bernardi O, Malaquias JB, Okuma DM, Miraldo LL, Amaral FS, Omoto C. Effective dominance of resistance of Spodoptera frugiperda to Bt maize and cotton varieties: implications for resistance management. Sci Rep. 2016;6:34864. doi:https://doi.org/10.1038/srep34864.
- Santos-Amaya OF, Rodrigues JV, Souza TC, Tavares CS, Campos SO, Guedes RN, Pereira EJ. Resistance to dual-gene Bt maize in Spodoptera frugiperda: selection, inheritance, and cross-resistance to other transgenic events. Sci Rep. 2015;5:18243. doi:https://doi.org/10.1038/srep18243.
- Niu Y, Guo J, Head GP, Price PA, Huang F. Phenotypic performance of nine genotypes of Cry1A.105/Cry2Ab2-dual gene resistant fall armyworm on non-Bt and MON 89034 maize. Pest Manag Sci. 2019;75:2124–32. doi:https://doi.org/10.1002/ps.5331.
- Zhu C, Niu Y, Zhou Y, Guo J, Head GP, Price PA, Wen X, Huang F. Survival and effective dominance level of a Cry1A.105/Cry2Ab2-dual gene resistant population of Spodoptera frugiperda (J.E. Smith) on common pyramided Bt corn traits. Crop Prot. 2019;115:84–91. doi:https://doi.org/10.1016/j.cropro.2018.09.008.
- Bernardi D, Bernardi O, Horikoshi RJ, Salmeron E, Okuma DM, Farias JR, Do Nascimento ARB, Omoto C. Selection and characterization of Spodoptera frugiperda (Lepidoptera: noctuidae) resistance to MON89034 × TC1507 × NK603 maize technology. Crop Prot. 2017;94:64–68. doi:https://doi.org/10.1016/j.cropro.2016.11.026.
- Farias JR, Andow DA, Horikoshi RJ, Sorgatto RJ, Fresia P, Santos AC, Omoto C. Field-evolved resistance to Cry1F maize by Spodoptera frugiperda (Lepidoptera: noctuidae) in Brazil. Crop Prot. 2014;64:150–58. doi:https://doi.org/10.1016/j.cropro.2014.06.019.
- Tabashnik BE, Mota-Sanchez D, Whalon ME, Hollingworth RM, Carrière Y. Defining terms for proactive management of resistance to Bt crops and pesticides. J Econ Entomol. 2014;107:496–507. doi:https://doi.org/10.1603/EC13458.
- van Rensburg JBJ. First report of field resistance by the stem borer, Busseola fusca (Fuller) to Bt-transgenic maize. S Afr J Plant Soil. 2007;24:147–51. doi:https://doi.org/10.1080/02571862.2007.10634798.
- Storer NP, Babcock JM, Schlenz M, Meade T, Thompson GD, Bing JW, Huckaba RM. Discovery and characterization of field resistance to Bt maize: spodoptera frugiperda in Puerto Rico. J Econ Entomol. 2010;103:1031–38. doi:https://doi.org/10.1603/EC10040.
- Huang F, Qureshi JA, Meagher JRL, Reisig DD, Head GP, Andow DA, Ni X, Kerns D, Buntin GD, Niu Y, et al. Cry1F resistance in fall armyworm Spodoptera frugiperda: single gene versus pyramided Bt maize. PLoS ONE. 2014;9(11):e112958. doi:https://doi.org/10.1371/journal.pone.0112958.
- Gassmann AJ, Petzold-Maxwell JL, Keweshan RS, Dunbar MW. Field-evolved resistance to Bt maize by western corn rootworm. PLoS ONE. 2011;6(7):e22629. doi:https://doi.org/10.1371/journal.pone.0022629.
- Jakka SRK, Shrestha RB, Gassmann AJ. Broad-spectrum resistance to Bacillus thuringiensis toxins by western corn rootworm (Diabrotica virgifera virgifera). Sci Rep. 2016;6:27860. doi:https://doi.org/10.1038/srep27860.
- Huang F, Qureshi JA, Head GP, Price PA, Levy R, Yang F, Niu Y. Frequency of Bacillus thuringiensis Cry1A.105 resistance alleles in field populations of the fall armyworm, Spodoptera frugiperda, in Louisiana and Florida. Crop Prot. 2016;83:83–89. doi:https://doi.org/10.1016/j.cropro.2016.01.019.
- Grimi DA, Parody B, Ramos ML, Machado M, Ocampo F, Willse A, Martinelli S, Head G. Field-evolved resistance to Bt maize in sugarcane borer (Diatraea saccharalis) in Argentina. Pest Manag Sci. 2018;74:905–13. doi:https://doi.org/10.1002/ps.4783.
- Kruger M, Van Rensburg JBJ, Van den Berg J. No fitness costs associated with resistance of Busseola fusca (Lepidoptera: noctuidae) to genetically modified Bt maize. Crop Prot. 2014;55:1–6. doi:https://doi.org/10.1016/j.cropro.2013.09.004.
- Jakka SRK, Knight VR, Jurat-Fuentes JL. Fitness costs associated with field-evolved resistance to Bt maize in Spodoptera frugiperda (Lepidoptera: noctuidae). J Econ Entomol. 2014;107:342–51. doi:https://doi.org/10.1603/EC13326.
- Dangal V, Huang F. Fitness costs of Cry1F resistance in two populations of fall armyworm, Spodoptera frugiperda (J.E. Smith), collected from Puerto Rico and Florida. J Invertebr Pathol. 2015;127:81–86. doi:https://doi.org/10.1016/j.jip.2015.03.004.
- Hoffmann AM, French BW, Hellmich RL, Lauter N, Gassmann AJ. Fitness costs of resistance to Cry3Bb1 maize by western corn rootworm. J Appl Entomol. 2015;139:403–15. doi:https://doi.org/10.1111/jen.12209.
- Oswald KJ, French BW, Nielson C, Bagley M. Assessment of fitness costs in Cry3Bb1-resistant and susceptible western corn rootworm (Coleoptera: chrysomelidae) laboratory colonies. J Appl Entomol. 2012;136:730–40.
- Meihls LN, Higdon ML, Ellersieck MR, Tabashnik BE, Hibbard BE. Greenhouse-selected resistance to Cry3Bb1-producing corn in three western corn rootworm populations. PLoS ONE. 2012;7(12):e51055. doi:https://doi.org/10.1371/journal.pone.0051055.
- Geisert RW, Hibbard BE. Evaluation of potential fitness costs associated with eCry3.1Ab resistance in Diabrotica virgifera virgifera (Coleoptera: chrysomelidae). J Econ Entomol. 2016;109:1853–58. doi:https://doi.org/10.1093/jee/tow095.
- Petzold-Maxwell JL, Siegfried BD, Hellmich RL, Abel CA, Coates BS, Spencer TA, Horikoshi RJ, Gassmann AJ. Fitness costs associated with Cry1F resistance in the European corn borer. J Appl Entomol. 2017;141:7–79. doi:https://doi.org/10.1111/jen.12356.
- Chen X, Head GP, Kerns DL, Price P, Rice ME, Huang F, Gilreath RT, Yang F. Fitness costs of Vip3A resistance in Spodoptera frugiperda on different hosts. Pest Manage Sci. 2019;75:1074–80. doi:https://doi.org/10.1002/ps.5218.
- Akhurst RJ, James W, Bird LJ, Beard C. Resistance to the Cry1Ac δ-endotoxin of Bacillus thuringiensis in the cotton bollworm, Helicoverpa armigera (Lepidoptera: noctuidae). J Econ Entomol. 2003;96:1290–99. doi:https://doi.org/10.1603/0022-0493-96.4.1290.
- Liu L, Gao M, Yang S, Liu S, Wu Y. Resistance to Bacillus thuringiensis toxin Cry2Ab and survival on single‐toxin and pyramided cotton in cotton bollworm from China. Evol Appl. 2017;10:170–79. doi:https://doi.org/10.1111/eva.12438.
- Tetreau G, Wang R, Wang P. Fitness of Bt‐resistant cabbage loopers on Bt cotton plants. Plant Biotech J. 2017;15:1322–30. doi:https://doi.org/10.1111/pbi.12718.
- Naik VB, Kumbhare S, Kranthi S, Satija U, Kranthi KR. Field evolved-resistance of pink bollworm, Pectinophora gossypiella (Saunders) (Lepidoptera: gelechiidae)to transgenic Bt-cotton expressing Cry1Ac and Cry2Ab in India. Pest Manag Sci. 2018;74:2544–54.
- Huang F. Resistance of the fall armyworm, Spodoptera frugiperda (J. E. Smith), to transgenic Bacillus thuringiensis Cry1F corn in the Americas: lessons and implications for Bt corn IRM in China. Ins Sci. 2020. doi:https://doi.org/10.1111/1744-7917.12826.
- Leahy TC, Andow DA. Egg weight, fecundity, and longevity are increased by adult feeding in Ostrinia nubilalis (Lepidoptera: pyralidae). Ann Entomol Soc Am. 1994;87:342–49. doi:https://doi.org/10.1093/aesa/87.3.342.
- Zhao JZ, Cao J, Collins HL, Bates SL, Roush RT, Earle ED, Shelton AM. Concurrent use of transgenic plants expressing a single and two Bacillus thuringiensis genes speeds insect adaptation to pyramided plants. Proc Natl Acad Sci USA. 2005;102:8426–30. doi:https://doi.org/10.1073/pnas.0409324102.
- Kaur G, Guo J, Brown S, Head GP, Price PA, Paula-Moraes S, Ni X, Dimase M, Huang F. Field-evolved resistance of Helicoverpa zea (Boddie) to transgenic maize expressing pyramided Cry1A.105/Cry2Ab2 proteins in northeast Louisiana, the United States. J Invertebr Pathol. 2019;163:11–20. doi:https://doi.org/10.1016/j.jip.2019.02.007.
- Dively GP, Venugopal PD, Finkenbinder C. Field-evolved resistance in corn earworm to Cry proteins expressed by transgenic sweet corn. PLoS One. 2016;11(12):e0169115. doi:https://doi.org/10.1371/journal.pone.0169115.
- Reisig DD, Huseth AS, Bacheler JS, Aghaee MA, Braswell L, Burrack HJ, Flanders K, Greene JK, Herbert DA, Jacobson A, et al. Long-term empirical and observational evidence of practical Helicoverpa zea resistance to cotton with pyramided Bt toxins. J Econ Entomol. 2018;111:1824–33. doi:https://doi.org/10.1093/jee/toy106.
- Zhang L, Leonard BR, Chen M, Clark T, Konasale A, Huang F. Fitness and stability of Cry1Ab resistance in sugarcane borer, Diatraea saccharalis (F.). J Invertebr Pathol. 2014;117:26–32. doi:https://doi.org/10.1016/j.jip.2014.01.007.
- Huang F, Chen M, Gowda A, Clark TL, McNulty BC, Yang F, Niu Y. (2015). Identification, inheritance, and fitness costs of Cry2Ab2 resistance in a field-derived population of sugarcane borer, Diatraea saccharalis (F.) (Lepidoptera: Crambidae). J Invertebr Pathol 130:116 − 123.
- Brévaulta T, Heuberger S, Zhang M, Ellers-Kirk C, Ni X, Masson L, Li X, Tabashnik BE Carrière Y. (2013). Potential shortfall of pyramided transgenic cotton for insect resistance management. Proc Nat Acad Sci USA 110: 5806 − 5811
- Carrière Y, DeGain B, Unnithan GC, Harpold VS, Li X, Tabashnik BE. (2019). Seasonal Declines in Cry1Ac and Cry2Ab Concentration in Maturing Cotton Favor Faster Evolution of Resistance to Pyramided Bt Cotton in Helicoverpa zea (Lepidoptera: Noctuidae). J Econ Entomol 112: 2019, 2907–2914.
Appendix
Table A1. Data sources and/or calculations of the dominance levels (DFL) of 17 cases of major resistance to Bt plants*
’
Table A2. Index of fitness costs (IFC) of 20 cases of major resistance to Bt plants in eight target species.*