
Abstract
Many cities have set ambitious goals regarding the production of renewables within cities using advanced energy planning. The crux of those ambitious plans and goals is to put them into action using different legislative instruments, like a zoning plan. In this article, the experiences of an action research project with the aim to support local urban planners developing a zoning plan that creates favourable conditions for solar energy in Malmö, Sweden, are described. The Swedish planning process, national legal framework and financial conditions for PV systems are described first. Then, different scenarios for optimising the zoning plan were studied, using mainly the economic performance as a key indicator. The results showed that the detailed development plan does create both barriers and drivers for the implementation of PV systems in new buildings. At the same time, it also became clear that the legal and financial framework are equally decisive. By describing the lesson learnt, the method can be applied to other (inter)national contexts.
1. Introduction
Many cities in the world have set ambitious political goals for a sustainable future urban development (Affolderbach & Schulz, Citation2017; Brorström, Citation2015; Holmstedt, Brandt, & Robèrt, Citation2017; Klopp & Petretta, Citation2017; Phillis, Kouikoglou, & Verdugo, Citation2017). In several cities, advanced sustainable energy planning or Urban and Regional Integrated Energy Planning has been linking the set national goals to meet with the local frameworks in cities (Neves & Leal, Citation2010; Torabi Moghadam, Delmastro, Corgnati, & Lombardi, Citation2017; Yazdanie, Densing, & Wokaun, Citation2017). Most of these plans also contain the generation of renewable energy within the city boundaries. Bassett and Shandas (Citation2010) studied 20 Climate Action Plans of US cities and found that renewable energy was present in 65% of these plans. Davidson and Arman (Citation2014) also found that for many of the bigger Australian cities, renewable energy was mentioned in the environmental policy. On the building level, the ambition is to plan and construct buildings with a low environmental footprint and a significantly reduced energy use as well as an energy production on-site (European Parliament, Citation2010). This on-site energy production is often planned to come from photovoltaic (PV) panels or Solar Thermal (ST) panels.
In the case of Sweden, the current building regulations do however not include requirements on the installation of any solar system on buildings (Swedish National Board of Housing; Building and Planning, Citation2016b), neither does it allow municipal administrations to put such requirements on the real estate developers that are developing and constructing new buildings. This combination makes it hard to ensure that the local Urban Energy Plan and local political goals regarding the production of solar energy will be met and that future buildings end up with solar energy systems installed.
The International Energy Agency Solar Heating and Cooling Programme Task 51 solar energy in urban planning has focused on providing support to urban planners and authorities when it comes to the integration of solar energy into urban planning. In this research task, experts from Australia, Austria, Canada, China, Denmark, France, Germany, Italy, Norway, Sweden and Switzerland performed action research through case studies with local authorities to focus on the barriers and drivers for implementing solar energy in the urban planning process (Lobaccaro, Lindkvist, et al., Citation2017). Action research can be seen as a process that research is performed with other people rather than on them (Reason & Bradbury, Citation2008). The case studies from the involved Task 51 countries have showed that if the ambitious goals for on-site renewable energy are to be met, the goals have to be translated into workable regulations within the urban planning process.
The daily work of an urban planner consists in general of designing public spaces and buildings, as well as regulating land use and other relevant aspects in the development of new or existing urban districts. Often solar energy is not prioritised, neither do urban planners always have the competence to evaluate the implications of their design on the energy and economic performance of solar energy systems. Besides the competence level for assessing the possible performance of solar energy systems, most zoning plans specify the framework for building volumes and design of these building volumes but leave a certain degree of freedom to future real estate developers. These aspects definitely make it difficult to assess the economic and energy performance of PV or ST systems.
While much of the previous literature has focused on the energy and / or the financial performance of solar energy systems of buildings within cities, only a few studies have looked on the actual implementation of solar energy in the urban planning process; in other words where solar energy has been seen as a design parameter in the process. Lobaccaro, Carlucci, Croce, Paparella, and Finocchiaro (Citation2017) studied the solar accessibility in Trondheim and concluded that the solar potential could be increased with 25% if the urban morphology (building height, distance between buildings, etc.) and finishing materials are optimised. Kanters and Wall (Citation2014) studied the effects of the design decisions taken in the urban planning process on the potential of solar powered buildings in Sweden. Typical Swedish building blocks were simulated and what was varied was form, density, roof type and orientation and their influence on the theoretical potential for solar energy production on-site. Urban density was found to be most influential parameter. Another result was that even at low densities, a net zero energy multifamily building and its annual energy use for space heating and all electricity powered only with solar energy is hard to reach within the specific conditions. Lau, Lindberg, Johansson, Rasmussen, and Thorsson (Citation2017) looked at the solar energy potential in Dar es Salaam, Tanzania, where they analysed four different locations in the city. They found that high-rise buildings on two locations caused significant overshadowing of neighbouring buildings, thus reducing the solar irradiation on roofs and walls. Sarralde, Quinn, Wiesmann, and Steemers (Citation2015) studied different scenarios for increasing the renewable energy potential of different neighbourhoods in London. For the roof, ArcGIS was used to simulate the annual solar irradiation, while for the facades, they used Ecotect. The results of their study showed that by combining eight different variables of the urban form, the irradiation on the roof could be increased by 9%, and on the facades by up to 45%. Morganti, Salvati, Coch, and Cecere (Citation2017) analysed how the solar energy potential is defined by the urban morphology by analysing 14 different case studies in Rome and Barcelona. They found a high correlation between the solar energy potential and several design parameters.
In order to test how a real-world zoning plan can be created that sets favourable conditions for the implementation of solar energy, the city of Malmö, Sweden, started a project called solar neighbourhood. This project was followed by the authors through the performance of action research and it was also one of the case studies within the framework of IEA SHC Task 51. By following and participating in the planning process of the solar neighbourhood, it was possible to gain an insight into how urban planners – one of the key players in the planning process of building- work with solar energy.
2. Background
2.1. Swedish national planning framework and process
The local authorities in Sweden have a so-called planning monopoly, which means that only the municipality can decide how land is to be used within the municipality. In many bigger developments, the local authorities also own the majority of the land. In this case, the municipality has a dual role; one as planner and one as a juridical person selling a property.
First in the process, a municipal comprehensive plan (a plan without legally binding impacts) is developed. Then, a detailed development plan is ordered by the political administration of the city and is developed by the urban planning department of the municipality (Lundström, Fredriksson, & Witzell, Citation2013), where the use of land and water areas, built environment and construction works can be regulated (Swedish National Board of Housing, Building and Planning, Citation2016a). This is similar to a zoning plan as seen in other countries. The detailed development plan cannot be in conflict with the comprehensive plan.
Local authorities have to follow national legislative frameworks on for instance what to set in the detailed development plan. They are however free to design how new urban districts will look like. What a detailed development plan can or should contain is regulated in the Planning and Building Act (Swedish National Board of Housing, Building and Planning, Citation2016a).
Important for the future deployment of solar energy is that the municipality may determine ‘the extent of the built environment above and below the ground surface, the use of the buildings; and the proportion of apartments of various types in dwellings, and the size of the apartments’ (Swedish National Board of Housing, Building and Planning, Citation2016a). Also, the detailed development plan ‘must be designed with reasonable consideration to the existing built environment, property rights and real property units that could affect implementation of the plan’. This might influence future disputes about already existing solar energy systems where future property development might influence the production of such a system. It is important to note that, until now, it is unclear how to deal with such issues.
Another important factor is that the detailed development plan cannot prescribe the use of a specific technology, e.g. it cannot state that future real estate developers have to install PV/ST systems on their buildings. The law says that
it is not appropriate to bind or prohibit the use of certain technology or technical execution. There is always a technical development, so it is inappropriate to provide certain specific technical solutions that may prove to be unfavorable, unsuitable or hinder the desirable development. (Swedish National Board of Housing, Building and Planning, Citation2008)
The geometrical description of the detailed development plan is also important to discuss here, since this will also affect the local conditions for solar energy. The most important terms used in the detailed development plan to describe the geometry of buildings are: building height, ridge height, total building height and roof inclination. In Figure , an overview is given of these terms and their relation to each other (adapted after the report of the Swedish National Board of Housing, Building and Planning (Citation2014)).
Figure 1. Explanation of the most important geometrical terms.
The formal descriptions are as following (Swedish National Board of Housing, Building and Planning, Citation2014):
2.1.1. Building height
The height of the building should be considered as the intersection of the façade plane and a plan with a 45 degree incline inwards the building. The height of the building is the distance between the ground’s average level to the intersection of the façade plane and a 45 degree inclined plan. The height shall be calculated from the average level of the land adjacent to the building.
2.1.2. Ridge height
Defined as the highest part of the building’s roof structure, no matter what type of roof construction the building has. Parts that pop up above the roof do however not include chimneys and antennas.
2.1.3. Total height
Defined as the total height of the whole building, including chimneys, masts and lift shafts.
2.1.4. Roof inclination
The angle of the roof related to a horizontal plane.
The detailed development plan does not only show the planned buildings and their form, but also shows the different functions, which parts of the land that will not be built upon and the street network. Vegetation within the public space is designed by the transport planning department, while vegetation within the borders of the plots is up to the real estate developers to plan.
The described geometry in the detailed development plan could have a direct effect on the performance of future solar energy systems installed in the area. The orientation and roof inclination determine where solar energy systems could potentially be installed, but the other parameters –mostly of the surroundings- could have a great impact on the performance of a solar system due to the shading impact of buildings. The output of a solar system in its turn determines the financial performance of a system.
Once the detailed development plan is set, a geometrical framework is set. Real estate developers start developing the land, normally employing architects to plan the design of the buildings more in detail. Even though the urban planners do not design buildings in detail, it will affect the possibilities for implementing solar energy in buildings in cities. The design and specifications in the detailed development plan will affect potential shading on PV/ST panels, the place and inclination of PV/ST panels on roofs and facades, the ratio between energy use and on-site production, etc.
2.2. Swedish national legal framework
The current Swedish building regulations put requirements on the maximum amount of energy that can be used per floor area and year. This includes space heating, cooling (if needed), Domestic Hot Water (DHW), and common electricity. Most of the energy produced by PV or ST can be deducted from the calculated amount of the building’s energy need.
A building permit is normally required when installing solar energy systems on either new or existing buildings. Some municipalities have exceptions if it is a villa with one floor and where the ST/PV follows the roof inclination. Normally, for existing buildings, the rule is that a building permit is required when a change is planned in the building material of the roof and / or façade when the building is located in an area with a detailed development plan. This process is described in the Planning and Building Act. The application for a building permit is normally filed by the owner of a property, with or without help from external consultants. The local municipality is the administrative body that either grants or denies a building permit. If the building permit office is uncertain about a certain element in the application –for instance in judging how ‘sensitive’ the architecture of a building is- they might contact a local/regional museum which could have a so-called ‘city heritage consultant’ employed or they could contact an independent heritage consultant for a statement. This statement is not legally binding, it is up to the municipality to take the final decisions. Common praxis is however that the decision of the municipality follows the statement by the heritage consultant. If the building permit is granted and no external actor files a complaint, the installation of the solar energy system might start. If it is not granted, the applicants can appeal at the County’s Administrative Board, the Land and Environment Court and finally Sweden’s highest land and environment court. The same procedure is followed for external actors.
2.3. Local political goals in Malmö
The city of Malmö has set ambitious goals when it comes to an environmentally-friendly and energy-efficient urban development. One of the goals is that the whole city of Malmö shall be powered by renewable energy in 2030.
In the case of Hyllie, currently Malmö’s largest urban development, the city has determined that it should be a designated pilot project with the goal to become the Öresund-region’s most climate-smart neighbourhood and to meet the energy goals 10 years earlier than the rest of the city.
Historically, the city of Malmö has worked with different instruments collaboratively towards sustainability goals. One of such examples was the Constructive Dialogue, where different stakeholders were involved to achieve a more smooth planning process in order to develop sustainable cities (Smedby & Neij, Citation2013). Having an early commitment of the real estate developers helped in one case of Malmö to develop a sustainability agreement between the city and real estate developers, although the municipality did lack the opportunity to enforce the agreement.
In 2011, the city of Malmö, the local utility company and the regional partners that provide the water supply and waste management, signed a climate contract for Hyllie (city of Malmö, Eon, & VASyd, Citation2011). In this contract, the three partners envision Hyllie to be supplied by 100% renewable or reused energy by 2020.
Parallel to the climate-contract, the cities of Lund and Malmö and Lund University collaborated within the framework of Miljöbyggprogram SYD / MBP South as a means of stimulating the constructing of more energy efficient buildings (City of Malmö, City of Lund, & Lund University, Citation2012). The programme was followed in those cases where the municipality owned the land. Within this programme, the focus was on energy, moisture safety, indoor environment, ecological diversity, acoustics and noise. In an evaluation described by Smedby (Citation2015), it was shown that those real estate developers that were part of the programme have set slightly more ambitious levels than those not part of the programme. However, in 2015, the Swedish government decided to stop the possibility of selling the land with preconditions.
From then, the MBP South and other initiatives were transformed to programmes like ‘Miljöprogram Hyllie’ (Environmental Programme Hyllie). This programme is focusing on many aspects, amongst others the production of on-site renewable energy and is based on a voluntary engagement.
2.4. Techno-economic conditions
For the production of on-site renewable energy, PV systems are often identified as a favourable source. To increase the use of PV systems, not only should be focussed on the amount of energy that is produced by PV systems, but also on the economic performance of such systems.
Examples in literature that looked at both the energy performance of a renewable energy system and the economic performance are many (Esen, Inalli, & Esen, Citation2006, Citation2007; Lin & Haussener, Citation2017; Thaker, Olufemi Oni, & Kumar, Citation2017). Li and Liu (Citation2018) specified that the economic merits of a PV system mainly are determined by the system cost (including labour and maintenance), and the generated electricity. They state that investors always expect a short cost payback period (CPP). The authors define the CPP as the total expenditure cost divided by the annual revenue from the produced electricity energy. Poppi, Sommerfeldt, Bales, Madani, and Lundqvist (Citation2018) performed a techno-economic review of solar heat pump systems. In their review of papers, they found that often used economic performance indicators are the Life Cycle Costs (LCC), Net Present Value (NPV) and Payback Time. While the LCC and NPV might provide a more accurate feedback regarding the economic performance, the payback time is still often used because of its simplicity. Another well-used method to explore the cost-effectiveness of power generation systems is the calculation of the Levelized Cost of Energy (Bieri, Winter, Tay, Chua, & Reindl, Citation2017; Comello & Reichelstein, Citation2017; Patil et al., Citation2017).
2.4.1. Economic conditions for PV in Sweden
In the solar neighbourhood Malmö, only the installation of PV systems is considered. This is mainly due to the fact that the DHW and space heating will be supplied by a district heating system. Besides the political planning framework, both on national and local level, it is important to understand the financial conditions for the installation and functioning of solar energy systems. The relevant terms and concepts that describe the present financial framework for PV systems in Sweden, are defined in Table .
Table 1. Terms used to describe the financial framework for PV Systems in Sweden.
The tax reduction comes with some additional rules; the client should (a) be an annual net-consumer (meaning that seen over the year, more electricity should be used than is fed-in), (b) not feed-in more than 30 000 kWh over a year, (c) have the same connection point for electricity, and (d) have a fuse that does not exceed 100 amperes. This means that the tax reduction will mainly benefit owners with small systems.
In Sweden, electricity is traded on the NordPool market, which connects the Nordic and Baltic regions, and the UK. The NordPool spotprice depends on the supply and demand of the market, which in its turn depends on the weather conditions, if power plants are running, etc. This spotprice is set hourly and varies over the year. Figure shows the years 2013, 2014, 2015 and 2016.
Figure 2. Spotprice over the year.
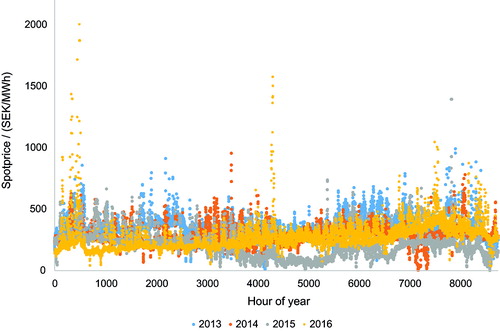
What can be seen in Figure is that the variation of the spotprice over the year is rather high, with a trend of somewhat higher prices during the end of October – November (hour of year 7000–8000) and some spikes around January (2013 and 2016) and November (2013–2016).
Figure 3. Box plot of spotprices in the years 2013–2016.
If plotted as a box plot, the spotprice seen over the four years (Figure ), it can be concluded that the average differs significantly over the years, with a low in 2015. However, if we look at the distribution we can see that the variation over the year has increased, with mainly an increase in higher prices. It can also be noted that the minimum spotprice almost reached 0 SEK.
Figure 4. Action Research Cycle of the solar neighbourhood project (adapted from (Koshy, Waterman, & Koshy, Citation2010)).
The feed-in tariff depends on the willingness of energy companies to buy the electricity that is fed into the grid. They could set additional rules on the feeding into the grid. For instance, some energy companies only buy from clients that are within their own grid.
In 2016, 48% of all Swedish households lived in multifamily houses, 45% in villas and the rest in other housing, like student housing or elderly housing (Statistics Sweden, Citation2016). Considering the ownership of real estate in Sweden and the possibility to install PV systems on real estate, four main players can be distinguished:
3. Method
3.1. Process and group members
The goal of this research -creating favourable conditions in the detailed development plan for solar energy- required a mixed-method approach. Therefore, a participatory action research approach was chosen. In participatory action research, the process evolves in circles (Figure ), making it an iterative process in order to foster a deeper understanding of a given situation (Hopkins, Citation1985). In the illustration of the generic action research process (Figure ), important steps in the research process of this study have been added.
In this case, a collaboration was formed between Lund University and the city of Malmö, in particular with the urban planning department. Meetings were held at the city hall in Malmö where the progress of the process was discussed. With the goal to create favourable conditions for solar energy, different issues came up that were discussed and needed to be analysed as input data for further discussion in the process.
The group that participated from the municipality were urban planners working at the urban planning department, an energy expert, one person from the real estate department and occasionally an expert from the building permit office. The urban planners developed the actual detailed development plan, assisted by the others. The real estate office was involved because it is the department that is owning the land that is going to be developed and that will be sold to interested real estate developers. Except for the energy expert, the involved experts from the municipality did not have a special competence on solar energy. The group in this phase did not include real estate developers, associations, and end-users. This is mainly due to the fact that the detailed development plan is designed before potential real estate developers are contacted. However, there were considered to be key players in the process and are therefore contacted after this phase.
In the very beginning of the planning design process of the solar neighbourhood in Malmö, a first detailed development plan was designed by the involved urban planners. This first detailed development plan contained a 2D drawing stating the footprint of the building, written specifications of the geometrical framework (like roof angle, amount of floors, etc.), functions, etc. The size of the footprint of the buildings, the allowed maximum volume and its location was considered to be a static parameter. The urban planners did in this case not optimise the building form according to their potential best energy performance but the form was optimised according to other parameters like the architectural potential of the location and other constraints.
This first plan was assessed for its solar potential by conducting simulation. After reflecting on the possibilities for solar energy in the context of the detailed development plan, especially on roofs, it was decided to perform a simple techno-economic comparison (a parametric study) of the roofscape of the buildings. The question here was which roof inclination and orientation is beneficial for the implementation of PV panels, but still providing some flexibility to the future real estate developers. In order to provide a meaningful answer to this issue, the financial performance of PV systems at several roof inclinations was looked at and is described in Section 3.2.
It should however be kept in mind that the focus of the solar neighbourhood was not to develop buildings that would produce as much solar energy as possible, but that simple energy and economic performance simulations would provide a range of solutions in which the plan could evolve, keeping also other aspects, like architectural quality, in mind.
3.2. Solar potential study of the first detailed development plan
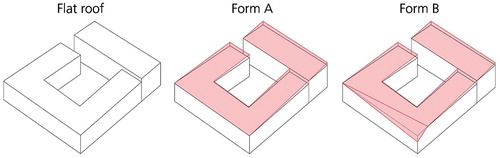
The detailed development plan as designed by the urban planners was modelled in Sketchup (Trimble inc, Citation2016). Then, the model was imported into Rhino and Grasshopper (McNeel & Associates, Citation2016). Three variations were set up Figure :
| (1) | Buildings were considered to have a flat roof with a PV system with 40 degrees inclination and 1.5 m row distance. The PV panels were scripted within Grasshopper and considered to have a three string setup equal to a previous study by (Kanters & Davidsson, Citation2014). | ||||
| (2) | Buildings were considered to have a slightly inclined roof. Then, PV panels were considered to follow the roof inclination with either rectangular PV panels (b1) or more square panels (b2). | ||||
| (3) | Buildings were considered to have inclined roofs and the façade was cut to potentially have a higher output on the inclined façade. This is all possible within the detailed development plan since that plan only set maximum boundaries for the built geometry and future building owners are thus obliged to stay within these boundaries. Then, PV panels were considered to follow the roof inclination with either rectangular PV panels (c1) or more square panels (c2). | ||||
Figure 5. Building variations 1, 2 and 3 (from left to right).
The annual output of the PV system was simulated for every building in the detailed development plan. However, in the results section, only the left bottom corner building is shown. Also, it was calculated what the size of the system would be.
3.3. Parametric study
To develop the regulations specified in the first detailed development plan into a better set of regulations in the second detailed development plan, a simple techno-economic parametric study had to be performed. In this study, the economic performance parameter that was studied was the payback time. In this section, the method for analysing the financial performance of a PV system is described in several steps.
Step 1
A PV panel was simulated with EnergyPlus’s PV component in the Grasshopper environment (McNeel & Associates, Citation2016). The weather data of Copenhagen (in the EPW format) was used in the simulations. A scene was modelled without any object that could cause shading. Then, an annual simulation was run with hourly time steps as output of the system. A system efficiency of 15% was taken, to resemble a monocrystalline module. Both the inclination and the orientation of the panel was varied; the inclination was varied from 0° to 90° in steps of 10°, the orientation was varied from −180° to 180° (where 0 is South) with steps of 10 degrees.
Step 2
The hourly revenue of the PV panel was calculated for three scenarios –(a) private owners, (b) non-commercial owners of multifamily housing and (c) commercial owners of multifamily housing. Historical electricity prices, instead of predicted future electricity prices, were considered here to understand how the actual electricity prices influence the feasibility.
The three scenarios that were used
| (1) | The private owner with their own roof that feeds in the grid with a small system. In this scenario, the owner gets the following compensation for every kWh fed into the grid: (a) the tax reduction and (b) feed-in Tariff. It was considered that private owners would not apply to obtain electricity certificates partly because it will mean an administrative burden. | ||||
| (2) | The housing corporation with a medium-scale system (delivering more than 30 000 kWh a year but with an installed effect lower than 250 kWp) that feeds into the grid. In this scenario, the owners get: (a) the feed-in tariff and (b) revenue of the electricity certificates. | ||||
| (3) | A private owner or housing corporation that uses the produced electricity directly into the building. For every kWh used directly in the building, the owner saves buying energy from the energy provider. | ||||
Since electricity prices vary over the year but are also different for every year, data from the years 2013, 2014 and 2015 were used (Nordpool, Citation2016). Several utility companies were contacted to analyse for how much they would buy electricity from PV systems.
Step 3:
The hourly revenue was summed up for the years 2013, 2014, 2015. The investment costs for the monocrystalline PV system was set at 15 000 SEK / kWp leading to a cost of 2 250 SEK / m2. This could be seen as a standard price for a PV system (Lindahl, Citation2014). This capital expenditure (CAPEX) includes both the panels and the installation, since Swedish data was available for that. The Operating Expense (OPEX) was considered to be 0 in order to calculate the payback time (operation and maintenance expenditure per year). The Swedish government could provide a subsidy for the investment costs of a PV system but this has not been taken into account in this study. With this data, the payback time of the system was calculated. For this study, a payback time of 25 years was considered to be the threshold, since the warranty of standard modules often is 25 years.
4. Results
In this section, the results of the different parts as described in the method section will be presented.
4.1. Results of the solar potential study
The results of the potential study did not only show how much energy could be produced, but also gave an impression on how many panels could be fit on the roof and façade.
Figure shows the different alternatives and the placement of panels with different dimensions. In red are the panels that were smaller than the dimensions of the original PVs and indicate that this could be dummies (elements looking like PV panels). Figure shows the energy output of the alternatives.
Figure 6. The different alternatives.
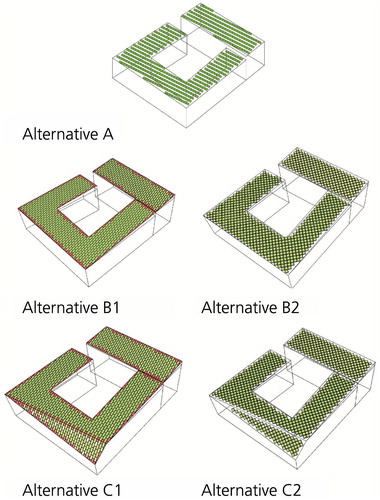
Figure 7. The total annual produced energy for the different alternatives.
The results show that alternative B1 could produce the highest amount of energy. Cutting the façade of the building block (c) to optimise that surface for maximum irradiation did not result in a higher energy production than alternative B1. It should also be noted that alternative C2 has a high impact on the architecture of the building as well as on the available floor area with a reasonable floor height.
4.2. Results of the parametric study
The results of the parametric study are presented here per step.
Step 1: Hourly production
The hourly production was simulated for every inclination and orientation. The results of the cumulative annual values are shown in Table .
Table 2. Annual production through cumulative hourly production values.
It can be seen that the maximum annual production (171 kWh/m2) is reached when the panel is orientated towards South (0°) and a 40° inclination. The minimum annual production (51 kWh/m2) is reached on a façade (90°) towards North.
Step 2 & 3
Here, the results of the three scenarios described in 2.2 are presented.
The results of the simulations and calculations for the first scenario -the private owner with their own roof that feeds in the grid with a small system- are shown in Table for the three consecutive years 2013, 2014 and 2015. The table shows the payback times of the PV system.
Table 3. Scenario 1: Payback times (in green, a payback time lower than 25 years).
Table shows that for the three years, panels with a very low inclination (up to 20/30°) would lead to a payback time lower than 25 years for all directions. When it comes to facades (surfaces with a 90° inclination), orientations within −60° to +70° (2013), −70° to +80° (2014) and −30° to 30° (2015) resulted in payback times lower than 25 year.
The second scenario was the housing corporation with a medium-scale system. In Table , the results are presented.
Table 4. Scenario 2: Payback times (in green, a payback time lower than 25 years).
Table shows that none of the configurations had a lower payback time than 25 years.
The third scenario was a private owner or housing corporation that uses the produced electricity directly into the building. Results are shown in Table .
Table 5. Scenario 3: Payback times (in green, a payback time lower than 25 years).
Table shows that for the three years and the fixed price, panels with a very low inclination (up to 20/30°) would lead to a payback time lower than 25 years for all directions. When it comes to facades (surfaces with a 90° inclination), orientations within −60° to +70° (2013), −40° to +40° (2014), −20° to 20° (2015), and −80 to 80 (fixed rate) resulted in payback times lower than 25 year.
It is clear that the three scenarios differ significantly. While scenario 1 and 3 provide a rather similar pattern, scenario 2 is very different since none of the setups returned a lower payback time than 25 years.
Combining scenario 1 and 3, roughly three sets of combinations can be identified where the payback time is lower than 25 years. The first set is the inclination range 0°–20° with an orientation of −180° to 170°, the second set is the inclination range 0°–50° with an orientation of −120° to 120° and the third set is the inclination range 0°−90° with an orientation of −70° to 80°. This implicates that for scenario 1 and 3, and for those parts of the building envelope facing mainly towards south, both the façade and roof are evaluated to be suitable to install a PV system. East, west and north-facing facades got however excluded.
For all three scenarios and years, it is possible to plot the irradiation on the panels against the payback time in years (Figure . Sc means scenario. ‘13−’15 means 2013–2015).
Figure 8. Annual irradiation level against payback time (Sc means scenario. ‘13−’15 means 2013–2015).
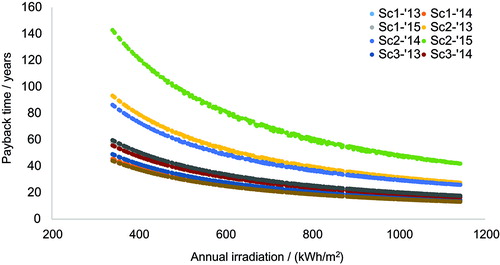
For Figure , all the annual irradiation analyses of all combinations (all inclinations and orientation possibilities) were plotted against the payback time. This resulted that also surfaces receiving a low annual irradiation (north facing façade) are included in the data.
It can be seen in Figure that there is a power function relation between the two units here with a high R 2-value. In order to analyse the results better, a zoom-in of Figure can be seen in Figure . The graph shows that the scenario with the flat rate always provides the lowest payback time, followed by the Scenario 1 with the 2014 electricity prices, Scenario 3 with the 2013 electricity prices, Scenario 1 with the 2013 electricity prices, Scenario 3 with the 2014 electricity prices, Scenario 1 with the 2015 electricity prices, and Scenario 3 with the 2015 electricity prices.
Figure 9. Annual irradiation level against payback time (zoom-in).
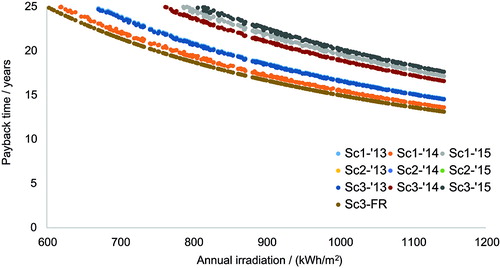
Figures and show that for the local conditions in Malmö, payback times under 15 years are possible today. The correlation between the irradiation level and the payback time makes it easier to assess a simple economic performance like the payback time when simulating a 3D model.
4.3. Advancement of the detailed development plan
The first detailed development plan can be seen in Figure .
Figure 10. Extract of the detailed development plan, September 21st, 2016 (© city of Malmö).
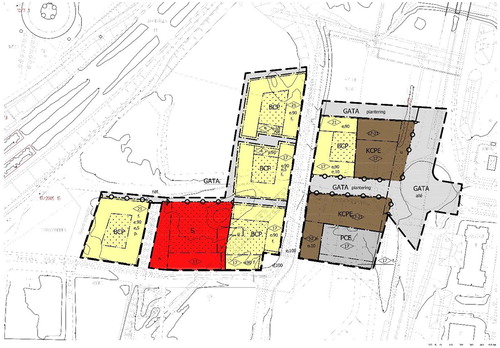
In this first version of the detailed development, which was never sent out for approval by the politicians, the following parts were specifically written affecting solar energy possibilities: ‘Roof materials shall consist of at least xx % PV panels’, ‘Technical systems for the production of local energy production are allowed over and above the building and total height’,
The roof shall be designed as a coherent plane with an inclination towards the south in such a way that the inclination from the horizontal plane is at least xx degrees and no more than xx degrees from the south.
Although this was a first version of the detailed development plan, the urban planners had the intention to set the range of the roof inclination to be rather small; i.e. 35°−45°. The most important specification however is the one on the roof material. In a detailed development plan, it is possible to specify which materials should be used in buildings. If PV panels are considered to be a building material –integrated as part of the building envelope- then this specification is technically possible. However, there is no possibility for the urban planners to demand that they shall be plugged in and used.
In the meetings with the whole group of involved actors, there were mainly two comments on the plan:
| • | By setting a small range for the roof inclination, the buildings would start to look very similar and is probably not the city scape that the municipality is looking for. | ||||
| • | By setting a high percentage of PV as roof material, it might be hard to find a real estate developer that would be interested in buying the land under those conditions. | ||||
The parametric was a direct result of the discussion what a good range for the roof inclination and orientation should be.
In the next phase, the urban planners worked towards a second version of the detailed development plan. The base geometry did not really change during this phase, except that it now consists of 6 buildings instead of 7. However, the new specifications in the detailed development plan considering the solar energy potential changed and were now specified as:
| • | Minimum and maximum roof inclination (between 7° and 45°) | ||||
| • | Technical systems for local energy production shall be architecturally integrated and part of the building’s roof | ||||
By providing a larger range for the roof inclination and by not setting requirements on the roof material, it was considered to be a more generous detailed development plan for potential real estate developers. It was also thought to generate a larger diversity of architectural quality.
One issue however that remains with the roof inclination is the effect of the angle and the additional height that is created due to that inclination; as is shown as the ‘X’ in Figure . If the roof inclination is set between 7° and −45°, it will mean that with a building width of 12 metres, an additional height of between 1.5 metre and 12 metres is created. This extra space cannot be used as additional floor or for selling.
5. Discussion and conclusions
In this project, the aim was to translate the Urban Integrated Energy Planning of the city of Malmö into a detailed development plan that, together with the national building regulations, created a favourable framework for the implementation of solar energy production on future buildings.
The detailed development plan is under the Swedish conditions not only dependent on the design by the urban planners but also on the regulated freedom set in the specifications of the detailed development plan. Therefore, implementing solar energy in urban planning is not a straightforward task. First of all, solar energy is only one of many parameters that needs to be taken into account during the planning process. Many parameters are defined by other actors than the urban planners. As an example, the density of an urban district is often set by politicians and is affecting the solar potential significantly. Also, urban planners do not always have the required knowledge or time to analyse how both the ground design of the buildings and the specifications of the detailed development plan affect the solar potential. It is very seldom that urban planners assess the suitability of the buildings for solar energy production during their urban design process.
A clear conclusion that can be drawn from this study is the influence of the legal framework on the feasibility of installing PV. As the results of the different scenarios have made clear, it might be decisive if a PV system gets installed just because of the fact how electricity could be fed into the grid or if the building owner could get a tax reduction. It should also be noted that those legal conditions might change within a short notice, thereby increasing the risk for the investment in PV. For instance, the height of subsidies for PV system has changed over the course of the last years in Sweden. This has obviously a direct impact on the economic performance of the PV system.
Besides the political framework –both legislative and financial framework-, the climatic conditions obviously affect the possibilities for implementing solar energy. Comparing the climatic conditions –e.g. the annual irradiation on a horizontal plane- of Malmö with different European cities, differences are Brussels, Belgium (−2%), Paris, France (+14%), Vienna, Austria (+18%), Rome, Italy (+52%), Zurich, Switzerland (+13%) and Bolzano, Italy (+23%) (Joint Research Centre, Citation2012). This quick comparison shows that for different geographical locations, different legislation might work better than in other places.
Parallel to the first conclusion, the second conclusion is that the economic feasibility is very dependent on the ownership of a particular building. In the Swedish context, a significant part of buildings are developed by a real estate developer and a construction company. Shortly after completion, the building is sold. Very seldom, the long term owner of the building is also the developing party. This means that real estate developers only will have interest in implementing solar energy system if this directly affects the property value. While this might be true for commercial buildings (especially when assessing a building with a building assessment label), it is still unclear if this is true for residential buildings. That means that often, real estate developers experience the financial risk to be too high to implement solar energy systems, since they do not know if the future owners of the building are willing to pay more for a building with an installed solar energy system, even though from an energy perspective, it might be positive.
The municipal administration is an important link between the government on the national level and real estate developers on the building level. Municipal administrations are free to design how their city will be developed, but are limited to act within the national legislative framework. The real estate developers also have to comply with the national building regulations. Decisions taken on a higher level, the governmental level, therefore have a large impact on the freedom for the local administrations, as well as on real estate developers. On the other hand, the municipality is also dependent on the housing market and the willingness of real estate developers to buy the land with the set detailed development plan. If the specifications set in that plan are experienced to be too strict, it might be hard to attract potential real estate developers. This is especially crucial in the case of smaller municipalities, where an interest of real estate developers might be naturally lower than in bigger cities. In this project, an effort was also made to distribute as much information as possible regarding the techno-economic potential of a solar energy system to potential real estate developers. By doing so, they should have all the needed information already in a very early stage to make a decision on solar energy, mainly on how much electricity PV panels could deliver and how much the upfront costs will be.
This study also shows that the detailed development plan is an important, but often overlooked, instrument to indirectly create the framework for solar energy in buildings within the urban context. It is a delicate balance between setting requirements on real estate developers within the legal possibilities and still open up for a certain freedom in form and aesthetics for future real estate developers.
The experiences as described in this study shows how the local municipality of Malmö has tried to implement parts of their energy planning into a specific area of the city, while still complying with all the national regulations. If the outcome of this pilot project is successful, the municipality might consider to implement the focus on adding detailed descriptions for solar energy for all detailed development plans.
Since urban development processes are normally long process, it might take time to evaluate the process and the goals of the project. The process of working with the detailed development plan to increase the implementation of solar energy has proven to be difficult, since the possibilities to actually require the installation of PV systems are limited. This means that rather than using the stick approach (putting requirements on real estate developers), a carrot approach (providing support and having a dialogue) might turn out to be more beneficial (Rissman, Kohl, & Wardropper, Citation2017).
Since the urban planning process differs by country, it is important to stress the lesson learnt from this case study rather than for instance the specific descriptions in the detailed development plan. It is important to understand and show how the political goals for renewable energy production and the intentions and goals stated in the energy plan need to be translated into the urban planning process, since the current connection between those processes is rather unclear.
Disclosure statement
No potential conflict of interest was reported by the authors.
Funding
This work was supported by the Energimyndigheten [grant number 39589-1].
References
- Affolderbach, J. , & Schulz, C . (2017). Positioning Vancouver through urban sustainability strategies? The Greenest City 2020 action plan. Journal of Cleaner Production , 164 , 676–685. doi:10.1016/j.jclepro.2017.06.234 10.1016/j.jclepro.2017.06.234
- Bassett, E. , & Shandas, V. (2010). Innovation and climate action planning. Journal of the American Planning Association , 76 (4), 435–450. doi:10.1080/01944363.2010.509703
- Bieri, M. , Winter, K. , Tay, S. , Chua, A. , & Reindl, T . (2017). An irradiance-neutral view on the competitiveness of life-cycle cost of PV rooftop systems across cities. Energy Procedia , 130 (Supplement C), 122–129. doi:10.1016/j.egypro.2017.09.408
- Brorström, S. (2015). Strategizing sustainability: The case of River City, Gothenburg. Cities , 42 , 25–30. doi:10.1016/j.cities.2014.08.005
- City of Malmö, City of Lund, & Lund University . (2012). Miljöbyggprogram SYD. Version 2. Retrieved from http://www.miljobyggprogramsyd.se/Global/MiljöbyggprogramSYDversion220120903rev20121211.pdf
- City of Malmö, Eon, & VASyd . (2011). Climate smart Hyllie – Testing the solutions of tomorrow . Retrieved from http://malmo.se/download/18.5f3af0e314e7254d70e44bbf/1491299882385/Klimatkontrakt_broschyr_ENG_2015final.pdf
- Comello, S. , & Reichelstein, S . (2017). Cost competitiveness of residential solar PV: The impact of net metering restrictions. Renewable and Sustainable Energy Reviews , 75 (Supplement C), 46–57. doi:10.1016/j.rser.2016.10.050 10.1016/j.rser.2016.10.050
- Davidson, K. , & Arman, M. (2014). Planning for sustainability: An assessment of recent metropolitan planning strategies and urban policy in Australia. Australian Planner , 51 (4), 296–306. doi:10.1080/07293682.2013.877508
- Esen, H. , Inalli, M. , & Esen, M . (2006). Technoeconomic appraisal of a ground source heat pump system for a heating season in eastern Turkey. Energy Conversion and Management , 47 (9–10), 1281–1297. doi:10.1016/j.enconman.2005.06.024
- Esen, H. , Inalli, M. , & Esen, M . (2007). A techno-economic comparison of ground-coupled and air-coupled heat pump system for space cooling. Building and Environment , 42 (5), 1955–1965. doi:10.1016/j.buildenv.2006.04.007
- European Parliament . (2010). Directive 2010/31/EU of the European Parliament and of the Council of 19 May 2010 on the energy performance of buildings .
- Holmstedt, L. , Brandt, N. , & Robèrt, K.-H. (2017). Can Stockholm Royal Seaport be part of the puzzle towards global sustainability? – From local to global sustainability using the same set of criteria. Journal of Cleaner Production , 140 , 72–80. doi:10.1016/j.jclepro.2016.07.019
- Lindahl, J . (2014). National survey report of PV power applications in SWEDEN 2014 .
- Joint Research Centre . (2012). Photovoltaic geographical information system (PVGIS). Retrieved November 17, 2017, from http://re.jrc.ec.europa.eu/pvgis/index.htm
- Kanters, J. , & Davidsson, H . (2014). Mutual shading of PV modules on flat roofs: A parametric study. In Energy procedia (Vol. 57, pp. 1706–1715). Elsevier Ltd.
- Kanters, J. , & Wall, M. (2014). The impact of urban design decisions on net zero energy solar buildings in Sweden. Urban, Planning and Transport Research , 2 (1), 312–332. doi:10.1080/21650020.2014.939297
- Klopp, J. M. , & Petretta, D. L . (2017). The urban sustainable development goal: Indicators, complexity and the politics of measuring cities. Cities , 63 , 92–97. doi:10.1016/j.cities.2016.12.019
- Koshy, E. , Waterman, H. , & Koshy, V . (2010). Action research in healthcare . Sage.
- Lau, K. K.-L. , Lindberg, F. , Johansson, E. , Rasmussen, M. I. , & Thorsson, S . (2017). Investigating solar energy potential in tropical urban environment: A case study of Dar es Salaam, Tanzania. Sustainable Cities and Society , 30 , 118–127. doi:10.1016/j.scs.2017.01.010
- Li, Y. , & Liu, C . (2018). Techno-economic analysis for constructing solar photovoltaic projects on building envelopes. Building and Environment , 127 , 37–46. doi: 10.1016/j.buildenv.2017.10.014
- Lin, M. , & Haussener, S . (2017). Techno-economic modeling and optimization of solar-driven high-temperature electrolysis systems. Solar Energy , 155 (Supplement C), 1389–1402. doi:10.1016/j.solener.2017.07.077
- Lobaccaro, G. , Carlucci, S. , Croce, S. , Paparella, R. , & Finocchiaro, L . (2017). Boosting solar accessibility and potential of urban districts in the Nordic climate: A case study in Trondheim. Solar Energy , 149 , 347–369. doi:10.1016/j.solener.2017.04.015
- Lobaccaro, G. , Lindkvist, C. , Wall, M. , Wyckmans, A. , Daiva, W. , Rainer, E. , … Florio, P . (2017). Illustrative prospective of solar energy in urban planning collection of international case studies . IEA SHC.
- Lundström, M. J. , Fredriksson, C. , & Witzell, J. (Eds.). (2013). Planning and sustainble urban development in Sweden . Stockholm: Swedish Society for Town & Country Planning.
- Hopkins, D. (1985). A teacher’s guide to classroom research . Philadelphia: Open University Press.
- McNeel & Associates . (2016). Grasshopper. Retrieved from http://www.grasshopper3d.com/
- Morganti, M. , Salvati, A. , Coch, H. , & Cecere, C . (2017). Urban morphology indicators for solar energy analysis. Energy Procedia , 134 (Supplement C), 807–814. doi:10.1016/j.egypro.2017.09.533 10.1016/j.egypro.2017.09.533
- Neves, A. R. , & Leal, V . (2010). Energy sustainability indicators for local energy planning: Review of current practices and derivation of a new framework. Renewable and Sustainable Energy Reviews , 14 (9), 2723–2735. doi:10.1016/j.rser.2010.07.067
- Nordpool . (2016). Historical market data. Retrieved from http://www.nordpoolspot.com/historical-market-data/
- Patil, V. R. , Biradar, V. I. , Shreyas, R. , Garg, P. , Orosz, M. S. , & Thirumalai, N. C . (2017). Techno-economic comparison of solar organic Rankine cycle (ORC) and photovoltaic (PV) systems with energy storage. Renewable Energy , 113 (Supplement C), 1250–1260. doi:10.1016/j.renene.2017.06.107 10.1016/j.renene.2017.06.107
- Phillis, Y. A. , Kouikoglou, V. S. , & Verdugo, C . (2017). Urban sustainability assessment and ranking of cities. Computers, Environment and Urban Systems , 64 , 254–265. doi:10.1016/j.compenvurbsys.2017.03.002 10.1016/j.compenvurbsys.2017.03.002
- Poppi, S. , Sommerfeldt, N. , Bales, C. , Madani, H. , & Lundqvist, P . (2018). Techno-economic review of solar heat pump systems for residential heating applications. Renewable and Sustainable Energy Reviews , 81 (Part 1), 22–32. doi:10.1016/j.rser.2017.07.041
- Reason, P. , & Bradbury, H. (2008). The SAGE handbook of action research: Participative inquiry and practice . Los Angeles, CA: SAGE.
- Rissman, A. R. , Kohl, P. A. , & Wardropper, C. B. (2017). Public support for carrot, stick, and no-government water quality policies. Environmental Science & Policy , 76 (Supplement C), 82–89. doi:10.1016/j.envsci.2017.04.012 10.1016/j.envsci.2017.04.012
- Sarralde, J. J. , Quinn, D. J. , Wiesmann, D. , & Steemers, K. (2015). Solar energy and urban morphology: Scenarios for increasing the renewable energy potential of neighbourhoods in London. Renewable Energy , 73 , 10–17. doi:10.1016/j.renene.2014.06.028 10.1016/j.renene.2014.06.028
- Skatteverket (Swedish Tax Agency) . (2015). Skattereduktion för mikroproduktion av förnybar el. Retrieved from http://www.skatteverket.se/privat/fastigheterochbostad/mikroproduktionavfornybarel/skattereduktionformikroproduktionavfornybarel.4.12815e4f14a62bc048f4220.html
- Smedby, N. (2015). Assessing local governance experiments for building energy efficiency – The case of Malmö, Sweden. Environment and Planning C: Government and Policy , 34 (2), 299–319. doi:10.1177/0263774X15614176
- Smedby, N. , & Neij, L . (2013). Experiences in urban governance for sustainability: The constructive dialogue in Swedish municipalities. Journal of Cleaner Production , 50 , 148–158. doi:10.1016/j.jclepro.2012.11.044 10.1016/j.jclepro.2012.11.044
- Statistics Sweden . (2016). Households’ housing 2016 . Retrieved from http://www.scb.se/hitta-statistik/statistik-efter-amne/hushallens-ekonomi/inkomster-och-inkomstfordelning/hushallens-boende/pong/statistiknyhet/hushallens-boende-2016/
- Swedish National Board of Housing; Building and Planning . (2008). PM om bestämmelser i detaljplan. Vad är möjligt och lämpligt att reglera . Retrieved from http://www.boverket.se/globalassets/publikationer/dokument/2008/pm_detaljplaner.pdf.
- Swedish National Board of Housing; Building and Planning . (2014). Uppdrag att utreda definitioner på byggnadshöjd, nockhöjd, totalhöjd, vind, suterräng- våning och källare . Retrieved from http://www.boverket.se/globalassets/publikationer/dokument/2014/definitioner-pa-byggnadshojd.pdf
- Swedish National Board of Housing; Building and Planning . (2016a). Planning and building act (2010:900) planning and building ordinance (2011:338) . Retrieved from http://www.boverket.se/globalassets/publikationer/dokument/2016/legislation.pdf
- Swedish National Board of Housing; Building and Planning. Swedish building code BBR . (2016b).
- Thaker, S. , Olufemi Oni, A. , & Kumar, A . (2017). Techno-economic evaluation of solar-based thermal energy storage systems. Energy Conversion and Management , 153 (Supplement C), 423–434. doi:10.1016/j.enconman.2017.10.004 10.1016/j.enconman.2017.10.004
- Torabi Moghadam, S. , Delmastro, C. , Corgnati, S. P. , & Lombardi, P . (2017). Urban energy planning procedure for sustainable development in the built environment: A review of available spatial approaches. Journal of Cleaner Production , 165 (Supplement C), 811–827. doi:10.1016/j.jclepro.2017.07.142 10.1016/j.jclepro.2017.07.142
- Trimble inc . (2016). Sketchup.
- Yazdanie, M. , Densing, M. , & Wokaun, A . (2017). Cost optimal urban energy systems planning in the context of national energy policies: A case study for the city of Basel. Energy Policy , 110 (Supplement C), 176–190. doi:10.1016/j.enpol.2017.08.009