
ABSTRACT
Public bus/minibus safety concerns predispose passengers to make safety evaluations and engage in behavioural adaptations (i.e. behaviour change to compensate for changes in perceived risk) to the perceived unsafety. This cross-sectional study sought to explore Public Transport (PT) users’ choice of seating positions in Ghana, a form of behavioural adaptation to PT unsafety. Data for the study came from 660 public bus/minibus users (through questionnaire administration) in three towns (Wa, Kumasi, and Mankessim) in Ghana. We established the association between the dependent (preferred seating position) and independent variables (socio-demographic characteristics, trip duration and perceived safe seats) via cross-tabulations and Pearson Chi-Square. We tested the strength of the association (effect size) among the variables using the Cramer’s V. We found that the seats behind the driver, in the middle and in front were both the perceived safe seats and the preferred seating positions on a public bus/minibus in Ghana. Justifications for these were mainly informed by safety and comfort. Notably, we observed that occupational status, trip duration and perceived safe seats determine the preferred seating position on a public bus/minibus. Our study findings provide further perspectives on passengers’ seating position decisions which are expected to inform future research and policy directions.
1. Introduction
It is now well established that personal safety, comfort, reliability, convenience, and fare influence Public Transport (PT) use, and operator choices (Barabino, Deiana, & Tilocca, Citation2012; Beirão & Cabral, Citation2007; Fonseca, Pinto, & Brito, Citation2010; Krizek & El-Geneidy, Citation2007; Le-Klähn, Hall, & Gerike, Citation2014; Poku-Boansi & Adarkwa, Citation2013; Sam, Adu-Boahen, & Kissah-Korsah, Citation2014). Moreover, in Ghana, personal safety and bus traffic safety records are very important in PT users’ service quality expectations (Aidoo, Agyemang, Monkah, & Afukaar, Citation2013; Sam & Abane, Citation2017; Sam et al., Citation2014).
Related to the vehicle occupant’s (i.e. passenger) safety, there is enormous evidence to show that the passenger’s seating position influence the probability of death and injuries in the event of an impact (Berg, Cook, Corneli, Vernon, & Dean, Citation2000; Braver, Whitfield, & Ferguson, Citation1998, Evans & Frick, Citation1988; Glass, Segui-Gomez, & Graham, Citation2000; Kahane, Citation1987; Lardelli-Claret, Jimenez-Moleon, Castillo, & Bueno-Cavanillas, Citation2006; Smith & Cummings, Citation2006, Citation2004). In their seminal paper, Evans and Frick (Citation1988) demonstrated the fatality risk of car passengers based on their seating positions. They found that the rear seats (left rear, centre rear and right rear) are associated with a lower fatality risk, and also offers more protection for unrestrained passengers than other seating positions, especially the front seats. However, they argued that this depends on the angle or direction of the impact. For instance, they maintain that ‘the frontal crashes were associated with a larger fatality reduction for rear seat compared to front seat occupancy, but a diminished reduction was associated with centre compared to outboard occupancy’ (p. 1457). Conversely, for rear impact, they observed that ‘occupants in rear seats faced considerably higher fatality risk than those in front seats’ (p. 1457).
Aside from the seating position, other factors including gender, age, airbag status, and restraint system use have been shown to influence the fatality risk of a passenger (Braver et al., Citation1998; Lardelli-Claret et al., Citation2006; Lennon, Siskind, & Haworth, Citation2008; Smith & Cummings, Citation2006). For instance, using a matched cohort design, Lardelli-Claret et al. (Citation2006) studied the effects of age, gender, restraint system use, and seat position on the risk of death for rear-seated passengers involved in road accidents. With respect to gender and age, they found an elevated risk of death for the female rear-seated passenger, and both young (less than 3 years) and old (25–64 years) passengers respectively. They maintain that the use of restraint systems in the rear seat and seating in the central or right side rear seat positions (compared to the left side rear seat) decrease the risk of death. However, this finding raises the question of the angle of the impact as argued by Evans and Frick (Citation1988); this finding predisposes a left-side impact.
In a related study (Smith & Cummings, Citation2006), the impact of front passenger airbag (aside from passenger sex, age and restraint use) on the risk of passenger death in traffic accidents (adjusted risk ratio) was estimated. They argue that the rear seats offer the greatest protection for passengers compared with the front seats; however, this varies with age, restraint use and airbag presence.
Together, these studies indicate that the rear seats are the safest, offering a reduced risk of death/injury to passengers. It is also evident that much of the research on this topic up to now has been experimental in design. Further, beyond these studies, there has been no detailed survey of PT users regarding the factors that influence their choice of vehicle seating position, especially where they have the freedom to choose. Obviously, the knowledge of the rear seat as the safest seating position may influence passenger seat choice; yet, there is the possibility of other considerations influencing passengers’ seating position choice. For instance, aside from safety reasons, we maintain that comfort, convenience, and seat availability are other important factors likely to influence seating position choice.
In this current study, we sought to explore the factors influencing PT (mainly bus and minibus) users’ seat choice decision-making through a cross-sectional survey in Ghana. The paper is guided by the following questions:
What determines bus/minibus passengers’ choice of seating positions in Ghana?
Is there a relationship between PT users’ socio-demographic characteristics (such as gender, age, and occupation) and their preferred seating positions?
The study offers important insights into PT users’ seating position decisions which are expected to inform future research and policy directions. In this study, we assumed that the passenger has the freedom to choose where to sit on a bus/minibus for all trips. In an actual sense, only a few PT operators offer pre-determined passenger seating positions based on bus ticket number, otherwise, the seating position is random (on a first come, first to select basis). The paper has been divided into four sections. Following the introduction, we present the study methods. The study findings and, discussion and conclusion are presented in the third and fourth sections respectively.
2. Methods
2.1. Sample
We adopted a multistage sampling scheme (involving both convenient and purposive sampling) to select 660 public bus/minibus users (convenient sample) from three towns (Wa, Kumasi, and Mankessim- purposive sample) in Ghana. These towns are located in the three main ecological zonesFootnote1 of Ghana namely the Savanna zone (in the north), Forest zone (central portion) and Coastal zone (in the south). Wa, the capital town of the Upper West region, is in the savanna ecological zone; Kumasi, the capital city of the Ashanti Region, is in the forest zone and serves as an important transport node linking northern and southern Ghana. Mankessim is both an important historical town and a centre of commerce in the Central Region of Ghana and is located in the coastal zone (the maps of the study areas are provided in the appendix [–]). In each of these towns, we purposively sampled the popular bus terminals as data collection sites. Availability at the respective terminals and willingness to participate in the study informed our selection of the participants.
2.2. Data collection
We administered questionnaires to the participants in the following sites: the central market bus station (Wa), main bus station (Mankessim), and Kejetia and Abrepo junction bus stations (Kumasi). We recruited four research assistants (one per a bus terminal) to assist in the data collection; the data collection was done concurrently at all the sites. The data collection exercise covered the period from 24 April to 19 May 2017. Of the 660 questionnaires we administered, we administered 360 in Kumasi, and 150 apiece in both Wa, and Mankessim.
Our questionnaire had three sections (A-C), each with a different focus. In the first section, we sought information about the respondents’ socio-demographics (such as gender, age, educational level, occupational status and religious affiliation). In the second section, we captured information on the respondents’ perceived safe seats and their preferred seating positions (i.e. behind the driver, any seat in front, any seat in the middle, any seat at the rear, and any seat by the door or window). For the last section, we sought for the justifications for the choice of preferred seating positions, namely safety, comfort, convenience, and ‘sightseeing’ (watching the road environment and settlements as the vehicle moves along).
2.3. Analyses
We processed and analysed the data using the IBM SPSS Statistics 25 and presented using frequency distribution tables. Through cross-tabulations and Pearson Chi-Square, we established the association between the dependent (preferred seating position) and independent variables (socio-demographic characteristics, trip duration and perceived safe seats). Through a stepwise inductive approach, we selected the independent variables for analysis. In the first instance, we tested all variables to ascertain their association with the dependent variable using the Pearson Chi-Square. Subsequently, we settled on the initial significant predictors for further analysis. The approach is inductive as these predictors have not been established to influence passengers’ seating position choices. We used the Pearson Chi-Square because our data was categorical (both outcome and predictors). We further computed the Cramer’s V to test the strength of the association (effect size) between the variables. The Cramer’s V is appropriate when testing the association between one nominal variable with either another nominal or ordinal variable. In either case, the variable can have more than two categories (Field, Citation2013).
3. Findings
Our sample consisted of 54.8% males with nearly two-thirds (74.4%) within the 18–35 age category (M = 2.64, SD = 1.48) as illustrated in . The Table further shows that the majority (61.1%) had attained pre-tertiary education (namely primary, junior high and senior high education) even though 37% had tertiary education at the time of the survey. Further, 74.2% were employed (as government workers, private employees, farmers and traders) at the time. Christianity was the dominant religion of more than half (62.1%) of the respondents. Analysing the data further, we observed that our male participants preferred the seats behind the driver (31.4%); their female counterparts preferred any seat in front (27.9%). Further, the seats behind the driver were also the most preferred by the various age groups except the 31–35 (31.1%) and 41–45 (26.8%) year olds who preferred the middle seats.
3.1. Perceived safe seats, preferred seating positions and associated justifications
We explored respondents’ perceptions of the safe seat(s) and their preferred seating positions on a public bus/minibus. The justifications provided in support of their choices were also explained.
3.2.1 Justifications for the perceived safe seats on a public bus/minibus
In order to appreciate and justify the respondents’ preferred seating positions (presented later), we first explored their perceptions on the ‘safe seat(s)’ on a public bus/minibus in the likelihood of a road accident. presents both the perceived safe seats and the justifications provided in support of the choices. We observed that 38.8% of the respondents perceived the seat behind the driver as the safest seat, followed by the middle seats (27%) and the front seats (16.5%). The seat perceived to be the least safe was the seat by the door (5%). As evident in , we noted that for the ease of escape from a bus/minibus in the likely event of an accident, the seats by the window (77.8%) and the door (60.6%), and in front (37.6%) were deemed the safest (even though the seat by the door was deemed the least safe in itself as we presented earlier). However, we realised that the middle seat was chosen as the safest by 34.8% of the respondents because they deemed most accidents (especially in the urban environment) as mainly front or rear impacts. Further, we observed that 61.7% of the participants chose the seats behind the driver as the safest seat because of their perception that drivers would protect their side of the vehicle in the likely event of an accident. We performed a chi-square test for independence to examine the relation between the choice of a safe seat and the justifications provided. We observed a significant association between the choice of the safe seat(s) and the justifications provided in support of the choices, χ2 (20, n = 660) = 318.9, p < .001. The related Cramer’s V value of .35 indicates that the strength of the association (effect size) is large. Thus the choice of the safe seat(s) was informed by the justifications given for the choices (as enumerated above).
3.2.2 Justifications for the preferred seating positions on a public bus/minibus
Having exposed the perceived safe seats, we further sought to explore the participants’ preferred seating positions on a public bus/minibus. reveals that the three most preferred seating positions were the seats behind the driver (238 or 36.1%), in front (165 or 25%) or in the middle (155 or 23.5%) in that order. We observed that safety (40.2%) and comfort (33.5%) were the prime reasons for the preferred seating positions.
Through the stepwise inductive approach (reported earlier), we observed that the participants’ occupational status, trip duration and perceived safe seats determined their preferred seating positions. On the relationship between their socio-demographic characteristics and preferred seating positions, we found a significant association between occupation, χ2 (4, n = 660) = 12.5; p < .05, Cramer’s V = .14, and the preferred seating position, with a small effect size. We observed that both the unemployed (46.5%) and the employed (32.4%) preferred the seating position behind the driver.
On the trip duration and the preferred seating position, we observed that any seat in front was preferred (36.8%) during a short distance trip (intra-city trips) while any seat behind the driver (28.3%) was preferred on a long distance trip (inter-city trips). We noted that the chi-square test for independence for the relation between trip duration and preferred seating position revealed a significant association between the variables with a large effect, χ2 (16, n = 660) = 269.1, p < .001, Cramer’s V = .32. Hence, trip duration influences the preferred seating position of public bus/minibus users in Ghana.
Analysing the data further, we observed a significant association between the perceived safe seats on a public bus/minibus and the preferred seating position, χ2 (20, n = 660) = 106.1, p < .001, Cramer’s V = .20 (medium effect). Thus, the respondents’ preferred seating positions were informed by their perceptions of the safe seats on a public bus/minibus.
also presents the justifications provided in support of the preferred seating positions (cross-tabulation). We realised that comfort was the major reason for respondents who preferred seats by the door or window (64.5%), in front (43%), or at the rear (40.8%). Furthermore, safety was the main reason for preferring the seats behind the driver (60.1%) and in the middle (51.6%). We found a statistically significant association between the preferred seating positions and the justifications provided for the choices, χ2 (12, n = 660) = 127.7, p < .001, Cramer’s V = .25 (medium effect).
4. Discussion and conclusion
Public bus/minibus transport in developing countries have serious safety concerns (see Barua & Tay, Citation2010; Hamed, Jaradat, & Easa, Citation1998; Iles, Citation2005; Odero, Khayesi, & Heda, Citation2003). These safety concerns reflect the frequency and severity of road accidents involving public buses/minibuses. In view of this, PT users make safety assessments and subsequently engage in behavioural adaptations to the perceived unsafety (Backer-Grøndahl, Fyhri, Ulleberg, & Amundsen, Citation2009). In this study, we explored the preferred seating positions (a form of behavioural adaptation to PT unsafety) of public bus/minibus users in Ghana. As argued by Wardman and Murphy (Citation2015), seating positions and their configuration is a fundamental element of the public bus/minibus journey experience in the same way as the seating layout in a living room is a fundamental part of home life.
The seating capacity of PT vehicles (buses/minibuses) in Ghana ranges from mini (12–14-seater), midi (15–30-seater) and large (more than 30-seater) and predisposes travellers to have preferences and perceptions for seating positions. The seating configuration in addition to the seating capacity offers travellers the opportunity to travel forward in ‘front-right seat’, ‘seat-behind the driver’ and ‘seat with other’ travellers. The front-right seats are mostly reserved for driver assistant or co-driver in large buses offering travellers the choice of seating behind the driver or seat with/between another traveller(s).
It is important to note that most public buses/minibuses in Ghana are either not equipped with seatbelts or have dysfunctional seatbelts. This means that most PT passengers in Ghana travel unrestrained, thus elevating the probability of sustaining severe injuries in the event of road accidents.
Our study revealed that the seats behind the driver, in front and in the middle were both the perceived safe seats and the most preferred of all seating positions in public buses/minibuses in Ghana. This finding is contrary to the earlier finding of the rear seats being the safest seating position (Evans & Frick, Citation1988; Lardelli-Claret et al., Citation2006; Lennon et al., Citation2008; Smith & Cummings, Citation2006). We also noted that safety and comfort considerations influence the choice of these seating positions. In the public transport service quality literature, enhancing perceived safety and comfort are deemed essential service quality factors which PT operators should prioritise to distinguish their services from those of their competitors, and attract passengers (Grujicic et al., Citation2009).
Notably, we found that occupational status, trip duration (short or long distance) and perceived safe seats determine the preferred seating positions. On the occupational status and preferred seating position, we observed that both the unemployed and the employed preferred seating behind the driver. As we established in this study, the seat behind the driver is perceived as one of the safest seats on board a public bus/minibus and thus it is not surprising it was prioritised by the respondents irrespective of their occupational status. As people’ occupational status predisposes them to work-related trips (see Abane, Citation2011), and to ensure their safety in the face of the PT unsafety, it is well reasoned why the respondents preferred ‘behind the driver seating position’.
Moreover, as we have shown, trip duration also influence the preferred seating positions contrary to the claim that the choice of seating positions in PT is irrespective of distance travelled. Although safety is at the core of these choices, we also maintain that the choice of the front seat during short distance trips are also due to its comfortability and convenience (i.e. ease of alighting) regardless of the fact that the front seat passengers have the same fatality risk as the driver (Evans & Frick, Citation1988). The front seats usually accommodate two passengers. It is important to note that, in Ghana, short distance trips (intra-city) are mainly characterised by frequent passenger alighting and boarding en route and thus both the middle seats and seats by the door may be inconvenient to occupy. In Ghana, anecdotal evidence suggests that the lack of mandatory bus stops compels public buses/minibuses to stop and pick up passengers (i.e. alighting and boarding) randomly. Furthermore, as safety is a major issue with long distance trips in Ghana, it is not surprising that the respondents preferred ‘behind the driver seating position’ as it is deemed the safest. Underlying this behaviour is the notion that drivers protect their side of the vehicle in the likely event of an accident. This claim is, however, unsupported at the moment and thus warrants further research to validate it.
Lastly, we also noted that the perceived safe seats also determines passengers’ preferred seating position. We revealed some interesting reasons behind the respondents’ perceived safe seats. It is believed that the front seat and seats by the door and window are the safest as these seating positions facilitate easy escape from the vehicle in the event of an accident. The choice of the middle seats was justified by the assertion that public bus/minibus accidents are mainly fronts- and rear-impact collisions. As we noted earlier, some respondents also chose the seat behind the driver as the safest as they perceived drivers to protect their side of the vehicle in the event of an accident.
We conclude that occupational status, trip duration and perceived safe seats determine passengers’ preferred seating positions. Further, the preferred seating positions have safety and comfort connotations. As prior studies have tended to focus mainly on the assessment of passengers’ fatality risks based on their seating positions, an assessment of what informs the seating positions (as we have done in this study) is expected to add further perspectives to the current body of knowledge and also inform future research and policy directions.
A major limitation of our study is the subjective nature of the assessment of the seating positions and the risk of death. However, the study findings expose the thought processes underlying the participants’ seating position decision-making.
Disclosure statement
No potential conflict of interest was reported by the authors.
Notes
1. An ecological zone is a landscape unit that unites certain interrelated animal and plant communities (biocenosis) with a particular social formation and environmental conditions as part of an integrated system (Izeta, Citation2010, p. 844).
References
- Abane, A. M. (2011). Travel behaviour in Ghana: Empirical observations from four metropolitan areas. Journal of Transport Geography, 19(1), 313–322.
- Aidoo, E., Agyemang, W., Monkah, J., & Afukaar, F. K. (2013). Passenger’s satisfaction with public bus transport services in Ghana: A case study of Kumasi-accra route. The Theoretical and Empirical Researches in Urban Management, 8(2), 33–44.
- Backer-Grøndahl, A., Fyhri, A., Ulleberg, P., & Amundsen, A. H. (2009). Accidents and unpleasant incidents: Worry in transport and prediction of travel behaviour. Risk Analysis, 29(9), 1217–1226.
- Barabino, B., Deiana, E., & Tilocca, P. (2012). Measuring service quality in urban bus transport: A modified SERVQUAL approach. International Journal of Quality and Service Sciences, 4(3), 238–252.
- Barua, U., & Tay, R. (2010). Severity of urban transit bus crashes in Bangladesh. Journal of Advanced Transportation, 44, 34–41.
- Beirão, G., & Cabral, J. S. (2007). Understanding attitudes towards public transport and private car: A qualitative study. Transport Policy, 14(6), 478–489.
- Berg, M. D., Cook, L., Corneli, H. M., Vernon, D. D., & Dean, J. M. (2000). Effect of seating position and restraint use on injuries to children in motor vehicle crashes. Paediatrics, 105, 831–835.
- Braver, E. R., Whitfield, R., & Ferguson, S. A. (1998). Seating position and children’s risk of dying in motor vehicle crashes. Injury Prevention, 4, 181–187.
- Evans, L., & Frick, M. C. (1988). Seating position in cars and fatality risk. American Journal of Public Health, 78(11), 1456–1458.
- Field, A. (2013). Discovering statistics using IBM SPSS statistics. London: SAGE Publications Ltd.
- Fonseca, F., Pinto, S., & Brito, C. (2010). Service quality in public transportation services – Aligning the operations perspective with customer expectations. Retrieved from http://repositorio.ucp.pt/bitstream/10400.14/3933/1/trabint_2010_FEG_1160_Pinto_Sofia_12.pdf. Accessed 10 January 2017.
- Glass, R. J., Segui-Gomez, M., & Graham, J. D. (2000). Child passenger safety: Decisions about seating location, airbag exposure, and restraint use. Risk Analysis, 20, 521–527.
- Grujicic, M., Pandurangan, B., Arakere, G., Bell, W. C., He, T., & Xie, X. (2009). Seat cushion and soft-tissue material modelling and a finite element investigation of the seating comfort for passenger-vehicle occupants. Materials & Design, 30(10), 4273–4285.
- Hamed, M. M., Jaradat, A. S., & Easa, S. M. (1998). Analysis of commercial mini-bus accidents. Accident Analysis and Prevention, 30(5), 555–567.
- Iles, R. (2005). Public transport in developing countries. UK: Elsevier Ltd.
- Izeta, A. (2010). Ecological zones. In B. Warf (Ed.), Encyclopedia of geography (p. 844). Thousand Oaks, CA: SAGE Publications Ltd. doi:10.4135/9781412939591.n323
- Kahane, C. J. (1987). Fatality and injury-reducing effectiveness of lap belts for back seat occupants. In Society of Automotive Engineers (SAE), Restraint technologies- rear seat occupant protection (pp. 45–63). Detroit, MI: SAE.
- Krizek, K., & El-Geneidy, A. (2007). Segmenting preferences and habits of transit users and non-users. Journal of Public Transportation, 10(3), 71–94.
- Lardelli-Claret, P., Jimenez-Moleon, J. J., Castillo, L.-D., & Bueno-Cavanillas, A. (2006). Individual factors affecting the risk of death for rear-seated passengers in road crashes. Accident Analysis and Prevention, 38, 563–566.
- Le-Klähn, D.-T., Hall, C. M., & Gerike, R. (2014). Analysis of visitor satisfaction with public transport in Munich. Journal of Public Transportation, 17(3), 68–85.
- Lennon, A. J., Siskind, V., & Haworth, N. L. (2008). Rear seat safer: Seating position, restraint use and injuries in children in traffic crashes in Victoria, Australia. Accident Analysis and Prevention, 40(2), 829–834.
- Odero, W., Khayesi, M., & Heda, P. M. (2003). Road traffic injuries in Kenya: Magnitude, causes and status of intervention. Injury Control and Safety Promotion, 10, 53–61.
- Poku-Boansi, M., & Adarkwa, K. K. (2013). The determinants of demand for public transport services in Kumasi, Ghana. Journal of Science and Technology, 33(3), 60–72.
- Sam, E. F., & Abane, A. M. (2017). Enhancing passenger safety and security in Ghana: Appraising public transport (PT) operators’ recent interventions. Management Research and Practice, 9(3), 62–75.
- Sam, E. F., Adu-Boahen, K., & Kissah-Korsah, K. (2014). Assessing the factors that influence public transport mode preference and patronage: Perspectives of students of University of Cape Coast (UCC), Ghana. International Journal of Development and Sustainability, 33(22), 2168–8662.
- Smith, K. M., & Cummings, P. (2004). Passenger seating position and the risk of passenger death or injury in traffic crashes. Accident Analysis and Prevention, 36, 257–260.
- Smith, K. M., & Cummings, P. (2006). Passenger seating position and the risk of passenger death in traffic crashes: A matched cohort study. Injury Prevention, 12, 83–86.
- Wardman, M., & Murphy, P. (2015). Passengers’ valuations of train seating layout, position and occupancy. Transportation Research Part A: Policy and Practice, 74, 222–238.
Appendices
Figure A1. Wa municipality.
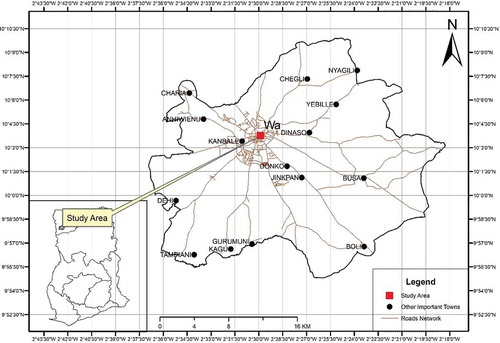
Figure A2. Kumasi metropolitan area.
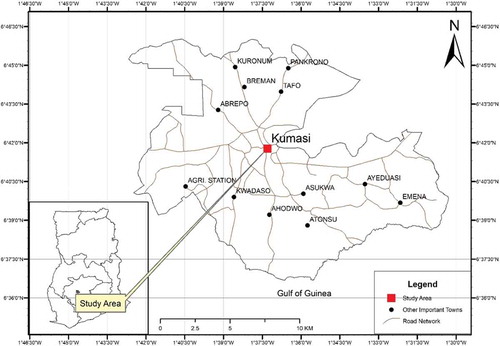
Figure A3. Mfantseman municipality.
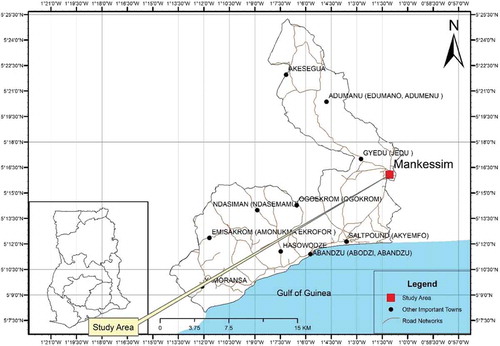
Table A1. Participants’ socio-demographics (N = 660).
Table A2. Perceived safe seats with justifications for the choice of safe seat.
Table A3. Preferred seating positions with justifications for the choice of preferred seating position.