
ABSTRACT
Several studies have pointed to the difficulties of obtaining good data on train ridership. This paper is a literature review on how the number of travellers on trains are measured, including technologies and practices for measuring actual ridership. There are a number of publications and practical work done on estimating ridership. We find there are several technologies that can be applied for measuring ridership on trains. The technologies and approaches include (1) Manual counts and surveys, (2) On-board sensors such as door passing, weight, CCTV and Wi-Fi-use, (3) Ticketing systems, ticket sales or ticket validation, and (4) Tracking of travellers for larger part of the journey, e.g. by mobile phones and payments. Data from on-board sensors and ticketing systems are both managed by public transportation providers. By contrast, surveys, payments statistics and mobile phone data may be available to stakeholders outside the public transportation system, which can be an advantage, as access to ridership data can be an issue for business reasons. Furthermore, mobile phone data appears as an interesting option, as they can track complete journeys. New technologies, and especially mobile phone data, are therefore of special interest in future uses of ridership data for evaluations and quality assessments.
1. Introduction
Access to good relevant data can be a challenge when evaluating railway investments (Frumin, Citation2010; Volden & Samset, Citation2013). This may seem like a paradox, when the volume of data and different sensoring technologies are maturing. In this paper, we discuss to what extent different technologies have the potential to provide information on train ridership.
Information about ridership in public transportation has long been an issue (Vuchic & Newell, Citation1968). In a long-term perspective, we are interested in this type of data for use in the evaluation of major transport infrastructure investments, such as new double tracks, railway tunnels, new timetables or fare changes. You may measure the change in travel time from home to work (and vice versa) and changes in travel patterns before and after a major investment in new railway lines for a larger population, which is a suitable way to evaluate the effect of the investment project on.
According to OECD (Citation2002), evaluation can be defined as a systematic and objective assessment of an ongoing or completed project, program or policy, its design, implementation and results. Scriven (Citation1991) use another definition, stating that evaluation is the process of determining the merit, worth or value of something. Data quality and availability are key issues in evaluations (Olsson & Bull-Berg, Citation2015; Parthasarathi & Levinson, Citation2010; Small, Citation1999), and access to good relevant data is a common challenge in project evaluations. This may seem like a paradox, as the volume of data generally increases. The Norwegian Ministry of Communication requests ex-post cost-benefit analyses to be carried out five years after major transportation infrastructure projects are finished. These evaluations are typically made based on the situation at one point in time. New types of data can add both precision and new perspectives to evaluations (Tanaka, Citation2015). There is, for instance, a potential to generate information about travels that involve different modes of travel.
We review how the number of travellers on trains are measured, including technologies and practices for measuring actual ridership. New technologies are of special interest and especially mobile phone data. There are a number of publications and practical work done on estimating ridership, including estimating changes in ridership due to different changes such as new infrastructure. While predicting a future change naturally is more difficult than to measure an existing situation, obtaining good data on the numbers of travellers on trains is not a trivial task. In addition, experience shows that detailed information on ridership is frequently considered to be business confidential information from the train operator’s point of view.
2. Analysing ridership on trains, quality assessments and Big Data applications
Two major challenges arise in the process of obtaining data on ridership. One issue is that train operators often treat such data as confidential business information, especially high-resolution data (Vigren, Citation2017). A second issue is that the data that is available tend to vary in both quality and coverage. The unreliability of ridership data has been addressed in the previous research, such as Fowkes, Nash, and Whitening (Citation1985), Chu and Chapleau (Citation2008), and Kežić and Durango-Cohen (Citation2018).
There is currently a focus on digital transformation in railways (Pierigud, Citation2018), for instance, within safety (Parkinson & Bamford, Citation2016), freight transport (Green, Citation2017) and maintenance (Tute, Citation2018). Several undertakings and programs focus on this transformation, including Shift2Rail Joint Undertaking, Britain’s Digital Railway, and Network Rail’s Offering Rail Better Information Services (ORBIS) program. Ongoing digitalization of railways open opportunities for new and expanding measurements of ridership. As an example of the possibilities following digitalization and technological development, Mabrouk and Zagrouba (Citation2018) review how video surveillance system can be used to map behaviour, including travellers on train stations. In the following, we briefly review some of the background for Big Data in transportation and implications for ridership measurements, including quality assessments.
2.1. Big Data in telecommunication and transportation
The term ‘Big Data’ is increasingly becoming mainstream and its usage is no longer limited to a finite set of industries. The term has evolved over the years and as defined by De Mauro, Greco, and Grimaldi (Citation2016): Big Data represents the information assets characterized by such a high volume, velocity and variety to require specific technology and analytical methods for its transformation into value. While accessibility to Big Data is on the rise, however access to such large chunks of information provides challenges of estimation, integration, and validation (Toole et al., Citation2015). On one hand, Big Data is attractive in the sense that it can be extracted instantaneously at a low cost and the available samples are long-running and cover multiple aspects simultaneously. On the other hand, the sheer size of the data means that it lacks the contextual demographic information pertaining to privacy, resolution of data and inherent noise (Toole et al., Citation2015).
The type of Big Data that is extracted from cellular data is labelled as ‘digital breadcrumbs’ by Pentland (Citation2012). This type of data consists of numbers and facts and is structured as it is comprised of datasets of variables which can be easily tagged and categorized. The data are employed itself by the Telecommunication companies and the trend to utilize Big Data in such organizations is gradually increasing. According to Bughin (Citation2016), the five functional domains in which the telecom industry uses Big Data is; sales and marketing, customer care, competitive intelligence, network load optimization, and supply chain optimization. Zheng et al. (Citation2016) suggest application areas of Big Data in transportation, that includes transportation analytics and forecasting with social signals, and crowdsourcing mechanisms for transportation through social media. They also classify the analysis approaches into three main types; i.e. Statistical Analysis, Data mining and Visual Analytics.
In the transportation sector, owing to the inability of the current methods to predict the real-time traffic growth and trends, there is a growing focus in developing smart, efficient, as well as sustainable, transportation systems. The reason for this is twofold. On one hand, it shapes the strategies and operational models, planning and service quality of transport companies. On the other hand, it is imperative in detecting the needs of individual users in terms of time efficient, adaptive travel planning and support of mutually beneficial social behaviour (Fiosina, Fiosins, & Müller, Citation2013). Utilizing Big Data can prove to be vital towards developing sustainable and environment friendly transport systems.
2.2. Use of information about the number of travellers
The number of travellers is a measure of demand for transportation services. Ridership is an important factor when analysing public transportation, including trains. Information on ridership is also important for business planning and evaluations. However, train operators frequently consider such data as business confidential information, especially in high resolutions. In addition, the data that actually is available is of varying quality and coverage (Fowkes et al., Citation1985).
Boyle (Citation1998) summarize four main reasons for why ridership data is collected:
ridership is reported to external funding and oversight agencies.
it monitors trends over time.
ridership is a key performance indicator at various levels of the transportation system.
ridership data helps to identify locations with the greatest boarding and alighting activity.
Train ridership is influenced by a number of factors, including fares, transit time, transit comfort characteristics and feeder accessibility of transit, price and service characteristics of the competing modes, seasonal variations and monthly working day variations, as well as socio-economic conditions of the service areas in the medium or long-term (Doi & Allen, Citation1986).
There has been significant discussion about actual ridership on trains and urban rail. Several authors claim that ridership is systematically overstated by traffic demand models and project promoters (Altshuler & Luberoff, Citation2003; Flyvbjerg, Bruzelius, & Rothengatter, Citation2003; Parthasarathi & Levinson, Citation2010). These studies typically focus on factors influencing the inaccuracy in forecasts. However, we dare to claim that few researchers have focused on inaccuracies in ridership data.
2.3. Quality assessment and improvement of passenger transportation by train
Multiple criteria decision-making (MCDM) are methods applied in quality assessments and improvement of passenger transportation. Such methods can be applied to evaluate railway quality from both a passenger perspective and seen from the railway organizations. To begin with, we provide examples of MCDM in a passenger perspective, which is an area where ridership information is highly relevant.
Maskeliūnaitė and Sivilevičius (Citation2012) examine the criteria describing the quality of passenger transportation and determine their significance by applying the method of comparative analysis, i.e. the Analytic Hierarchy Process (AHP) method. Ranks are assigned to the criteria by train passengers, service staff and administrative staff. These are criteria for train elements and technical state of railway tracks, for railway trip planning and technology, for a price of a trip ticket, and for a safe railway trip. They offer an algorithm for displaying the quality of train travel.
Chen, Leng, Mao, and Liu (Citation2014) study passenger transfer capacity, which is one of the fundamental requirements to validate designs and ensure efficient operations at large transport terminals. The study focuses on the transport terminals at major cities where a number of transport services connecting local and inter-city traffic convert. They propose an integrated weight-based multi-criteria evaluation on transfer performance at large integrated transport terminal, as a robust and flexible method. The evaluation is developed by the formulation of criteria systems and integrated performance factors. The methodology is verified through a case study on the Beijing South Railway Station in China, verifying the feasibility and effectiveness of the method.
Paha, Rompf, and Warnecke (Citation2013) explore determinants for customer choice behaviour in passenger rail competition on two cross-border routes. The dataset was collected by performing almost 700 interviews on-board trains on the two cross-border routes. They estimate a multinomial Logit discrete choice model for demand, to analyse the preferences of the interviewees for different long-distance transport services. The results imply that entry into the commercial passenger rail market may be more difficult than often thought.
De Oña, Eboli, and Mazzulla (Citation2014) analyse transit service quality on the basis of the perceptions directly expressed by the passenger of the services. The experimental data were collected in a survey conducted with a sample of more than 16.000 passengers. The survey covered service characteristics such as safety, cleanliness, comfort, information, and personnel. The tool used for evaluating service quality is a Classification and Regression Tree Approach (CART). An important advantage of the CART model is that is does not need to establish a functional relationship among variables as ordinary statistical modelling techniques, such as regression models. Also, it can effectively handle multi-collinearity problems. The existence of multicollinearity is very frequent in these satisfaction surveys. Disadvantages are that the classification tree models are generally ‘unstable’ because the building of the trees is based on their seed number, which is random, and therefore different trees could be obtained and the results might vary.
Batley, Dagray, and Wardman (Citation2011) develop a dynamic model of rail demand at the market level, yielding short and long-run elasticities with respect to lateness. The short-run market-level model could possibly encompass a range of responses including changes to departure time, ticket type, route, operator and/or mode. In the long-run, the market-level could extend to an even wider range of responses, such as residential location, car ownership and employment. Their primary contribution is reporting estimates of the elasticity of demand for rail in response to changes in service performance. They find that whilst rail travellers show considerable distain for experiences of lateness, such experiences will not necessarily dissuade them from travelling by train.
MCDM methods can be applied to evaluate railway quality seen from the railway infrastructure managers’ and train operators’ perspective. Train ridership information is a relevant parameter for such assessments. Maskeliūnaitė and Sivilevičius (Citation2014) suggest a mathematical model for the evaluation of the train elements and technical state of railway tracks. The influence of all the criteria on the trip may be evaluated by comprehensive quality index (CQI) or quality index K. The model is used for calculating the values of each of the criteria based on the normalized weight of the criterion multiplied by its variable. They claim that the model and the techniques may be applied to determine the quality or effectiveness of other objects or processes, which can be described by sets of criteria.
The control of train movement in large passenger railway stations is connected with a number of specific problems, including delays to incoming trains. Solving these problems has an impact on the quality of service provided to passengers at a station and in the surrounding railway network. Jánošíková, Kavička, and Bažant (Citation2014) study the dispatcher’s decision-making process in the situations of delays to incoming trains, which require the dispatcher to flexibly solve problems related to potential train routing conflicts. The article models the dispatcher’s decision-making process using a mathematical programming approach, which includes the operation scheduling and platform track assignment in a large passenger railway station. The model can be classified as a multi-criteria MIP model. The approach has two goals: to minimize the deviations from the valid timetable, and to minimize the inconvenience caused to passengers. The inputs to the model contain potential delays of incoming trains. The outputs are assignments of platform tracks to arriving trains, and adjusted arrival and departure times.
Christogiannis and Pyrgidis (Citation2014) investigate the impact of traffic composition on the economic profitability of a new railway corridor, using a mathematical model. Traffic composition denotes the percentile distribution of passenger and freight trains in circulation on the railway infrastructure, where the possible compositions are mixed, dedicated passenger trains and dedicated freight trains. The economic profitability is characterized by the financial indicators net present value (NPV) and internal rate of return (IRR) of the investment. Their results show that the basic criterion for the selection of the optimum scenario concerns the characteristic of transportation demand. Here demand of transportation is the type of goods being transported (passengers and/or freight) and volume transported, meaning the number of passengers or the number of tonnes transported per day.
3. Approaches for obtaining information about the number of travellers
There are several ways to obtain data on train ridership. Boyle (Citation1998) found that most US agencies use more than one method. Manual technologies have been in practice from the start and were still surprisingly the dominant method of gauging passenger count. Vuchic (Citation2005) mentions that surveys and manual passenger counts are well established in railway transit services to obtain information on passenger volume and load counts. Railway agencies have relied on traveller surveys and manual counts to collect data on train ridership.
Tanaka (Citation2015) looks at the prospects of using Big Data in the railways. He suggests technologies for measuring actual ridership, such as data collected at automatic ticket gates, data of vehicle weight, positional data of individuals and data of numbers of passengers in each station.
3.1. Traditional methods
According to Boyle (Citation1998) more than two-thirds of the studied US transport agencies used paper and pencil to collect ridership data. Almost as many used Electronic Registering Fareboxes (EFR). Other applied methods were On-Board Surveys, Vehicle Operator Trip Cards, Estimate from Passenger Revenue, Checkers and Hand-Held Units, Automatic Passenger Counting (APC) and Smart Cards. They found that large transport systems were more likely to rely on manual procedures. Smaller systems were more likely to use ERFs. More advanced digital technologies such as APCs and smart cards were used independently of system size.
The practicalities for conducting manual observations, storing and summarizing them are well established (described in Vuchic (Citation2005)). This has been the main data source for the Norwegian railways. In addition, different travel behaviour surveys have been carried out. Using surveys and manual counts provide transport organizations with a reasonable snapshot of existing demand on their transport system. Increasing the resolution of manually obtained information is typically costly and requires personnel resources. A number of APC systems are therefore developed. According to Boyle (Citation1998), accuracy was a major concern in any data collection effort. The use of manual techniques can result in errors both in the collection and registration phases. Such errors tend to be random in nature.
3.2. Technologies and methods for automatic passenger counting
According to Vuchic (Citation2005), the most complete passenger counts can be obtained from fully controlled stations. Fare collection systems are platforms for collecting passenger fares and controlling access to the transportation service. There is a trend towards automating the fare collection process, introducing Automated Fare Collection (AFC) Systems. In addition to collecting fares, such systems can be used to track not only the number of passengers, but also the entry and exit points for travels. Frumin (Citation2010) use such entry and exit data and develops a methodology for building an unbiased estimate of existing travel patterns on the London Underground.
Automatic Passenger Counting (APC) is gaining popularity. An APC is an electronic device, which accurately records boarding and alighting data on transit vehicles such as trains. Sensors are located in the doorways to a vehicle. When a person passes, the sensors count movements and determines if they are entering or exiting the vehicle. Barabino, Di Francesco, and Mozzoni (Citation2014) addresses the challenges with using APC to measure ridership on busses. They mention some challenges, such as matching of data to the bus stops, tackling anomalies, and building intelligible performance reports.
APC units are not needed on every vehicle in the fleet. Boyle (Citation1998) found that the eight agencies that make regular use of APCs equipped about 10% of their fleet with APC units, and rotated these units throughout the routes in the system. APCs can be based on different technologies. One way is using infrared lights above the doorways to a vehicle (Chu, Citation2010). These beams cross the stairwells and are spaced so that the order in which the beam is broken by a person determines if they are entering or exiting the vehicle. Boyle (Citation1998) mentions that another technology for APC is treadle mats. Mats can be applied to the vehicle steps. They contain switches that close when the mat is stepped on. The transitions of closing and opening switches and the times between them determine passenger flows. They mention that in certain climates, treadle mats can be difficult to maintain. Another technology for APC is the use of closed-circuit television (CCTV) and intelligent people counters to log numbers of travellers getting on and off a vehicle (Saponara, Pilato, & Fanucci, Citation2016). On-board CCTV is frequently installed on trains for surveillance and safety. The technology can also be applied for detection for people counting. Other methods include magnetic loop detectors and automatic register plate recognition systems (Kujala, Aledavood, & Saramäki, Citation2016). All these methods require physical equipment installation.
Dlamini (Citation2011) quantifies the environmental impacts of the different rail ticketing options available in Japan. For the different ticketing options, the author quantified the energy requirement, environmental impact through an established indicator and the associated CO2 emissions. In terms of energy requirements, the environmental impacts of the various ticketing systems from highest to lowest are; the paper ticket, the limited use plastic ticket, the smart card with gate doors, and the smart card without gate doors. Most energy is consumed by ticket-related machinery during standby time that contributes 50–76% of the system energy requirement.
Nielsen, Frølich, Nielsen, and Filges (Citation2014) present a method for estimating passenger numbers based on electronic weighing equipment (EWE). EWE is installed in many modern trains because it supplies data for the braking system. This information can be used to estimate the number of passengers in the trains, as the weight of a train is a function of the number of passengers in the train at any particular time. Provided that the weighing equipment is installed on a train, this can be a cost-efficient way of estimating ridership. Nielsen et al. (Citation2014) show that EWE-based monitoring can provide estimates with higher accuracy than infrared sensor technology. The weighing system also has the potential to provide a complete sample of weight, and thus ridership. According to Nielsen et al. (Citation2014), passenger distribution in the urban Copenhagen rail network is tracked based on a combination of EWE and APC. The two systems provide complementary information, as the weight-based estimation provides information about the total traffic volume and automatic passenger counting provides information on passenger flow. The two systems can also be used to do quality assurance of each other’s measurements.
3.3. Existing ridership measurements in Norway
The Norwegian National Rail Administration (Jernbaneverket, now Bane NOR) publish annual reports on the Official Railway Statistics in Norway. The railway statistics include aggregated data on the number of travellers, as well as passenger kilometres, and the number of sold single tickets and monthly tickets. The practices for measuring ridership is manual counting at chosen stations on each railway line.
In 2013, testing of APC system from the German Dilax began in Norway (Zachariassen, Citation2014). The APC registers the number of people that embark and disembark through each train door on every station, by means of sensors in the doorways. Norsk Regnesentral (Norwegian Computing Center) has developed a mathematical tool that will, based on the APC data, use a statistical model to calculate the total number of passengers and to develop a model for generalizing the data from the vehicles with APCs to be applicable for the complete train traffic system in the greater Oslo area (Teknisk Ukeblad, Citation2014).
Several evaluations have mentioned the lack of ridership data as a problem. Commissioned from Concept, Nilsson, Nyström, and Pyddoke (Citation2012) evaluated the railway investment on a third and fourth railway track west of Oslo a few years after the commissioning of the project. They commented that there was lack of information about the number of travellers before and after the investment. The ex-ante evaluation had made a forecast on how the number of travellers would change, which was based on conditions of population increase and increase in employment and income. In the ex post evaluation, they had aggregated data on the percentage increase of the number of travellers. However, they comment on the lack of numbers that are consistent over time on the railway line.
3.4. New types of data
Hilbert (Citation2013) proposes a classification of different types of data and data sources based on tracking words, locations, nature, behaviour, economic activity, and finally tracking other data. Related to the evaluation of buildings we suggest a division into the following categories according to how data is collected or generated:
Internet traffic, including activity on social media and data from search engines
Movement-related data, and different visualizations, including pictures, video, BIM models and maps
Physical environment, typically from different types of sensors
Commercial activity, the use of payment services and consumption patterns
New types of data open many possibilities for the analysis of transport measures (Barabino et al., Citation2014; Bianchi, Rizzi, Sadeghian, & Moiso, Citation2016). A significant portion of Big Data is geospatial data, generated from sources such as mobile devices and RFID sensors. Geospatial Big Data gives both opportunities and challenges, as discussed by Lee and Kang (Citation2015). In 2012, Virginia Railway Express looked into the latest payment technologies to pilot at key stations, as well as technology to verify ticket purchase and use along with ticket history (Henry & Grant, Citation2012). The technology options included mobile ticketing, radio frequency tags and Near Field Communication (NFC). The ticket database would be used for analytical purposes such as ridership, travel patterns, boarding at particular stops, client use of facilities by time of day, and other information that enables the providers to better plan their services. They highlight that such solutions should allow for secure mobile phone ticketing with both electronic and visual ticket verification with handheld devices. A key component is the ability to support smartphone technology. This would include mobile devices utilizing the prevalent versions of the mobile operating systems.
Travel time and ridership can be detected using GPS traces. These approaches are indeed innovative and capture in detail individual travel behaviour, but are limited by their sample sizes (e.g. number of volunteers) and currently face scaling difficulties (Holleczek et al., Citation2014). Also, a low penetration of smartphones on a global scale and limited access to GPS related information from Telecom Operators because of user privacy policies also hinders this to be an effective mode for calculating travel times going forward. Chaudhary et al. (Citation2016) discuss collecting information about occupancy level of public transportation system using the potential of smartphones. Smartphones have inbuilt sensors like GPS which can be used to extract locational intelligence of the commuters. They describe that collected information can be stored in a database for analysis to obtain occupancy level patterns for different routes on different days. They show that patterns observed are used to make predictions of occupancy level in a bus, with an accuracy up to 92%.
Higuchi, Yamaguchi, and Higashino (Citation2015) identifies a number of innovative use forms based on mobile devices, including several technologies which typically are found in smartphones. They mention, among other options, GPS, Wi-Fi, Bluetooth, FM radios and sound recognition. Moreover, it has been showed that it is possible to detect transportation mode based on the GPS sensor on mobile devices and knowledge of the underlying transportation network (Stenneth, Wolfson, Yu, & Xu, Citation2011). Proximity sensing can be based on logging of Bluetooth units. This is applied by the Norwegian Road Authority (Olsson and Bull Berg, Citation2015).
Some studies using mobile phone data have been done. For instance, Xu, Shaw, Fang, and Yin (Citation2016), Kujala et al. (Citation2016), Holleczek et al. (Citation2014), Calabrese, Di Lorenzo, Lui, and Ratti (Citation2011), and Jarv, Ahas, Saluveer, Derudder, and Witlox (Citation2012) all show that cell phone data can be used to describe people’s movement pattern. However, most studies have not focused on the rail in particular, but typically addressing travel in general. Mobile phone datasets allow deriving a statistical analysis of human activities at a fine level of details (Leo, Busson, Sarraute, & Fleury, Citation2016). It has been shown that cell phone data can be used to derive good estimates of dynamic quantities, such as travel times, train occupancy levels and origin-destination flows, for transportation studies (Aguilera et al., Citation2014). Due to this reason, mobile phone data can be utilized in estimating the commuting patterns and travel times for individuals.
There is a variety of approaches that can be utilized for calculating this information by analysing the exchange of information between the mobile base station and cellular network. Most studies perform some kind of trip extraction in order to extract the movements relevant for traffic analysis from the raw cellular network data (e.g. Alexander, Jiang, Murga, & González, Citation2015; Calabrese et al., Citation2011; Doyle, Hung, Kelly, McLoone, & Farrell, Citation2011; Iqbal, Choudhury, Wang, & González, Citation2014). Because cellular network data can contain a lot of noise, there is no obvious definition of what a movement/trip is (Gundlegård, Rydergren, Breyer, & Rajna, Citation2016). Hence, trip extraction algorithms vary a lot among different authors. An origin-destination matrix can be computed based on the extracted trips (e.g. Calabrese et al., Citation2011; Larijani, Olteanu-Raimond, Perret, Brédif, & Ziemlicki, Citation2015). The aggregation of OD-flows gives an estimation of the number of cell phone users that are travelling, however, only those of the operator that provided the data (Gundlegård et al., Citation2016). As a result, this can only give information about how the travel demand distributes relatively between different OD-pairs. To estimate the total travel demand in terms of the number of people travelling, authors use different scaling factors (e.g. Alexander et al., Citation2015; Calabrese et al., Citation2011; Iqbal et al., Citation2014; Toole et al., Citation2015). Several authors have also tried to reconstruct the specific travel mode and route that a user took for a trip, which is challenging to classify. However, as Larijani et al. (Citation2015) showed, detection of the trip segments in which people take the metro is promising, because underground tunnels are being served by dedicated base stations (Gundlegård et al., Citation2016).
There are three main types of mobile phone data collected using the passive collection: Call Detail Records (CDR) data, Probes data and Wi-Fi data (Larijani et al., Citation2015). CDRs contain anonymized traces of a user at approximate locations when the phone communicates with a cell phone tower. Gundlegård et al. (Citation2016) present new algorithms for dynamic demand and route choice estimations, that enables efficient use of CDR data for understanding mobility from a transportation planning perspective. Alexander et al. (Citation2015) present methods to estimate average daily origin-destination trips from triangulated mobile phone records of millions of anonymized users. The records are converted into cluster locations and inferred to be home, work or other depending on observation frequency, day of week and time of day. They compared their method to find origin-destination trips with travel surveys.
The advantage with mobile phone data is that it is automatically collected, and hence more frequently and economic than travel survey data (Alexander et al., Citation2015). In contrast, the disadvantages with mobile phone data are the lack of information about the traveller, like age, income or purpose of a trip.
3.5. Summary of approaches for ridership measurements
Cottrill and Derrible (Citation2015) describe the current methods as sporadic and inefficient, small sample sizes in relation to the target and a poor level of accuracy. lists a number of identified technologies for identification of the number of travellers on trains and other transport vehicles. There are many technologies for automatic data collection of ridership, including measuring on-train loads from automatic measurements of train payload weight, and data based on passengers passing through doors. We find a potential to use mobile phones and Wi-Fi-based data. Furthermore, we find that the majority of approaches are depending on access to a train station or rolling stock equipment. In addition, we find that most technologies measure either number of travellers continuously, or at entry- and exit points at train stations. Mobile-based measurements can be applied independent of the traffic operators, and they have the potential to measure complete trips, including several modes of transportation. These features are two arguments in favour of investigating the measurement of ridership using mobile phone technologies, even though there already exist several technologies for ridership measures.
Table 1. Summary of studied technologies and approaches for ridership measurement.
All of the data sources in , except manual counts and surveys, comprise of data sets that can be characterised as Big Data, as they have the possibility to automatically generate large amounts of data of high resolution. However, till now it has been common to use arrays of information collected for instance by surveys, which is typically not regarded as Big Data.
4. Future uses of ridership measurements for evaluations and quality assessments
The term most usually used to define ridership is linked trips. Linked trips are associated with total riders and gauges the actual number of complete trips from origin to destination, which includes transfers. The fundamental advantage associated with transportation investment is dramatically dependent on the extent of mobility it contributes to. Energy savings, air quality contributions, congestion relief, offsetting roadway infrastructure needs, etc., all require the transit services to be utilized by travellers for these benefits to be captured (Polzin & Page, Citation2003)
Having established the fact that the travel time and its possible optimization are based upon the modes of travel, whose individual usage patterns and density needs to be scrutinized. The foremost reason to evaluate ridership is to determine that there are multiple alternatives available for travellers and the particular mode of transport is having the desired usage and impact as the investment was targeting. Transportation mode inference is a tool to determine the transportation mode of an individual traveller or a group of travellers, based on the speed, travel time or other information that can be collected from their trips. This tool has been used to provide traveling services, manage transportation and plan cities (Wang, Calabrese, Di Lorenzo, & Ratti, Citation2010). Analysing ridership is imperative for policymakers, understanding how various factors affect transit ridership is crucial to the development of robust policies that will match the goals of sustainable transport (Choi, Lee, Kim, & Sohn, Citation2011), business planning revenue estimation and taking measures for the future are also reasons for looking into ridership analysis. Stasko, Levine, and Reddy (Citation2016) summarize the application areas of ridership data. These areas are: setting regular scheduled frequency, designing supplemental service during events and construction, planning system expansions, and determining the need for additional station exit capacity, assessing impacts of service management decisions on travel times, computing passenger-based performance metrics (e.g. waiting time and travel time) and reporting to outside agencies.
There can be countless travelling scenarios for a person travelling between two points. The travel scenarios and travel times between an origin and destination point are typically systemized as origin-destination estimations and matrices (Frias-Martinez, Soguero, & Frias-Martinez, Citation2012; Iqbal et al., Citation2014; Vuchic, Citation2005; Wang, Attanucci, & Wilson, Citation2011). Two common cases of travel scenarios will be
Work to Home
Home to Work
The path taken in either direction involves a combination of travelling modes. Public transport will be taken into consideration for people travelling to work and vice versa, and the focus will be on the railway. This can be illustrated by the path described in . The journey from Work to Home for an individual may consist of:
Getting from Home to station C
Train journey from C to A
Interchange at station A
Train journey from A to B
Getting from B to Work
Figure 1. Illustration of travel patterns.
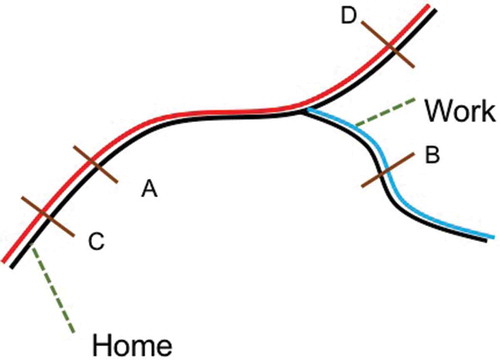
Mobile phone data has the potential to reveal transport patterns and not only measure the volume of traffic at those points where there is a count. One can also seek explanations by combining ridership data with, for example, data on punctuality or weather data.
Bull-Berg, Olsson, and Sørensen (Citation2017) have done some analyses of train ridership based on mobile phone data. With reference to , they looked at the number of handset counts that are likely to be related to train passengers at selected points, like A, B, C and D. Next step will be to obtain data showing flow between base stations, such as from A to B in . This is interesting in general, and in particular, if there is a transfer point between A and B. Even more interesting would be to look at flows between like ‘home’ areas and likely ‘work’ areas. This is interesting in itself, but particularly in an evaluation perspective to compare total travel time before and after an investment.
The long-term vision is to utilize mobile data in estimating the benefits of large transport investments. The possibilities to look at different parameters associated with transport is huge, such as traffic density, commuting patterns, utilization percentages of specific train lines, capacity analysis to name a few. Moreover, the usage of mobile data may not only be limited to railways but expanded to other modes of transport as well. Multiple large infrastructure projects are ongoing in Oslo and its neighbouring areas, the vision is to investigate how mobile phone data can be used in future evaluations of these projects.
Mobile phone data can serve as a reliable data source to estimate benefits and analyse the real-time impact of such projects. It can be utilized for calculating stats and facts in alternative analysis and justifying the opportunity space as well as benefit calculation and providing more information to counter the uncertainties. Post evaluation or ex ante evaluation is also a mandatory requirement for Norwegian Government which includes cost benefit analysis. Mobile data thus have the potential to replace the traditional survey data in these evaluations to provide real time information at the point of evaluation. The total time for the complete journey needs to be estimated, the analysis for travel time during different phases of the journey can also be looked into if needed and the causes for increased or factors for optimal travel times can be looked into once these statistics are available for different regions. In accordance with the factors mentioned above the travel time can be a vital input in project evaluations and can serve as a baseline for planning, scheduling, reporting, finance as well as public affair teams for the train operator.
5. Conclusion
The paper has reviewed how the number of travellers on trains is measured, including technologies and practices for measuring actual ridership. Furthermore, our study has investigated the potential for using mobile phone data to describe travel patterns that include train travel. We find that there is a set of technologies that can be applied for measuring ridership on trains. The technologies and approaches include:
Manual approaches, such as manual counts and surveys (based on interviews, questionnaires, etc.)
On-board sensors, such as door passing, weight, CCTV and Wi-Fi-use
Ticketing systems, ticket sales or ticket validation
Tracking of travellers for a larger part of the journey, such as tracking of mobile phone and payments
Use of on-board sensors is established. However, it mainly measures ridership on individual rolling stock units. It is less suitable to measure multi-mode journeys, or even transfers between lines in a train system. Ticketing systems can measure journeys within the ticketing system, which can cover both transfers between lines and between travel modes within the same public transport system. However, it requires ticket validation at entry and preferably also at the exit. Both on-board sensors and ticketing are data that are managed by the public transportation providers. They may not necessarily be available to others, such as evaluators.
Tracking of travellers for larger parts of journeys can be done by traditional surveys. It is costly and is depending on response rates. It also measures people’s stated preferences and impressions of their travel time. Payment tracking requires access to payment statistics. It only records electronic payments, and only records visit to commercial areas. Surveys, payments statistics and mobile phone data may be available to stakeholders outside the public transportation system, such as evaluators and others. Finally, mobile phone data appears as an interesting option. It can track complete journeys, with accuracy on the level of coverage of base stations, or even more accurate if apps allowing for GPS tracking are used.
Disclosure statement
No potential conflict of interest was reported by the authors.
Additional information
Funding
References
- Aguiléra, V., Allio, S., Benezech, V., Combes, F., & Milion, C. (2014). Using cell phone data to measure quality of service and passenger flows of Paris transit system. Transportation Research Part C: Emerging Technologies, 43, 198–211.
- Alexander, L., Jiang, S., Murga, M., & González, M. C. (2015). Origin-destination trips by purpose and time of day inferred from mobile phone data. Transportation Research Part C: Emerging Technologies, 58(Part B), 240–250.
- Altshuler, A., & Luberoff, D. (2003). Mega-projects. Washington, DC: Brookings Institution.
- Barabino, B., Di Francesco, M., & Mozzoni, S. (2014). An offline framework for handling automatic passenger counting raw data. IEEE Transactions on Intelligent Transportation Systems, 15(6), 2443–2456.
- Batley, R., Dagray, J., & Wardman, M. (2011). The impact of lateness and reliability on passenger rail demand. Transportation Research Part E: Logistics and Transportation Review, 47, 61–72.
- Bianchi, F. M., Rizzi, A., Sadeghian, A., & Moiso, C. (2016). Identifying user habits through data mining on call data records. Engineering Applications of Artificial Intelligence, 54, 49–61.
- Boyle, D. B. (1998). Passenger counting technologies and procedures. TCRP synthesis of transit practice 29. Washington, DC: Transportation Research Board National Academy Press.
- Bughin, J. (2016). Reaping the benefits of Big Data in telecom. Journal of Big Data, 3(1).
- Bull-Berg, H., Olsson, N., & Sørensen, A. (2017). Mobiltelefondata – Potensiell datakilde i evaluering av jernbaneutbygginger? (Progress report). Trondheim: Concept Research Program, NTNU. Retrieved from https://www.ntnu.no/documents/1261860271/1262021752/Rapport+pilot+big+data_+ENDELIG.pdf/81ab8e79-04e0-4c18-8639-87dfe1ad6970?version=1.0
- Calabrese, F., Di Lorenzo, G., Lui, L., & Ratti, C. (2011). Estimating origin-destination flows using mobile phone location data. IEEE Pervasive Computing, 10(4), 36–44.
- Chaudhary, M., Bansal, A., Bansal, D., Raman, B., Ramakrishnan, K. K., & Aggarwal, N. (2016, January). Finding occupancy in buses using crowdsourced data from smartphones. Proceedings of the 17th international conference on distributed computing and networking (p. 35). Article No. 35 Singapore, Singapore: ACM.
- Chen, S., Leng, Y., Mao, B., & Liu, S. (2014). Integrated wight-based multi-criteria evaluation on transfer in large transport terminals: A case study of the Beijing south railway station. Transportation Research Part A: Policy and Practice, 66, 13–26.
- Choi, J., Lee, Y. J., Kim, T., & Sohn, K. (2011). An analysis of metro ridership at the station-to-station level in Seoul. Transportation, 39(3), 705–722.
- Chu, K. A., & Chapleau, R. (2008). Enriching archived smart card transaction data for transit demand modeling. Transportation Research Record: Journal of the Transportation Research Board, 2063, 63–72.
- Chu, X. (2010, December). A guidebook for using automatic passenger counter data for national transit database (NTD) reporting. Tampa: National Center for Transit Research at CUTR. University of South Florida. http://www.nctr.usf.edu/wp-content/uploads/2011/03/77803.pdf
- Cottrill, C. D., & Derrible, S. (2015). Leveraging Big Data for the development of transport sustainability indicators. Journal of Urban Technology, 22(1), 45–64.
- Cristogiannis, E., & Pyrgidis, C. (2014). Investigation of the impact of traffic composition on the economic profitability of a new railway corridor. Proceedings of the Institution of Mechanical Engineers, Part F: Journal of Rail and Rapid Transit, 228(4), 389–401.
- De Mauro, A., Greco, M., & Grimaldi, M. (2016). A formal definition of big data based on its essential features. Library Review, 65(3), 122–135.
- De Oña, R., Eboli, L., & Mazzulla, G. (2014). Key factors affecting rail service quality in the Northern Italy: A decision tree approach. Transport, 29, 75–83.
- Dlamini, N. G. (2011). The environmental impacts of various rail passenger ticketing options in Japan. Transportation Research Part D: Transport and Environment, 16, 365–371.
- Doi, M., & Allen, W. B. (1986). A time series analysis of monthly ridership for an urban rail rapid transit line. Transportation, 13(3), 257–269.
- Doyle, J., Hung, P., Kelly, D., McLoone, S., & Farrell, R. (2011, June 23-24). Utilising mobile phone billing records for travel mode discovery. In ISSC 2011. Dublin: Trinity College.
- Fiosina, J., Fiosins, M., & Müller, J. P. (2013). Big data processing and mining for next generation intelligent transportation systems. Journal Teknologi, 63(3), 21–38.
- Flyvbjerg, B., Bruzelius, N., & Rothengatter, W. (2003). Megaprojects and risk: An anatomy of ambition. Cambridge, UK: Cambridge University Press.
- Fowkes, A. S., Nash, C. A., & Whitening, A. E. (1985). Understanding trends in inter-city rail traffic in Great Britain. Transport Planning and Technology, 10, 65–80.
- Frias-Martinez, V., Soguero, C., & Frias-Martinez, E. (2012). Estimation of urban commuting patterns using cellphone network data. Proceedings of the ACM SIGKDD international workshop on urban computing (pp. 9–16). Beijing, China: ACM
- Frumin, M. S. (2010). Automatic data for applied railway management: Passengerdemand, service quality measurement, and tactical planning onthe London overground network ( Doctoral Dissertation). Department of Civil and Environmental Engineering and the Operations Research Center. Cambridge: Massachusetts Institute of Technology.
- Green, A. (2017). Technology and digitalisation at forefront of freight development. International Railway Journal, 57(7), 50. https://urn.nb.no/URN:NBN:no-nb_digibok_2008071400110
- Gundlegård, D., Rydergren, C., Breyer, N., & Rajna, B. (2016). Travel demand estimation and network assignment based on cellular network data. Computer Communications, 95, 29–42.
- Henry, C., & Grant, S. (2012, April 17–19). Implementing new automated ticketing technology at Virginia railway express. Paper No. JRC2012-74054. In 2012 joint rail conference (pp. 449–454). Philadelphia, PA: American Society of Mechanical Engineers.
- Higuchi, T., Yamaguchi, H., & Higashino, T. (2015). Mobile devices as an infrastructure: A survey of opportunistic sensing technology. Journal of Information Processing, 23, 94–104.
- Hilbert, M. (2013, September 17). Big Data for development: From information to knowledge societies. Retrieved from http://ssrn.com/abstract=2205145
- Holleczek, T., Yu, L., Lee, J. K., Senn, O., Ratti, C., & Jaillet, P. (2014). Detecting weak public transport connections from cellphone and public transport data. Proceedings of the 2014 international conference on big data science and computin (p. 9). Beijing, China: ACM.
- Iqbal, M. S., Choudhury, C. F., Wang, P., & González, M. C. (2014). Development of origin–Destination matrices using mobile phone call data. Transportation Research Part C: Emerging Technologies, 40, 63–74.
- Jánošíková, Ĺ., Kavička, A., & Bažant, M. (2014). Optimal operation scheduling and platform track assignment in a passenger railway station. Proceedings of the Institution of Mechanical Engineers, Part F: Journal of Rail and Rapid Transit, 228(3), 271–284.
- Jarv, O., Ahas, R., Saluveer, E., Derudder, B., & Witlox, F. (2012). Mobile phones in a traffic flow: A geographical perspective to evening rush hour traffic analysis using call detail records. PloS one, 7, 11.
- Kežić, M. E. L., & Durango-Cohen, P. L. (2018, July 4). New ridership for old rail: An analysis of changes in the utilization of Chicago’s urban rail system, 1990–2008. Research in Transportation Economics, 71, 17–26.
- Kujala, R., Aledavood, T., & Saramäki, J. (2016). Estimation and monitoring of city-to-city travel times using call detail records. EPJ Data Science, 5(1), 6.
- Larijani, A. N. M., Olteanu-Raimond, A.-M., Perret, J., Brédif, M., & Ziemlicki, C. (2015). Investigating the mobile phone data to estimate the origin destination flow and analysis; case study: Paris region. Transportation Research Procedia, 6, 64–78.
- Lee, J. G., & Kang, M. (2015). Geospatial big data: Challenges and opportunities. Big Data Research, 2(2), 74–81.
- Leo, Y., Busson, A., Sarraute, C., & Fleury, E. (2016). Call detail records to characterize usages and mobility events of phone users. Computer Communications, 95, 43–53.
- Mabrouk, A. B., & Zagrouba, Z. (2018). Abnormal behavior recognition for intelligent video surveillance systems: A review. Expert Systems with Applications, 91, 480–491.
- Maskeliūnaitė, L., & Sivilevičius, H. (2012). Expert evaluation of criteria describing the quality of travelling by international passenger train: Technological, economic and safety perspectives. Technological and Economic Development of Economy, 18(3), 544–566.
- Maskeliūnaitė, L., & Sivilevičius, H. (2014). The model for evaluating the criteria describing the quality of the trip by international train. Technological and Economic Development of Economy, 20(3), 484–506.
- Nielsen, B. F., Frølich, L., Nielsen, O. A., & Filges, D. (2014). Estimating passenger numbers in trains using existing weighing capabilities. Transportmetrica A: Transport Science, 10(6), 502–517.
- Nilsson, J. E., Nyström, J., & Pyddoke, R. (2012). Före och efter - uppföljing av en jäernvägsinvestering i Oslo (VTI noteat 38-2012). Stockholm: The Swedish National Road and Transport Research Institute (VTI). Retrieved from https://www.vti.se/sv/Publikationer/Publikation/fore-och-efter_669292
- OECD. (2002). No. 6: Glossary of key terms in evaluation and results based management. Paris: Organisation for Economic Co-operation and Development.
- Olsson, N. O., & Bull-Berg, H. (2015). Use of big data in project evaluations. International Journal of Managing Projects in Business, 8(3), 491–512.
- Paha, J., Rompf, D., & Warnecke, C. (2013). Customer choice patterns in passenger rail competition. Transportation Research Part A: Policy and Practice, 50, 209–227.
- Parkinson, H. J., & Bamford, G. (2016). The potential for using big data analytics to predict safety risks by analyzing rail accidents. In 3rd international conference on railway technology: research, development and maintenance (pp. 5–8). Cagliari, Sardinia, Italy.
- Parthasarathi, P., & Levinson, D. (2010). Post-construction evaluation of traffic forecast accuracy. Transport Policy, 17(6), 428–443.
- Pentland, A. (2012). Society’s nervous system: Building effective government, energy, and public health systems. IEEE Computer, 45, 31–38.
- Pieriegud, J. (2018). Digital transformation of railways. Retrieved from https://shift2rail.org/wp-content/uploads/2018/04/DIGITAL_TRANSFORMATION_RAILWAYS_2018_web.pdf
- Polzin, S. E., & Page, O. A. (2003, November). Ridership trends of new start rail projects. In Transportation research circular E-C058: Experience, economics, and evolution – from starter lines to growing systems. 9th national light rail transit conference (pp. 319–337). Portland, OR.
- Saponara, S., Pilato, L., & Fanucci, L. (2016). Exploiting CCTV camera system for advanced passenger services on-board trains. In Smart cities conference (ISC2), 2016 IEEE international (pp. 1–6). Trento: IEEE.
- Scriven, M. (1991). Evaluation thesaurus (4th ed.). Thousand Oaks, CA: Sage.
- Small, K. A. (1999). Project evaluation. Essays in transportation economics and policy: A handbook in honor of John R. Meyer, eds. by Gómez-Ibáñez, J. A., Tye, W. B. and Winston, C.: VI, 577 s. Washington, DC: Brookings Institution Press.
- Stasko, T., Levine, B., & Reddy, A. (2016). Time-expanded network model of train-level subway ridership flows using actual train movement data. Transportation Research Record: Journal of the Transportation Research Board, (2540), 92–101. doi:10.3141/2540-11
- Stenneth, L., Wolfson, O., Yu, P. S., & Xu, B. (2011). Transportation mode detection using mobile phones and GIS information. Proceedings of the 19th ACM SIGSPATIAL international conference on advances in geographic information systems (pp. 54–63). Chicago, IL: ACM.
- Tanaka, M. (2015). Prospective study on the potential of Big Data. Quarterly Report of RTRI, 56(1), 5–9.
- Teknisk Ukeblad (2014, January 29). Matematiske verktøy skal gi kortere stop på togstasjonene. http://www.tu.no/artikler/matematisk-verktoy-skal-gi-kortere-stopp-pa-togstasjonene/224974
- Toole, J. L., Colak, S., Sturt, B., Alexander, L. P., Evsukoff, A., & González, M. C. (2015). The path most traveled: Travel demand estimation using big data resources. Transportation Research Part C: Emerging Technologies, 58, 162–177.
- Tute, R. (2018). How advancing technology is allowing network rail to view rail like never before. Retrieved from http://www.infrastructure-intelligence.com/article/jan-2018/how-advancing-technology-allowing-network-rail-view-rail-never
- Vigren, A. (2017). Competition in public transport: Essays on competitive tendering and open-access competition in Sweden ( Doctoral thesis, comprehensive summary). Stockholm: KTH Royal Institute of Technology.
- Volden, G. H., & Samset, K. (2013). Etterevaluering av statlige investeringsprosjekter. Konklusjoner, erfaringer og råd basert på pilotevaluering av fire prosjekter (Concept Report No. 30). Norwegian University of Science and Technology University. Retrieved from http://www.concept.ntnu.no/Publikasjoner/Rapportserie/Nr.%2030_webutgave30_norsk.pdf
- Vuchic, V. R. (2005). Urban transit. Operations, planning and economics. Hoboken, NJ: John Wiley and Sons.
- Vuchic, V. R., & Newell, G. F. (1968). Rapid transit interstation spacings for minimum travel time. Transportation Science, 2(4), 303–339.
- Wang, H., Calabrese, F., Di Lorenzo, G., & Ratti, C. (2010, September). Transportation mode inference from anonymized and aggregated mobile phone call detail records. 2010 13th International IEEE Conference on Intelligent Transportation Systems (ITSC) (pp. 318–323). Funchal: IEEE.
- Wang, W., Attanucci, J. P., & Wilson, N. H. (2011). Bus passenger origin-destination estimation and related analyses using automated data collection systems. Journal of Public Transportation, 14(4), 131–150.
- Xu, Y., Shaw, S.-L., Fang, Z., & Yin, L. (2016). Estimating potential demand of bicycle trips from mobile phone data – an anchor-point based approach. ISPRS International Journal of Geo-Information, 5(8), 131.
- Zachariassen, E. (2014, January 29). Matematiske verktøy skal gi kortere stopp på togstasjonene. Teknisk Ukeblad. Retrieved from https://www.tu.no/artikler/matematisk-verktoy-skal-gi-kortere-stopp-pa-togstasjonene/224974
- Zheng, X., Chen, W., Wang, P., Shen, D., Chen, S., Wang, X., … Yang, L. (2016). Big Data for social transportation. IEEE Transactions on Intelligent Transportation Systems, 17(3), 620–630.