
 ?Mathematical formulae have been encoded as MathML and are displayed in this HTML version using MathJax in order to improve their display. Uncheck the box to turn MathJax off. This feature requires Javascript. Click on a formula to zoom.
ABSTRACT
A fundamental requirement for successful and effective public transportation planning is analyzing and understanding the factors that affect demand. This is particularly important for fast-growing and car-dependent cities with a high influx of visitors, such as Makkah City in Saudi Arabia. In this study, some factors that affect public transportation demand in Makkah were analyzed, and a geographic information system–based composite public transportation demand index (CPTDI) was established. Indicators of public transportation demand were placed in three groups defining social need, network need, and land use. These indicators were combined into the CPTDI to define the overall public transportation demand at the district level. When applied to actual data, the indicators demonstrated that high public transportation demand was concentrated in the inner districts surrounding the Holy Mosque within the first ring road and the main arterials leading toward it. The CPTDI was found to depict the public transportation demand distribution in a realistic manner when compared with the separate indicators. The CPTDI would facilitate faster and more efficient public transportation planning based on demand and improve understanding of the consequences of system planning and implementation.
1. Introduction
An effective and efficient transportation service for all residents is vital for cities. Transportation has a fundamental role in the development and dynamics of a city by providing mobility for people and goods (Meyer & Miller, Citation2001). With increased urbanization and the growing demand for transportation, providing an efficient transportation system is an essential concern, particularly for fast-growing cities in emerging and developing countries (Bubeck et al., Citation2014). Public transportation is an essential mode of daily travel in large cities (Li & Preston, Citation2015). It meets the mobility needs of several social groups in cities, including the elderly, minorities, and the disabled (Hanson & Giuliano, Citation2004). It is also vital for social inclusion and accessibility to major activities and services (Lau, Citation2013; Lucas, Citation2010). It can eliminate the social, economic, and environmental consequences of personal vehicles in cities (IPCC, Citation2014). Public transportation is available for use by a wide range of socioeconomic groups and can mitigate the high cost, environmental consequences, and increasing traffic volume of private vehicles in cities (Tribby & Zandbergen, Citation2012).
Public transportation planning is a complex and multifaceted task (Welch & Mishra, Citation2013). Although many cities around the world, have promoted the provision of efficient public transportation, few have succeeded in rising public transport’s mode daily trip share (Buehler & Pucher, Citation2012). Even though many incentives have been applied to increase the use of public transportation, the main concerns are the availability and accessibility of public transportation infrastructure for potential riders (Yao, Citation2007). Public transportation has been struggling to compete with cars (Buehler & Pucher, Citation2012). The affordability of cars increases with income levels, which in turn increases the rate of car ownership. In conjunction with land use patterns and the decentralization of urban activities into suburban and exurban areas, this has led to many challenges and difficulties for realizing efficient and effective public transportation services (Buehler & Pucher, Citation2012). Accordingly, the planning of public transportation needs to be improved so that the service can effectively compete with other modes (Garrido et al., Citation2014). Thus, measuring and analyzing the effectiveness of public transportation is vital for evaluating policy objectives and planning for the future (Murray & Davis, Citation2001).
Identifying public transportation demand in cities is a complex process that is affected by several factors (Tu et al., Citation2018). Defining these factors is a fundamental requirement for successful planning. Planners and policymakers need to define these factors and understand the variation in public transportation demand and need within a city (Balcombe et al., Citation2004). This is particularly true for fast-growing cities with high rates of private vehicle ridership. Although several studies have tried to define these factors, few have focused on fast-growing cities with high car dependency. In fact, there is little empirical evidence available for defining and quantifying public transportation demand factors to understand their magnitudes and effects in such cities. This is critical because a lack of such information can prevent social inclusion and efficient land use integration (Buehler & Pucher, Citation2012; Jaramillo et al., Citation2012).
The provision of an effective and efficient public transportation system is a major priority for the main cities of Saudi Arabia, such as Riyadh, Jeddah, and Makkah. It has received significant attention in recent strategic plans, such as Saudi Vision 2030 and the National Transport Strategy. In particular, transportation in Makkah received a high level of attention in Vision 2030 (Vision Citation2030: Kingdom of Saudi Arabia, 2016). Makkah Public Transport Program was also launched which envision future integrated metro and service bus services in Makkah (AlGadhi, Citation2014). In fact, the rapid population growth of residents and visitors (pilgrims) has caused notable pressure on the existing transportation system and mobility of people and goods in the Holy City (MMM Group and Moriyama & Teshima Planners & Transport Plan Volume, Citation2011). The current transportation situation in Makkah has numerous problems and issues, such as traffic congestion, a high share of private vehicles, lack of alternative means of transportation, lack of sufficient parking, and mixed traffic. To solve these issues, an effective and efficient public transportation system is required. However, analyses on public transportation provision and demand for major Saudi cities have been lacking. Moreover, few studies have analyzed the factors that affect public transportation demand in Saudi cities. In this study, the factors that affect public transportation demand in Makkah were analyzed, and a geographic information system (GIS)-based composite public transportation demand index (CPTDI) was established.
2. Methodology
2.1. Study area
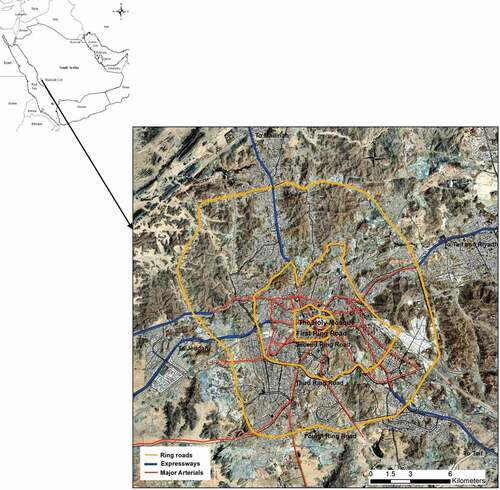
As shown in , Makkah City is located in southwest Saudi Arabia. It has about 1.6 million residents and attracts significant numbers of international and local visitors because it is considered the religious capital of the Islamic world (Ajbar & Ali, Citation2015). Over the years, Makkah has experienced a remarkable increase in population due to immigration as well as an influx of pilgrims and visitors. The number of pilgrims increased dramatically from about 1.8 million in 1995 to about 3 million in 2018; the number of visitors also increased dramatically from about 5 million in 2009 to about 19 million in 2018, and it is expected to reach 30 million in 2030 (GASTAT & Hajj Statistics Citation2019, 2019). This huge influx of people has placed enormous demands on the transportation system (Currie & Shalaby, Citation2012). A unique challenge in Makkah is the high dependency on private cars with a rate of about 83% and low dependency on public transportation at about 2% (AlGadhi, Citation2014). The inefficient public transportation system forces most of the population and visitors to depend on private cars or taxis (Ascoura, Citation2013). Congestion during peak hours causes many bottlenecks and inhibits the movement of people and goods (Ascoura, Citation2013). Thus, there is a need for better public transportation planning in Makkah. In this study, the factors that affect public transportation demand in Makkah were analyzed and used to establish a GIS-based CPTDI. The study area covered most of the urban areas of Makkah.
Figure 1. Location of Makkah City
2.2. Public transportation demand factors
Analyzing public transportation demand is a complex process that is affected by several factors, such as socioeconomic (Currie, Citation2004, Citation2010; Greer & Van Campen, Citation2011; Murray & Davis, Citation2001), spatial and land use planning (Buehler & Pucher, Citation2012; Hrelja, Citation2015; Putman, Citation2013), and the transportation network (Derrible & Kennedy, Citation2010; Ingvardson & Nielsen, Citation2018; Yao, Citation2007). Several indicators have been developed to quantify public transportation demand. Socioeconomic indicators include the household income, unemployment rate, average family size, car ownership, proportion of elderly, and proportion of students (Currie, Citation2004, Citation2010; Murray & Davis, Citation2001; Yao, Citation2007). Spatial and land use planning indicators include the population density, job density, and land use (Gutiérrez et al., Citation2011; Ingvardson & Nielsen, Citation2018; Yao, Citation2007). Transportation network indicators include the density of public transit stops, network coverage, and accessibility (Derrible & Kennedy, Citation2010; Ingvardson & Nielsen, Citation2018; Yao, Citation2007). In this study, the public transportation demand in Makkah was defined according to three groups of indicators defining social need, network need, and land use.
2.2.1. Social need indicators
Defining social need is crucial to the analysis of public transportation demand. Based on the social characteristics and data availability in Makkah, three social need indicators were developed: the population density (PDI), car ownership (COI), and family size (FSI), as given in . The social need indicators were analyzed for 59 districts, which cover the entire urban authority of Makkah. Social data were collected at the district level, which is an urban administrative unit (Makkah Urban Observatory, Citation2013). A consistent weighting approach was used to assess the social need for public transportation in each district () based on the available data (Makkah Urban Observatory, Citation2013). Each social indicator was weighted as follows: high (3), moderate (2), or low (1). These represented the social need for public transportation. The weights were used to normalize the indicator values for GIS analysis. The weights were set according to the available data, secondary sources, and characteristics of the study area.
Table 1. Social need indicators
2.2.2 Network need indicators
Two indicators were defined for the network need: coverage and congestion.
2.2.2.1. Coverage indicator (CovI)
The coverage indicator (CovI) measures the public transportation service coverage at the district level. It was used to consider the current public transportation routes in Makkah, and it is calculated as follows:
where is the coverage indicator for district
,
is the coverage area in square meters for district
, and
is the area of district
in square meters. As shown in , the public transportation services of Makkah comprise a bus system with five main service lines (Saudi Arabia Public Transport Company (SAPTCO),(Citation2019), 2019)covering a total distance of about 56 km.
Figure 2. Public transport service lines in Makkah
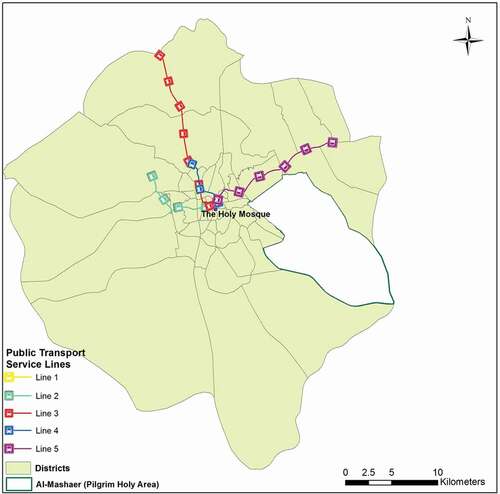
GIS was used to perform a spatial proximity analysis of the five service lines. A buffer analysis was performed to determine the proximity of Makkah residents to the service lines. First, the appropriate walking distance to the service was defined. Guidelines for network and service planning often suggest a standard distance of 400–800 m (Daniels & Mulley, Citation2013). Armstrong-Wright and Thiriez (Citation1987) suggested a minimum walking distance of 300–500 m and maximum walking distance of 800 m. The terrain elevation of Makkah ranges from 82 to 982 m above sea level (Mirza et al., Citation2011); thus, the buffer distance was minimized to 400 m.
A map of the Makkah districts was overlaid with the buffer zones generated in GIS. Then, the service coverage of the current public transportation system was calculated. Based on the trail-and-error approach, the results were classified as high coverage (>75%), moderate coverage (50%–75%), and low coverage (<50%). Finally, each coverage class was given an absolute score (high = 3, moderate = 2, and low = 1) to standardize the CovI values.
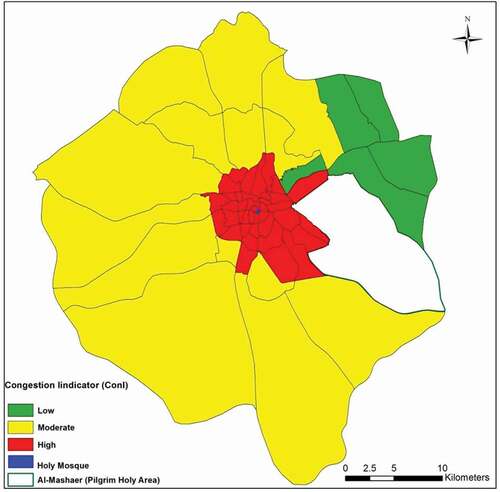
2.2.2.2. Congestion indicator (ConI)
The congestion indicator (ConI) measures congestion at the district level, and it was used to consider the congestion of ring roads, expressways, major arterials, and arterials in Makkah. It is calculated in term of the volume to capacity ratio of a district:
where is the congestion indicator for district
,
is the volume/capacity ratio of expressways, major arterials, and arterial links for district
, and
is the total number of expressways, major arterials, and arterial links for district
.
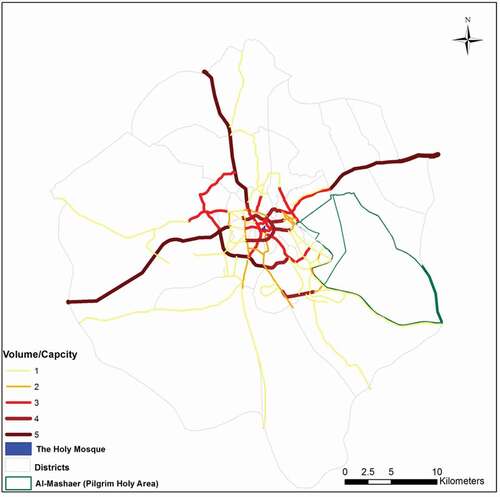
As shown in , the input data consisted of a volume-to-capacity ratio map of expressways, major arterials, and arterials in Makkah (MMM Group and Moriyama & Teshima Planners & Transport Plan Volume, Citation2011) and the administrative boundaries of each district. ConI was calculated through GIS spatial analysis, and the results were classified as follows: high congestion (V/C > 1), moderate congestion (0.8 ≤ V/C ≤ 1), and low congestion (V/C < 0.8). These classes were given absolute scores (high = 3, moderate = 2, and low = 1) to standardize the ConI values.
Figure 3. Volume to capacity ratio (based on: MMM Group and Moriyama & Teshima Planners & Transport Plan Volume, Citation2011)
2.2.3. Land use indicators
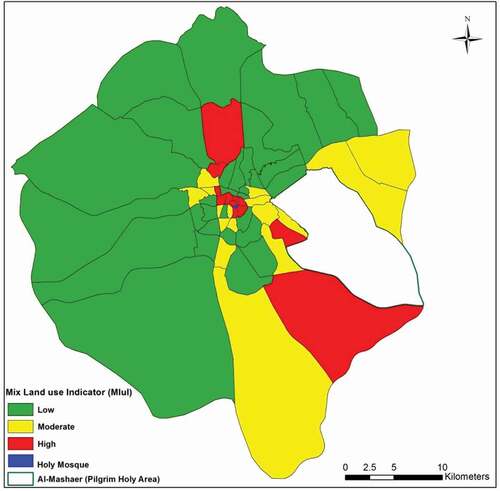
Land use plays a vital role in defining public transportation demand. Compact and mixed-use developments encourage public transportation (Buehler & Pucher, Citation2012). Moreover, the integration of public transportation planning and development with land use planning ensures effective public transportation functionality and capacity (Hrelja, Citation2015). Accordingly, a mixed land use indicator (MluI) was designed to measure the degree of mixed land uses per district.
2.2.3.1. Mixed land use indicator (
MluI represents the percentage of mixed land use in a district, which includes commercial, administrative services, education services, health services, hotels and pilgrim housing, public facilities, and future proposed services; to the entire land use area in a district as follows
where is MluI for district
,
is the total area with mixed land use in district
, and
is the entire land use area for district
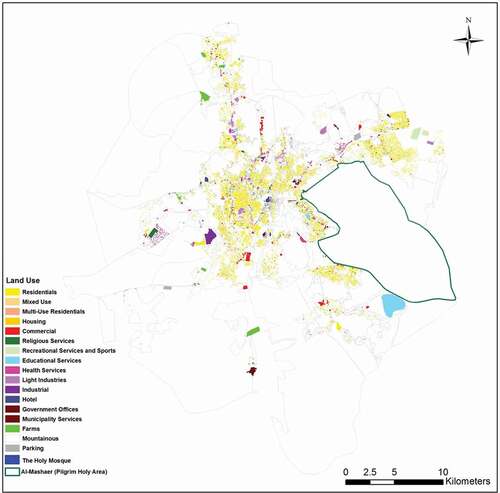
. GIS spatial analysis was employed on a digital land use map of Makkah to calculate this indicator for each district, as shown in . Based on the trail-and-error approach, the results were classified as high (
> 0.3), moderate (0.2 ≤
≤ 0.3), and low (
< 0.2). These classes were assigned absolute scores (high = 3, moderate = 2, and low = 1) to standardize the MluI values.
Figure 4. Makkah land use map
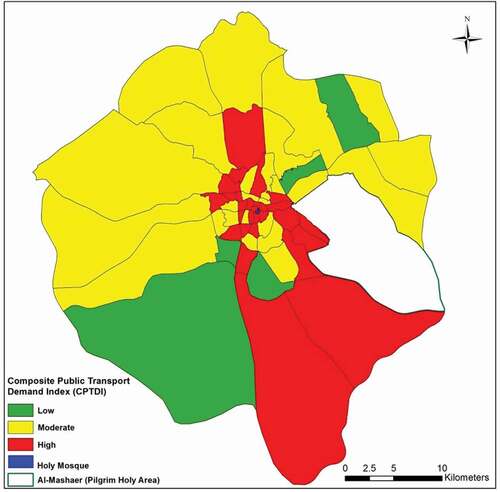
2.2.4. Composite public transportation demand index (CPTDI)
CPTDI combines the indicators described above to provide the overall public transportation demand at the district level. This should enable effective and efficient planning and development of the public transportation system in Makkah. CPTDI is calculated in GIS as follows:
where is a social need indicator,
is a network need indicator, and
is a land use indicator.
are the weights allocated to each indicator. In this study,
,
, and
. Although all three types of indicators affect public transportation demand, land use was considered to have more influence in Makkah.
is calculated as follows:
where is the total number of SNIs.
is calculated as follows:
comprises solely of MluI. Finally, based on the trail-and-error approach, CPTDI is quantified as follows: high demand (CPTDI > 2), moderate demand (1.65 < CPTDI ≤ 2), and low demand (CPTDI ≤ 1.65).
3. Results
3.1. Social need indicators
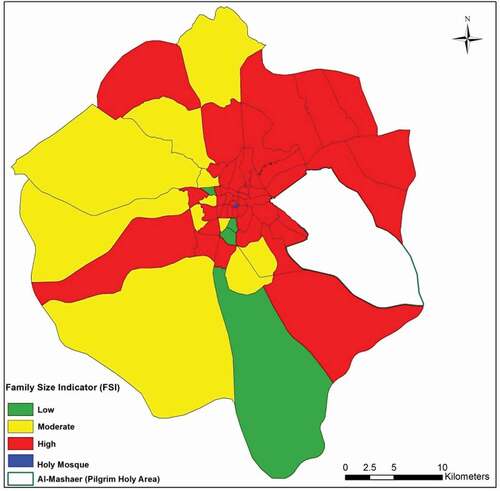
and depict the results of the developed SNIs. shows the PDI results. High and moderate PDI values are concentrated in the inner districts surrounding the Holy Mosque. Although most of Makkah seems to have low PDI values, these are distributed in the outer districts, which are also larger geographically. The districts with high and moderate PDI values include almost 49% of the total population. depicts the COI results. High COI values covered almost 43% of the population in Makkah and were concentrated in the districts surrounding the Holy Mosque between the second and third ring roads. Moderate COI values were distributed throughout the city in nine districts covering about 17% of the population. Low COI values were concentrated in districts within the first ring road and north of the city. shows the FSI results. High FSI values were observed throughout Makkah covering about 72% of the population. Moderate FSI values were clustered on the outer west side of Makkah covering a population of about 21%. Low FSI values were in only four districts and covered about 7% of the total population in a dispersed pattern.
Table 2. Indicators of public transportation demand in Makkah City
Figure 5. PDI results
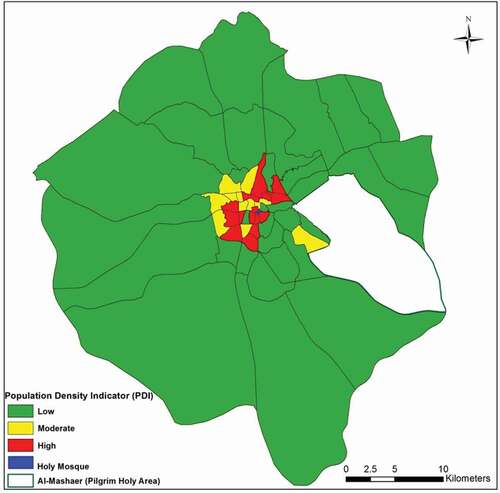
Figure 6. COI results
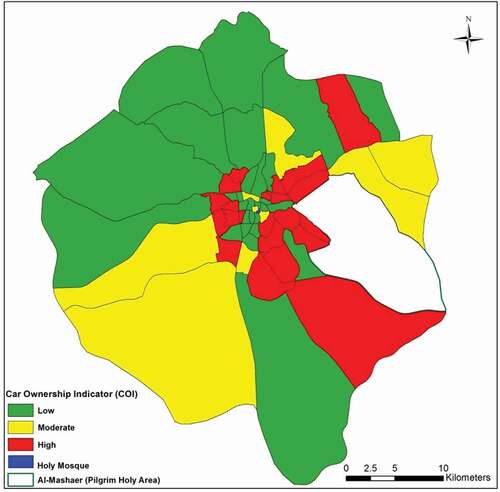
Figure 7. FSI results
3.2. Network need indicators
The NNI results are given in and . shows the CovI results. High CovI values were observed all over the city and covered about 75% of the population. Moderate and low CovI values were clustered in districts north of the Holy Mosque, and they covered about 21% and 4%, respectively, of the total population. The CovI results demonstrated significant deficiencies in the current public transportation system. shows the ConI results. High ConI values were clustered in districts surrounding the Holy Mosque up to the third ring road covering about 62% of the total population. Moderate ConI values were dominant in districts outside the third ring road in all directions and covering about 25% of the total population. Low ConI values were only observed in five districts covering about 13% of the total population and clustered in the outer east side of the city. The ConI results indicated serious traffic issues throughout Makkah.
Figure 8. CovI results
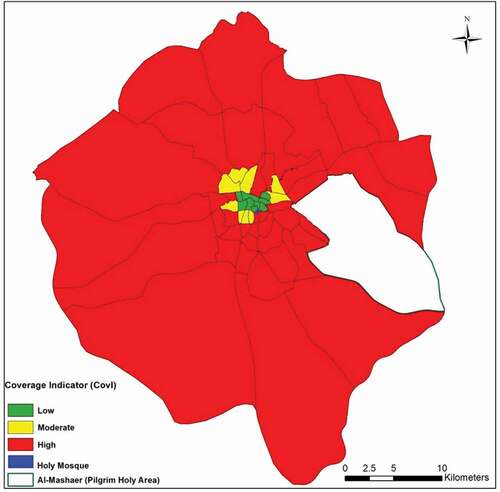
Figure 9. ConI results
3.3. Land use indicators
The MluI results are presented in and . High and moderate MluI values were concentrated in the inner districts surrounding the Holy Mosque within the first ring road and dispersed toward the south direction outside this ring road. The high and moderate MluI values were observed in 28 districts representing about 40% of the total population. Low MluI values were dominant in 31 districts covering about 60% of the total population. However, they were only distributed in the outer districts, which are mostly residential, vacant land, and mountains.
Figure 10. MluI results
3.4. Composite Public Transportation Demand Index (CPTDI)
The CPTDI results are given in and . High CPTDI values were observed in 33 districts covering 55% of the total population. These districts were concentrated in the inner districts surrounding the Holy Mosque within the first ring road and on the main arterials toward it. Moderate CPTDI values were dominant in districts outside the third ring road towards the north, east, and west covering about 34% of the total population. Low CPTDI values were observed for only five districts covering about 11% of the total population in a dispersed pattern 2. The CPTDI results seem to depict a realistic public transportation demand distribution, which can facilitate efficient and effective public transportation planning based on demand.
Figure 11. CPTDI results
4. Discussion
In this study, the factors that affect public transportation demand in Makkah City were analyzed, and a GIS-based CPTDI was developed. The SNI results showed different spatial and demand patterns. PDI did not seem to reflect the public transportation demand of Makkah both by the percentage of population and spatial distribution. This may be related to the planning and development of the city, where the population density is concentrated in the inner districts as well as the modifiable areal unit problem (MAUP) (Lee et al., Citation2019). PDI must not be used separately but in conjunction with other indicators to evaluate public transportation demand (Yigitcanlar et al., Citation2007). COI and FSI were dominated by high and moderate values but had different spatial distribution patterns.
The NNI results show similarly high public transportation demand. Both the ConI and CovI results depicted consistently high and moderate public transportation demands but with different spatial patterns. The CovI results indicated a severe deficiency in the current public transportation system. Although other studies have considered this indicator as significant for public transportation planning (Chen et al., Citation2018; Currie, Citation2010; Walker, Citation2008), it is only applicable in cities with effective coverage by the public transportation network. Thus, other NNIs such as ConI are needed to plan public transportation system in cities with low coverage like Makkah.
The MluI results showed high public transportation demand in the inner districts within the first ring road. Although the districts with high and moderate demand were fewer than the districts with low demand, MluI represents the degree of mixed land use. This is very important for effective public transportation planning (Buehler & Pucher, Citation2012; Hrelja, Citation2015). This is particularly important in Makkah, which has a large continuous influx of visitors who increase the public transportation demand on the city. Thus, MulI represents a significant effect on cities such as Makkah, and it must not be neglected in the planning of a new system or improving the current system.
The CPTDI results presented a realistic public transportation demand distribution because this index included the main influencing factors. When compared with the separate indicators, it depicts a realistic distribution that can be used to facilitate planning for a public transportation system in Makkah. The CPTDI results showed high public transportation demand concentrated in the inner districts surrounding the Holy Mosque within the first ring road and on the main arterials toward it.
Based on the results of this study, the following planning and policy recommendations are proposed to realize an efficient and effective public transportation system in Makkah. The coverage of the public transportation system should be increased while considering the SNIs, NNIs, and MLuI in an integrated manner. The public transportation system should be planned as a radial system where the Holy Mosque is the focal point and is connected with districts identified as having high public transportation demand. PDI must be considered in conjunction with other SNIs, and CovI must be considered with other NNIs when planning a new system or improving the current system. Moreover, public transportation planning must be integrated with land use planning.
5. Conclusion
In this study, the factors that affect public transportation demand in Makkah City were analyzed, and a GIS-based CPTDI was developed. In the analysis results, SNIs depicted different spatial patterns of public transportation demand, whereas NNIs showed consistently high and moderate demand with different spatial patterns. MluI depicted a dispersed spatial pattern with high public transportation demand concentrated in the inner districts. CPTDI depicted a realistic public transportation demand distribution when compared with the separate indicators. This index depicted high demand concentrated in the inner districts surrounding the Holy Mosque within the first ring road and on the main arterials toward it.
CPTDI is fast, flexible, spatially explicit, and includes the main factors that affect public transportation demand in cities. It can be a powerful tool for effectively determining the demand for and gaps in public transportation. Cities with inefficient public transportation systems require better planning. The results of this study can be used for fast and efficient public transportation planning based on demand. This will allow cities to consider the main factors that affect public transportation demand and better understand the consequences of system planning and implementation. The approach in this study can be flexibly adapted to other cities with an inefficient or no public transportation system by weighting the various factors differently.
Disclosure of potential conflicts of interest
No potential conflict of interest was reported by the author(s).
References
- Ajbar, A., & Ali, E. (2015). Prediction of municipal water production in touristic Mecca City in Saudi Arabia using neural networks. Journal of King Saud University – Engineering Sciences, 27(1), 83–91. https://doi.org/10.1016/j.jksues.2013.01.001
- AlGadhi, S. (2014). Makkah public transport program (MPTM) – Fact and challenges. Presented at the Arabian World Construction Summit, Dubai, UAE.
- Armstrong-Wright, A., & Thiriez, S. (1987). Bus services: Reducing costs, raising standards. (World Bank Technical Paper 68). Washington DC: World Bank Group.
- Ascoura, I. E. (2013). Impact of pilgrimage (hajj) on the urban growth of the Mecca. Journal of Educational and Social Research, 3(2), 255.
- Balcombe, R., Mackett, R., Paulley, N., Preston, J., Shires, J., Titheridge, H., Wardman, M., & White, P. (2004). The demand for public transport: A practical guide. (TRL Report 593). Transport Research Laboratory.
- Bubeck, S., Tomascheck, J., & Fahl, U. (2014). Potential for mitigating greenhouse gases through expanding public transport services: A case study of Gauteng Province, South Africa. Transportation Research Part D, 32, 57–69. https://doi.org/10.1016/j.trd.2014.07.002
- Buehler, R., & Pucher, J. (2012). Demand for public transport in Germany and the USA: An analysis of rider characteristics. Transport Reviews, 32(5), 541–567. https://doi.org/10.1080/01441647.2012.707695
- Chen, Y., Bouferguene, A., Li, H., Liu, H., Shen, Y., & Al-Hussein, M. (2018). Spatial gaps in urban public transport supply and demand from the perspective of sustainability. Journal of Cleaner Production, 195, 1237–1248. https://doi.org/10.1016/j.jclepro.2018.06.021
- Currie, G. (2004). Gap analysis of public transport needs: Measuring spatial distribution of public transport needs and identifying gaps in the quality of public transport provision. Transportation Research Record: Journal of the Transportation Research Board, 1895(1), 137–146. https://doi.org/10.3141/1895-18
- Currie, G. (2010). Quantifying spatial gaps in public transport supply based on social needs. Journal of Transport Geography, 18(1), 31–41. https://doi.org/10.1016/j.jtrangeo.2008.12.002
- Currie, G., & Shalaby, A. (2012). Synthesis of transport planning approaches for the world’s largest events. Transport Reviews, 32(1), 113–136. https://doi.org/10.1080/01441647.2011.601352
- Daniels, R., & Mulley, C. (2013). Explaining walking distance to public transport: The dominance of public transport supply. The Journal of Transport and Land Use, 6(2), 5–20. https://doi.org/10.5198/jtlu.v6i2.308
- Derrible, S., & Kennedy, C. (2010). The complexity and robustness of metro networks. Physica A: Statistical Mechanics and Its Applications, 389(17), 3678–3691. https://doi.org/10.1016/j.physa.2010.04.008
- Garrido, C., De Oña, R., & De Oña, J. (2014). Neural networks for analyzing service quality in public transportation. Expert Systems with Applications, 41(15), 6830–6838. https://doi.org/10.1016/j.eswa.2014.04.045
- GASTAT (2019). General Authority for Statistics (GASTAT), Hajj Statistics 2019.
- Greer, M. R., & Van Campen, B. (2011). Influences on public transport utilization: The case of Auckland. Journal of Public Transportation, 14(2), 51–68. https://doi.org/10.5038/2375-0901.14.2.3
- Gutiérrez, J., Cardozo, O. D., & García-Palomares, J. C. (2011). Transit ridership forecasting at station level: An approach based on distance-decay weighted regression. Journal of Transport Geography, 19(6), 1081–1092. https://doi.org/10.1016/j.jtrangeo.2011.05.004
- Hanson, S., & Giuliano, G. (2004). The geography of urban transportation (3rd ed. ed.). Guilford Press.
- Hrelja, R. (2015). Integrating transport and land-use planning? How steering cultures in local authorities affect implementation of integrated public transport and land-use planning. Transportation Research Part A: Policy and Practice, 74, 1–13. https://doi.org/10.1016/j.tra.2015.01.003
- Ingvardson, J. B., & Nielsen, O. A. (2018). How urban density, network topology and socio-economy influence public transport ridership: Empirical evidence from 48 European metropolitan areas. Journal of Transport Geography, 72, 50–63. https://doi.org/10.1016/j.jtrangeo.2018.07.002
- IPCC. (2014). Summary for policymakers. Climate change 2014: Mitigation of climate change – Transport. Working Group III: Mitigation of climate change. Intergovernmental Panel on Climate Change.
- Jaramillo, C., Lizárraga, C., & Grindlay, A. L. (2012). Spatial disparity in transport social needs and public transport provision in Santiago de Cali (Colombia). Journal of Transport Geography, 24, 340–357. https://doi.org/10.1016/j.jtrangeo.2012.04.014
- Lau, J. C. Y. (2013). Sustainable urban transport planning and the commuting patterns of poor workers in a historic inner city in Guangzhou, China. Habitat International, 39, 119–127. https://doi.org/10.1016/j.habitatint.2012.11.006
- Lee, S., Lee, M., Chun, Y., & Griffith, D. (2019). Uncertainty in the effects of the modifiable areal unit problem under different levels of spatial autocorrelation: A simulation study. International Journal of Geographical Information Science, 33(6), 1135–1154. https://doi.org/10.1080/13658816.2018.1542699
- Li, X., & Preston, J. (2015). Assessing the financial and social costs of public transport in differing operating environments and with endogenous demand. Transportation Planning and Technology, 38(1), 28–43. https://doi.org/10.1080/03081060.2014.976981
- Lucas, K. (2010, July). Transport and social exclusion: Where are we now? Presented at the 12th World Conference on Transport Research, Lisbon, Portugal.
- Makkah Urban Observatory. (2013). Districts indicators.
- Meyer, M. D., & Miller, E. J. (2001). Urban transportation planning (2nd ed. ed.). McGraw Hill.
- Mirza, M., Dawod, G., & Al-Ghamdi, K. (2011). Accuracy and relevance of digital elevation models for geomatics applications: A case study of Makkah Municipality, Saudi Arabia. International Journal of Geomatics and Geosciences, 1(4), 803–812.
- MMM Group and Moriyama & Teshima PlannersTransport Plan Volume. (2011). Comprehensive plan for Makkah and Mashaer. MMM Group.
- Murray, A. T., & Davis, R. (2001). Equity in regional service provision. Journal of Regional Science, 41(4), 577–600. https://doi.org/10.1111/0022-4146.00233
- Putman, S. H. (2013). Integrated urban models volume 1: Policy analysis of transportation and land use (RLE: The City). Routledge.
- Saudi Arabia Public Transport Company (SAPTCO). (2019), Transport services within cities-Makkah”. https://www.saptco.com.sa/Buses/Transport-Services-within-Cities/Internal-transport-routes.aspx April 1, 2019
- Tribby, C. P., & Zandbergen, P. A. (2012). High-resolution spatio-temporal modeling of public transit accessibility. Applied Geography, 34, 345–355. https://doi.org/10.1016/j.apgeog.2011.12.008
- Tu, W., Cao, R., Yue, Y., Zhou, B., Li, Q., & Li, Q. (2018). Spatial variations in urban public ridership derived from GPS trajectories and smart card data. Journal of Transport Geography, 69, 45–57. https://doi.org/10.1016/j.jtrangeo.2018.04.013
- Vision 2030: Kingdom of Saudi Arabia. (2016). https://vision2030.gov.sa/download/file/fid/417 [Accessed April 15, 2020].
- Walker, J. (2008). Purpose-driven public transport: Creating a clear conversation about public transport goals. Journal of Transport Geography, 16(6), 436e442. https://doi.org/10.1016/j.jtrangeo.2008.06.005
- Welch, T. F., & Mishra, S. A. (2013). Measure of equity for public transit connectivity. Journal of Transport Geography, 33, 29–41. https://doi.org/10.1016/j.jtrangeo.2013.09.007
- Yao, X. (2007). Where are public transit needed – Examining potential demand for public transit for commuting trips. Computers, Environment and Urban Systems, 31(5), 535–550. https://doi.org/10.1016/j.compenvurbsys.2007.08.005
- Yigitcanlar, T., Sipe, N., Evans, R., & Pitot, M. (2007). A GIS‐based land use and public transport accessibility indexing model. Australian Planner, 44(3), 30–37. https://doi.org/10.1080/07293682.2007.9982586