
ABSTRACT
To increase cycling shares through urban planning and development, planners need sound tools to assess the built environment. This article presents a methodology to qualitatively determine bikeability, the extent to which it is possible and pleasurable to bike in or through a given area. It is a holistic assessment of four categories of built environment characteristics that affect bikeability. An assessment follows an iterative process combining secondary data and registrations from maps, aerial photos and fieldwork. The methodology does not require specialised tools and is applicable to different urban contexts and purposes. Two examples are included to demonstrate possible uses: assessment of existing built environments to establish a knowledge base when developing short- and long-term cycling plans and strategies, and assessment of planned urban transformations for use in planning processes to ensure new urban developments with a high level of bikeability. Possible methodological improvements are identified. Surveys and interviews with cyclists can provide further understandings of local context. Geographical information systems can inform an assessment but require specialist knowledge, better datasets, and more empirical data on cycling and the built environment from various contexts. As new insights emerge, the methodology must be continually updated to remain valid and reliable.
1. Introduction
Increasing cycling shares is central in achieving a sustainable modal shift to reduce transport-related greenhouse gas emissions, and other negative externalities associated with everyday mobility (Gerike et al., Citation2019; Næss, Citation2012; Pucher & Buehler, Citation2017). In Norway, as in many countries, making people cycle more (e.g. longer and more frequently) is a longstanding goal (NMLGM, Citation2017; NPRA, Citation2012) and is included in the national Zero-Growth Objective, stating that increased transport demand caused by rapid population growth in major cities should be taken up by walking, cycling, and public transport (rather than growth in traffic volumes) (NMLGM, Citation2017; NMT, Citation2020; NMTC, Citation2013, Citation2017). National authorities, counties and municipalities are to follow up and realise these objectives through the planning and development of land use and transport systems that facilitate and enhance sustainable travel behaviour. To identify efficient interventions suited to the context, they must have sound knowledge of the current situation, including built environment barriers and opportunities for cycling. This, in turn, requires good assessment tools that are adaptable to different settings and scales. This article is a methodological contribution to qualitative assessments related to the built environment and cycling. The methodology is suited to evaluate the bikeability of a stretch, a neighbourhood in a city, and other smaller or larger built-up areas, exploring the immediate surroundings through which a person cycles and the preconditions for the trip as established by the larger urban context.
If more people are to opt for cycling, it must be seen as a realistic and attractive modal option by the broader population (Heinen et al., Citation2010; Krizek et al., Citation2009; Rynning, Citation2018; Stefansdottir, Citation2014). To achieve this, cycling must be facilitated in ways that accommodate all ‘types’ of cyclists, from the experienced and fearless to the inexperienced and risk averse (Dill & McNeil, Citation2013; McLeod et al., Citation2020). Furthermore, if cycling is to substitute driving (when and where possible), the relative competitiveness of cycling compared with driving must be strengthened (McLeod et al., Citation2020; Næss, Citation2012), as improved conditions for cycling alone are unlikely to result in a significant modal shift (and vice versa). It must be significantly better (easier, more pleasant, cheaper, etc.) to travel by bike compared to other modes, thereby making the former significantly more attractive and the preferred modal choice. This means ensuring that cycling is both a possible mode choice and a pleasurable experience (Rynning, Citation2018; Stefansdottir, Citation2014), while simultaneously reducing driving through restrictive measures. Being ‘possible’ relates to instrumental aspects of a trip, such as travel distance, the presence of infrastructure, and traffic safety; being ‘pleasurable’ relates to perceptual aspects, such as interesting and varied environments (Rynning, Citation2018; Stefansdottir, Citation2014). The two factors are strongly interdependent and affect the level of bikeability of a built environment and the spaces its attributes create as a whole. Bikeability describes the extent to which an area, with its natural and built environment, is both possible and pleasurable to cycle in or through for the experienced and the inexperienced cyclist.Footnote1 It relates to macro-, meso-, and micro-scale qualities and characteristics that separately and together affect cycling shares and experience. To actively promote cycling, an area must have a high level of bikeability. Achieving this requires cycling to be prioritised in all levels of physical planning, from overall land use and transport planning, via more detailed planning of new urban developments or transformations of existing built environments, to planning and implementation of specific cycling interventions. Cultural, institutional, organisational and/or political barriers must also be addressed (McLeod et al., Citation2020), but are beyond the scope of this article. Experiences from cities with high bike shares show that good results require a comprehensive focus over a longer period, combining physical and non-physical measures from strategic to operational levels in a short- and long-term perspective, together with an active prioritisation of cycling over motorised transport modes (Koglin, Citation2015; Krizek et al., Citation2009; Pucher & Buehler, Citation2010; Yang et al., Citation2010).
In a project promoting cycling through urban planning and development in small towns, we sought an approach suited for planners to identify and address physical barriers and opportunities to cycling related to built environments. Based on the project-specific needs and findings from research (Dubois, Citation2014; Kirkeby, Citation2015, Citation2012; Skogheim, Citation2008), we established the following criteria as important to ensure relevance and usability for practice:
No need for specialised, resource-demanding technical tools (some experience from urban and/or transport planning is assumed)
Addresses various scale built environment characteristics related to cycling in a holistic manner
Suited for analysis of a stretch, a neighbourhood in a city, and other smaller or larger built-up areas, with a particular focus on the Nordic context
Many approaches and methods for assessing cycling and the built environment exist (see, e.g. Arellana et al., Citation2020; Kellstedt et al., Citation2020; Muhs & Clifton, Citation2015). Recent reviews found that most are developed for non-European contexts, require the use of geographical information systems (GIS), and do not combine built environment characteristics at different scales (Arellana et al., Citation2020; Kellstedt et al., Citation2020). Assessment methods and other tools intended for planning are sometimes criticised for being too complex, expensive, inflexible, and incomprehensible (‘black boxes’) (Arellana et al., Citation2020; te Brömmelstroet et al., Citation2014; Dubois, Citation2014; Kellstedt et al., Citation2020). This reduces the transparency and soundness of an assessment. On a similar note, among the quantitative and qualitative cycling-approaches used by planning practice in Norway, we found that many lack descriptions of the relationships between the built environment and cycling they rely on, as well as which features to investigate and how to assess them. Moreover, many require the use of GIS or transport models. The latter is often criticised for using historic cycle trip patterns to anticipate future demand (McLeod et al., Citation2020), thereby not accounting for a sustainable modal shift in the planning for increased cycling. Not all municipalities have the skills or resources to use or procure highly specialised tools in their planning. In response, we developed a methodology for a holistic and qualitative assessment of micro-, meso- and macro-scale built environment characteristics influencing bikeability, intended for use by practice and research.
The remainder of the article is structured as follows. Section 2 summarises what and how the characteristics of the built environment can make cycling possible and pleasurable. This constitutes the basis for the methodology outlined in Section 3. In Section 4, the methodology is demonstrated through two examples, and in Section 5, we discuss experiences using the methodology and further development, as well as other possible uses within physical planning. Lastly, we reflect on how assessments can be used to strengthen bikeability and thus cycling competitiveness through land use and transport planning and development, especially at neighbourhood-scale planning.
2. Characteristics of the built environment that contribute to bikeability
There is widespread agreement in the literature on a positive relationship between cycling (and active travel in general) and the characteristics of the built environment (Arellana et al., Citation2020; Castañeda, Citation2021; Heinen et al., Citation2010; Muhs & Clifton, Citation2015; Nello-Deakin, Citation2020; Salvo et al., Citation2018; Wang & Wen, Citation2017).
Overall land use structure, together with the qualities of the transport system, establish significant premises for how and where we travel (Næss, Citation2012; Newman & Kenworthy, Citation2015; Tennøy et al., Citation2016). Strengthening cycling competitiveness to that of driving requires increased population density (e.g. through central urban densification), localisation of activities and destinations (including workplaces) within cycling distance, cycling connections to transit, improved conditions and network connectivity for cycling, safe and aesthetic surroundings, and restrictions on car use to reduce the overall driveabilityFootnote2 (Muhs & Clifton, Citation2015; Næss, Citation2012; Nello-Deakin, Citation2020; Salvo et al., Citation2018; Tennøy et al., Citation2016; Wang & Wen, Citation2017). Built environment characteristics that influence cycling shares and experiences can be structured into four categories: Natural and place-specific preconditions, Infrastructure and traffic, Urbanity, and Surroundings and activities. This categorisation is inspired by Knapskog et al. (Citation2019). presents an overview of the four categories with associated attributes. The attributes affect the level of built environment bikeability separately and holistically through the spaces and urban environments they create. Most are addressable through physical planning, and some establish important preconditions for cycling being a possible modal choice. Natural and place-specific preconditions influence the possibility of cycling for different trips and purposes through premises established by land use and transport systems, topography, and local climate. Infrastructure and traffic influence the extent to which cycling is safe and perceived as possible for a broad range of cyclists as well as cycling competitiveness compared with driving. Urbanity influences the possibility of cycling and whether it is experienced as pleasurable, primarily through its impact on trip distances and route options. Surroundings and activities influence how pleasurable and safe an area is perceived as for cycling. It includes attributes such as the mix of functions, wayfinding, and design and aesthetics of the built environment, all of which, if done right, can provide pleasurable cycling experiences.
Table 1. Categories and attributes of built environments influencing bikeability and criteria for high and low bikeability performance. For simplicity, ‘city’ can here refer to the urban context of a city or a town
also describes criteria for a built environment’s ‘performance’ regarding bikeability, based on existing reviews of cycling literature and individual qualitative and quantitative studies from different urban contexts, scales, geographic units and measurements. The criteria are deliberately descriptive, as we consider generating quantitative performance scores unreliable and not adjustable to different contexts and the various types of cyclist. Previous studies have obtained mixed results on the correlation between built environment and cycling (Muhs & Clifton, Citation2015; Wang & Wen, Citation2017). Some claim we have enough empirical insights (Nello-Deakin, Citation2020), but we find that there is still a lack of empirical knowledge which hinders recommending fixed values. As an example, a recommended value of density that contributes to high levels of bikeability might be correct in one context but inadequate in another, and perform differently when simultaneously accounting for other attributes. Additionally, how a person perceives an attribute and how it influences their travel experience varies depending on cycling proficiency, preferences, needs, and more (Ewing & Handy, Citation2009; Krizek et al., Citation2009; Rynning, Citation2018). However, as many studies conclude, aiming for built environments with a high level of bikeability is likely to encourage even the most inexperienced and risk-averse to cycle more, thereby contributing to a significant increase in cycling shares and a large-scale sustainable modal shift (Krizek et al., Citation2009; McLeod et al., Citation2020).
3. A qualitative assessment of bikeability
Our methodology is a holistic, approach for an overall assessment of bikeability, suited to address a stretch, a neighbourhood in a city, and other smaller or larger built-up areas. Holistic refers to approaching the physical and built environment as a whole, focusing on the public spaces and urban environments that the sum of individual attributes creates, and to what extent they contribute to cycling being possible and pleasurable. Our experience in assessing walkability (Knapskog et al., Citation2019) served as a basis for the approach. We adjusted, for significant differences between walking and cycling, such as differences in range and speed, required skills and equipment (Muhs & Clifton, Citation2015; Nielsen & Skov-Petersen, Citation2018), as well as some built environment attributes affecting bikeability. The methodology is intended for practice and research, developed for assessments within the Nordic context, and addresses different scales of built environment characteristics related to the immediate surroundings through which a person cycles and the preconditions for the trip as established by the larger urban context. It resembles a typical site analysis within urban planning and design practices, where the aim is to establish an in-depth comprehension of a site and its catchment area, and identify strengths and weaknesses. Specialised tools are not required, but we assume that users have some experience with urban and/or transport planning.
The methodology is structured around the four categories and the associated micro-, meso- and macro-scale attributes presented in . In an assessment, the ‘state’ of these attributes is evaluated with regard to whether they contribute to a high or low level of bikeability based on the criteria in the table. Assessments are done as qualitative site analysis with data collection based on observations and registrations from maps, aerial photos, and fieldwork, together with document studies, as described by, for example, MacCallum et al. (Citation2019; 61–90). If available, descriptive analyses of secondary datasets should supplement the assessment. The methodology follows the steps outlined in and .
Table 2. Description of the mixed-methods approach to assessment
Figure 1. The various attributes are assessed in an iterative manner through a mixed-methods approach
Figure 2. Natural and place-specific preconditions include topography, here assessed through open-access elevation data from the Norwegian mapping authority and fieldwork. Sauda centre is relatively flat, making cycling relatively easy and effortless. Some residential areas are located in elevated parts, making cycling an effort for some
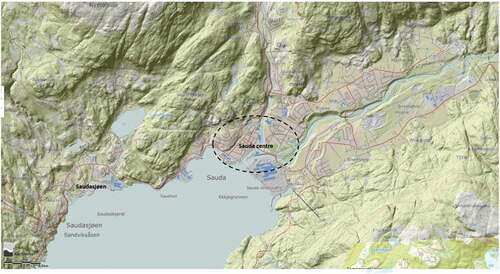
Figure 3. In Sauda, the low rise but high coverage of buildings and cohesive building structure in the centre area contribute positively to the level of bikeability within the category Urbanity
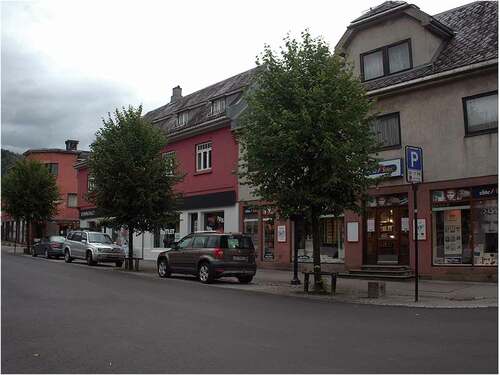
Figure 4. Traffic conditions are assessed in the category infrastructure and traffic. Cycling in mixed traffic along main roads with low traffic volumes and speed levels from 50 km/h and above makes cycling an option for more experienced cyclists, less so for the inexperienced
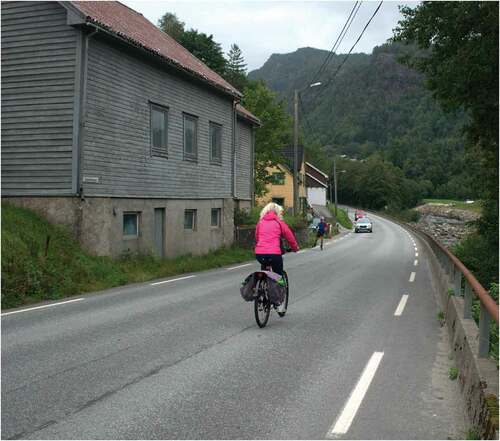
Figure 5. Alternative cycling routes in green and pleasant surroundings away from motorised transport make cycling a more viable option for less-experienced cyclists
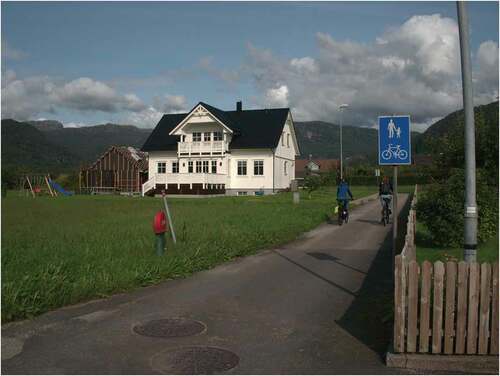
Figure 6. Open access tools used to illustrate cycling accessibility from Sauda centre. The reach based on cycling time is illustrated in 10 minutes’ intervals based on Openrouteservice, developed and provided by Heidelberg Institute for Geoinformation Technology (HeiGIT), which offers routing services by using user-generated, collaboratively collected free geographic data from OpenStreetMap. Source: https://maps.openrouteservice.org/
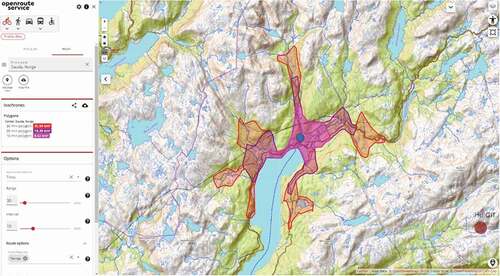
Figure 7. Natural and place-specific preconditions include topography, here assessed through open-access elevation data from the Norwegian mapping authority and fieldwork. Klosterøya is relative flat, but the hilly surroundings and cool winds from the water can, however, be a barrier for cycling
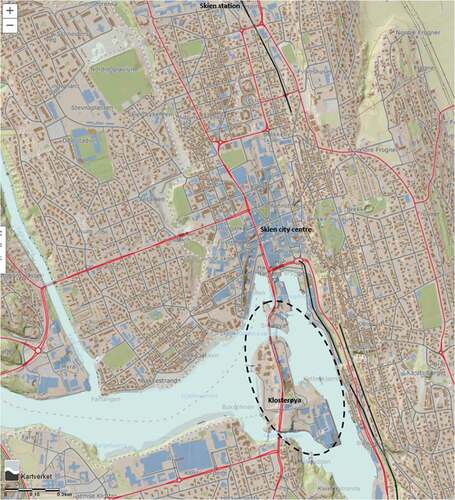
Figure 8. The elevated Klostergata is a barrier partly reduced through reopened tunnels connecting the eastern and western parts of the island of Klosterøya
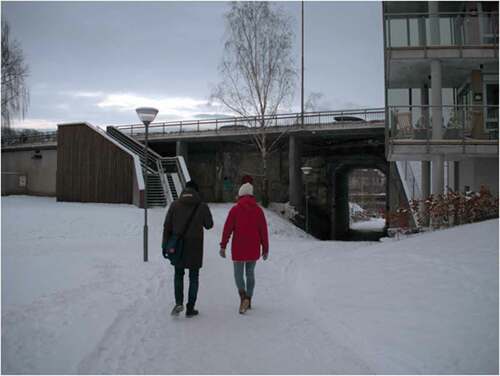
Figure 9. Alternative biking routes in pleasant surroundings at Klosterøya. The city centre of Skien is easlily vissble and wich strengthens wayfinding
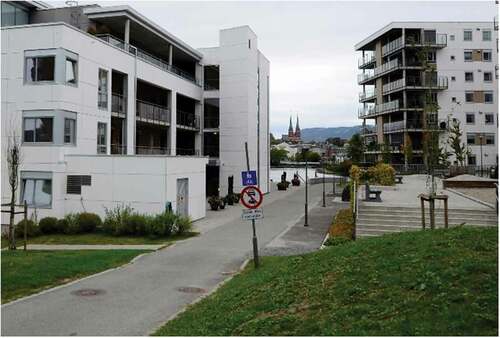
Figure 10. Biking along the main road Klostergata separated from motorised traffic, but in a car-oriented environment
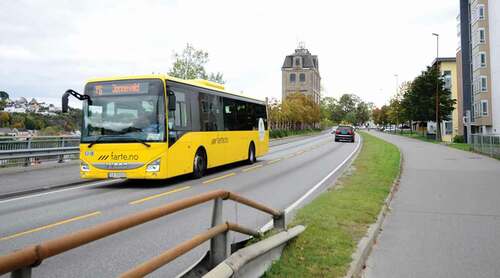
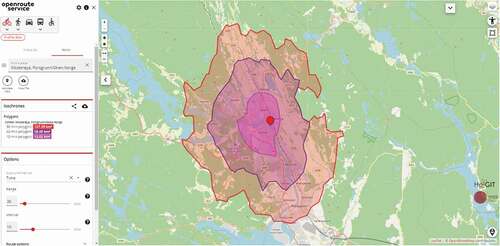
Figure 11. Open-access tools used to illustrate cycling accessibility from Klosterøya. The reach based on cycling time is illustrated in 10 minutes’ intervals based on Openrouteservice, developed and provided by Heidelberg Institute for Geoinformation Technology (HeiGIT), which offers routing services by using user-generated, collaboratively collected free geographic data from OpenStreetMap. Source: https://maps.openrouteservice.org/
The purpose of an assessment and the site and its catchment area must be clearly defined. A site can range from a particular stretch to a neighbourhood or even a larger area where selected parts are studied more in detail. When the site is defined, the catchment area is given by the localisation of central destinations that a person might travel to (e.g. schools, a city centre, grocery stores). The geographical scale and available resources will influence the level of detail of the assessment. For example, while the site is assessed in detail, the assessment of the catchment area might be restricted to selected stretches connecting the site in question to specific destinations. Data and information about category attributes are collected through the above-mentioned mixed-methods approach, establishing a gradually detailed picture. Through a holistic, qualitative judgment of the attributes, bikeability is determined using a four-point scale: very bikeable, bikeable, somewhat bikeable, and slightly bikeable for each attribute and category, and then for the site and its catchment area as a whole. Attributes may be revisited in an iterative manner as the assessment advances, for example, by first collecting data from secondary datasets and then explore the attributes through fieldwork. When concluding on the bikeability of each category and the assessed area, context-dependent and holistic considerations are important. Attributes that are highly significant for bikeability in one urban context might be less so in another, depending on the area’s built environment characteristics and the interactions among these. For this reason, neither the categories nor the attributes within each category are weighted; the evaluation is based on the assessors’ professional judgements. The built environment as a whole and the cycling experiences it creates, determine the overall conclusion. Therefore, as seen in Section 4, a site and its catchment area might be assessed as somewhat bikeable for two categories and as bikeable for the other two, then in total as somewhat bikeable. To be considered very bikeable, an area must perform well for most attributes; if it performs poorly for most attributes, the conclusion is likely slightly bikeable. Every assessment must include a thorough description of the determined level of bikeability, including how attributes and categories relate to each other. This explanation ensures transparency and reliability. We emphasise the need to explore all categories for a complete and holistic evaluation.
4. Demonstration of the bikeability assessments
Here, we demonstrate the use of the methodology through two examples from Norway. The first is an assessment of bikeability level of an existing built environment, while the second is a bikeability assessment of the planned built environment of a transformation site. Through the examples, we show how the approach can be adapted to the local context, how the attributes, categories, and the site and its catchment area as a whole are evaluated, as well as possible sources for an assessment.
4.1. Assessment of Sauda
The assessment was part of a project on how small municipalities can make people cycle more through urban planning and development. The methodology was first developed through this project. The aim was to identify possible measures to strengthen cycling conditions in the town of Sauda, and to provide a basis for developing a cycling strategy and plans. Situated in the western part of Norway, Sauda is a municipality with approximately 4,500 inhabitants.Footnote3 Most live in and around the town centre or in the neighbouring district of Saudasjøen. This continuous urban area was defined as the catchment area for the assessment, focusing on cycling to, within, and through Sauda centre. An initial assessment was done using online maps and aerial photos to gain information about the distribution of important destinations (living districts, workplaces, services, and amenities), distances within the community, existing cycling networks, and so on. Open-access national databases were used to evaluate attributes such as topography, traffic levels, speed limits, densities and more. We also explored plans, strategies, and other documents relating directly and indirectly to cycling, including travel surveys and surveys on use and perception of the local surroundings. This established a ‘first take’ on the bikeability of Sauda. Fieldwork took place over two days and included a guided bike-along with the local public health coordinator using e-bikes. This provided a valuable understanding of the local cycling experience, enabled us to evaluate attributes less ‘detectable’ through the other methods, and allowed exploration of particular aspects in detail. Cycling larger stretches, such as to and from the centre, was a particular benefit. More detailed registrations were done in the city centre by foot. Travel by car was used for the understanding of the regional context. Based on fieldwork observations and supplementary studies of maps, aerial photos, documents, and databases, we reviewed our initial assessment concluding upon the level of bikeability first for each attribute and category, then for Sauda centre and the catchment area as a whole (further referred to as Sauda). summarises the assessment, including the sources employed. illustrate some assessed attributes.
Table 3. Bikeability assessment of Sauda
We found the level of bikeability of Sauda to be bikeable. Attributes related to natural and place-specific preconditions (assessed bikeable) and urbanity (assessed bikeable) enhanced the level of bikeability through short distances, flat topography in the centre (although some residential areas were located in more elevated parts), and a relatively permeable urban structure. See . Attributes related to the category infrastructure and traffic (assessed somewhat bikeable), especially the lack of or inadequate cycling facilitation, lowered overall bikeability. See . This was to some extent, compensated by cycling options (at least for more experienced cyclists) along streets and roads with low traffic speeds and volumes, as well as alternative cycling routes. Attributes related to surroundings and activities (assessed bikeable), such as pleasant surroundings, mix of destinations and activities and functions close to each other, contributed positively. See . However, many stretches were perceived as unsafe for cycling, a significant barrier to cycling. This illustrates how deficient facilitation for cycling and perceived safety can reduce the influence of positive aspects.
4.2. Assessment of Klosterøya
The bikeability assessment of the planned built environment of the neighbourhood Klosterøya is part of a research project on sustainable adaption and resilience in urban regeneration. The project explores, in part, how sustainable travel behaviours can be facilitated through urban transformation, with bikeability being one of several studied aspects.
Previously an industrial site, Klosterøya is a centrally located island in Skien city (55,000 inhabitants), the commercial and administrative centre of the Grenland city region (107,000 inhabitants).Footnote4 Skien and the neighbouring city Porsgrunn form a more or less continuous urban area, with 30 minutes of cycling time between the two city centres. The urban transformation will be an extension of the Skien city centre, with a combination of commercial enterprises, cultural and educational institutions and dwellings. Three new walking and cycling bridges from Klosterøya to neighbouring districts will connect different parts of the city with the city centre. The transformation is ongoing, with parts of the site already in use.
The bikeability assessment followed the explained setup in Section 3, with some adjustments as the transformation was not yet completed. We focused on the planned built environment of the site with the neighbouring districts and city centre as catchment area. Primary sources were document studies of the legally binding zoning plans, with provisions and feasibility studies and assessments produced for the planning processes. Existing maps and aerial photos were used to assess the site in relation to the surrounding city. Open-access national map solutions and databases were used for only a few attributes due to the non-completed development. Fieldwork of the site and parts of the catchment area (by foot) included a guided tour by a municipal planner who explained the ongoing and planned developments. Parts of the site were closed due to construction works. The level of bikeability was assessed first for each attribute and category, then for the planned transformation and its catchment area as a whole. The findings are provided in . illustrate some assessed attributes.
Table 4. Bikeability assessment of Klosterøya
We found that the planned transformation of Klosterøya has the potential to produce a bikeable area. The category natural and place-specific preconditions was assessed as bikeable. Central localisation in the city and region (see ), new connections to surrounding neighbourhoods, and relatively low outward commuting provide good preconditions for bikeability. Within the site, the topography is relatively flat, but the elevated main road dividing the island into two parts is a significant barrier. The hilly surroundings of other parts of the city (though relatively easy overcome with e-bikes) and cool winds from the water can be a barrier. Attributes regarding infrastructure and traffic were what primarily reduced overall bikeability (assessed somewhat bikeable). There is no planned separation between pedestrians and cyclists, which can lead to conflicts (already an issue). Overall, the planned cycling network appear under-dimensioned, considering the intended increases in cycling shares. Due to the main road () the site will be highly accessible by car. Combined with a lack of parking restrictions and inadequate cycling infrastructure, this reduced the competitiveness of cycling (and other sustainable modes) to that of driving. The planned urbanity is likely to produce a very bikeable built environment with relatively high density and good walking and cycling connections to neighbouring districts, which increases proximity and accessibility. However, the elevated main road reduces the overall urbanity and connectivity. See . The planned surroundings and activities, with a mix of functions, several plazas and parks, and a waterfront, are likely to contribute to a very bikeable environment. As the site is under development and adjustments and detailing of the plans are still being made, there were uncertainties regarding the level of bikeability for some attributes, for example, which and where ‘everyday’ amenities will be located as well as the final urban structure. The final level of bikeability might yet be tipped in a more positive or negative way after completion.
5. Discussion
Our aim was to develop a methodology for a holistic, qualitative bikeability assessment of built environments, suited to address a stretch, a neighbourhood in a city, and other smaller or larger built-up areas, and employable by practice and research. Overall, we believe that we succeeded in this. In the following section, we reflect on our experiences employing the methodology, including strengths and weaknesses and further development, as well as other possible uses for bikeability assessments.
5.1. Experiences
The methodology is systematic and structured, with a clear definition of which attributes to assess and criteria for high or low bikeability performance. Combined with a required detailing of how conclusions are reached, this strengthens transparency and reliability. Attributes are evaluated through an iterative use of maps, aerial photos, and secondary data sets together with document studies and fieldwork for a thorough assessment. The approach does not need specialised tools, enabling local planners to undertake assessments themselves. The holistic nature of the methodology aligns with how practitioners tend to approach site analyses in urban planning, although it is more structured and with a particular focus on cycling. This increases its applicability in their work. The methodology is likely best suited for use by those with some experience in urban and/or transport planning and a certain understanding of how people interact with and are affected by the built environment. Some familiarity with site analysis might be an advantage.
We have demonstrated two possible uses of the methodology. It was, to some extent, easier to assess an existing urban area than a planned transformation due to uncertainties about the final outcome of the latter, as not all details are given in the zoning plans. Adjusting an assessment to the local context is very important, which the descriptive levels of bikeability-performance allows for. As with most methodologies, the assessment can be time consuming. We do not find this excessive compared with other approaches, but it might be a barrier for use. To avoid a prolonged and complicated assessment, it is important to properly define the site and its catchment area and scope to determine the right level of detail and geographical scale. The methodology is adaptable to different urban contexts and purposes, as shown through the examples. When assessing larger areas, selecting central cycling stretches and destinations is advised to reduce fieldwork time. We recommend fieldwork done by bike, to allow for cycling longer stretches and to actually experience cycling in the local context. Walking through the site allows for in-depth registrations of selected attributes. Driving can be an alternative for understanding the regional context. However, we underline that this methodology is developed for assessments of stretches, neighbourhoods and other built up areas, other approaches may be better suited for larger-scale assessments (e.g. city level). Basing assessments on fieldwork as well as existing secondary data, information from standardised and open accessible sources, etc. further reduces the required time, as less details need to be collected in the field. It should be noted that the availability of such data has increased rapidly in Norway; this may not be the case in other contexts.
An aspect potentially subject to critique is how the methodology largely depends on the assessor’s professional, qualitative judgment. Some might consider this less transparent and reliable than the use of quantitative approaches with numbered scores. Knapskog et al. (Citation2019) made a similar note regarding their walkability assessment. One way to ensure that the assessor’s professional judgment strengthens reliability is for the assessment to be made by multiple assessors, first separately, then jointly for comparison and adjustments. A potential lack of consistency should then result in a new assessment, which fits well with the iterative assessment process. Another way of supplementing the judgment of the assessor(s) is to include the user’s perspective through interviews and/or surveys. This can provide complementary perspectives, for example, how inhabitants experience and perceive cycling or how relevant actors (region, municipal, developers, etc.) consider the built environment for cycling. In the Sauda example, existing surveys provided insights on perceived safety. If done as a basis for an assessment, questions could be adapted such that the answers would inform the assessments. The need to undertake interviews and surveys depends on existing data and analyses and available time and resources.
5.2. Possible areas of use
In this study, we demonstrated the use of the bikeability assessment with two examples. Bikeability assessments of existing environments should inform different levels of planning and policy making to ensure that cycling is both possible and pleasurable through further development of the land use and transport system. Having sound knowledge about the local context and the ‘state of things’ is important to identify interventions that efficiently address barriers and challenges for cycling through long- and short-term strategies and investments. The four categories offer a systematic approach to do so across disciplines and scales, providing a basis to establish an ‘action plan’ to promote cycling. The assessment of Sauda permitted the identification of opportunities and barriers to cycling. This is, amongst others, used by the municipality as a knowledge base when developing their local cycling strategy with measures and strategies to facilitate and promote cycling. The methodology could also be used to compare the bikeability of areas within a city or in different cities, but comparisons across cities must account for different local settings.
In planning and design processes, early decisions can significantly influence the end result’s characteristics (e.g. a highly bikeable built environment) (Rynning, Citation2018). Assessing a site’s current bikeability at the beginning of a process can help identify important measures and strategies needed to facilitate cycling. A bikeability assessment of a planning proposal for an urban development can be used to strengthen the project’s capacity to promote cycling. Our assessment of the Klosterøya development identified shortcomings in the plan regarding achievable level of bikeability. Including a bikeability assessment in the environmental impact assessment could contribute to explore the extent to which the plan ensures a built environment that is both possible and pleasurable for cycling. Another prospect for use is early- or mid-stage assessments to identify key features for a project to achieve a high level of bikeability, which must then be included and made legally binding through the zoning plan and planning provisions. If done before planning approval, mitigating measures could be added. If addressed after planning approval, as the case for Klosterøya, the assessment could serve to identify interventions to address in forthcoming, detailed zoning plans or in building applications. Developers’ and municipalities’ willingness to prioritise cyclists and strengthen bikeability, and thus to undertake assessments, is a key point in this. One could envision bikeability assessments (as well as walkability assessments) becoming a requirement in planning processes to strengthen urban developments as a strategy to promote sustainable mobility. Another possible use is in combination with similar assessments of walkability and driveability to explore the extent to which urban transformations can be a catalyst for sustainable travel behaviour, particularly by increasing the competitiveness of walking and cycling to that of driving. This feeds into a larger discussion on how to ensure that the set goals and objectives for a sustainable mobility shift are enabled through urban planning and development. We do not pursue this here but invite further deliberations.
5.3. Further developments
The methodology can be further developed through the use of GIS. Although this requires specialised tools, it may be relevant for those with such competence. In our assessments, we used open-access data and basic analytical online tools from local and national websites to evaluate some of the attributes in question. A more systematic GIS approach could be useful, though perhaps for larger assessment areas than those demonstrated here. Layering of datasets through GIS-analyses could be used to, for example, identify and illustrate densities, travel distances, and the presence or lack of cycling infrastructure, and how various features overlap. Utilising GIS in combination with a qualitative assessment is also a feasible approach, where city-level GIS-analyses can be used to select areas for more in-depth fieldwork. There are, however, some aspects that hamper the use of GIS-tools. First, the need for specialised knowledge that smaller municipalities might lack, both in terms of making or requesting such analyses. Second, for relevant GIS-analyses, appropriate datasets are needed. In Norway, standardised datasets exist, but their quality must be assured prior to analyses. A cycling network should, for example, not only contain all bikeable paths, but preferably also their design and quality. Ensuring this is time consuming, as the standardised datasets do not contain all the information needed. Third, the lack of empirical knowledge on bikeability in Norway (and other contexts) is a significant hinder for GIS use. Few studies link built environment characteristics with actual cycle shares and people’s opinions of cycling, given these qualities and characteristics. Consequently, we do not know, for example, which levels of density contribute positively to cycling in various urban contexts, especially for small cities. Better empirical knowledge can render GIS-analyses a valuable part of an assessment. Until this is available, we believe that combining the described qualitative approach with GIS for selected parts of an assessment could be interesting, although not of major importance for further methodological development and use. More empirical insights could, furthermore, make it possible to define reliable thresholds for levels of bikeability (as commented in sections 2 and 3).
An interesting possibility with GIS is combining geocoded ‘hard’ information from register data and geospatial data with geocoded ‘soft’ knowledge from users (i.e. experience of cycling in an area) gathered through public participation GIS-tools to analyse connections between the two (see e.g. Kyttä, Citation2012). The suggested surveys and interviews to supplement the judgment of the assessor could provide valuable inputs and new empirical insights if used in this way. Combining qualitative approaches and quantitative measurements of built environment attributes in GIS with local cycling shares, surveys and interviews with local cyclists and non-cyclist can provide valuable knowledge about causal influences between cycling and built environment (Næss, Citation2016).
6. Concluding remarks
If people are to cycle more, the larger majority must view cycling as possible and pleasurable (Rynning, Citation2018; Stefansdottir, Citation2014). To this end, cycling must be facilitated by improving or ensuring the bikeability of the built environments. Urban planning and development represent opportunities to make people cycle more through changing the spaces and surroundings in which people cycle in or through. Addressing attributes and knowledge across the fields of urban design, public health, engineering, safety, politics, and transport economics is key in cycle-planning (McLeod et al., Citation2020; Wang & Wen, Citation2017). In this study, we demonstrated a structured and holistic methodology to qualitatively assess bikeability, intended as a contribution to this. By translating empirical knowledge on the relationship between cycling and various scale built environment characteristics to a specific context, sound knowledge about the ‘state of things’ can be derived. This is important to efficiently address barriers and challenges for cycling through long- and short-term strategies, planning, and investments, as well as to inform different levels of urban form policies. We believe that our methodology can contribute to this. The four categories with associated attributes and their performance in terms of level of bikeability offer a systematic approach to identifying the challenges and shortcomings to cycling. Addressing these attributes and categories provides insights at various scales and across disciplines, conditions needed to address to improve built environment bikeability (McLeod et al., Citation2020; Nielsen & Skov-Petersen, Citation2018; Wang & Wen, Citation2017). Through applicable examples, we found that the methodology can be adapted to different urban contexts, geographical scales, and to different purposes. Assessments can be used alone or in combination with other explorations and insights to establish a knowledge base for cycling planning and facilitation. Feedback from practice supports this. Relevance and usability for practice was a key criterion. We believe we have achieved this, for example, through the lack of need for specialised instruments, and the use of open-access information for the assessments. This addresses some of the criticisms of many accessibility and transport planning tools, as stated earlier.
Continued use by research and practice could provide more empirical knowledge on cycling and bikeability from different urban contexts, which will be important for cycling promotion through urban planning and development. As new insights become available, the methodology must be updated to ensure that it remains valid and reliable. We will continue to do so and welcome others to contribute to it.
Authors’ contributions
The authors both contributed to the study conception and design, the methodological development and the assessments. The paper was written by both authors, and both read and approved the final manuscript; they are listed alphabetically for simplicity.
Disclosure statement
No potential conflict of interest was reported by the author(s).
Additional information
Funding
Notes
1. We use the term bikeability in relation to physical and built environment characteristics and features, not in terms of physical ability or skills to bike (McNeil, 2011; Nielsen & Skov-Petersen, Citation2018).
2. We use the term drivability to describe built environment characteristics associated specifically with car use (Den Braver et al., Citation2020).
3. Data on inhabitants and commuting based on Statistics Norway 2020. https://www.ssb.no/kommunefakta.
4. Data on inhabitants and commuting based on Statistics Norway 2020, https://www.ssb.no/kommunefakta.
References
- Adam, L., Jones, T., & te Brömmelstroet, M. (2020). Planning for cycling in the dispersed city: establishing a hierarchy of effectiveness of municipal cycling policies. Transportation, 47(2), 503–527. https://doi.org/10.1007/s11116-018-9878-3
- Arellana, J., Saltarín, M., Larrañaga, A. M., González, V. I., & Henao, C. A. (2020). Developing an urban bikeability index for different types of cyclists as a tool to prioritise bicycle infrastructure investments. Transp. Res. Part Policy Pract, 139, 310–334. https://doi.org/10.1016/j.tra.2020.07.010
- Bergström, A., & Magnusson, R. (2003). Potential of transferring car trips to bicycle during winter. Transp. Res. Part Policy Pract, 37(8), 649–666. https://doi.org/10.1016/S0965-8564(03)00012-0
- Böcker, L., Dijst, M., & Prillwitz, J. (2013). Impact of everyday weather on individual daily travel behaviours in perspective: A literature review. Transp. Rev, 33(1), 71–91. https://doi.org/10.1080/01441647.2012.747114
- Böcker, L., Priya Uteng, T., Liu, C., & Dijst, M. (2019). Weather and daily mobility in international perspective: A cross-comparison of Dutch, Norwegian and Swedish city regions. Transp. Res. Part Transp. Environ, 77, 491–505. https://doi.org/10.1016/j.trd.2019.07.012
- Castañeda, P. (2021). Cycling case closed? A situated response to Samuel Nello-Deakin’s “Environmental determinants of cycling: Not seeing the forest for the trees?”. J. Transp. Geogr, 90, 102947. https://doi.org/10.1016/j.jtrangeo.2020.102947
- Cervero, R., Denman, S., & Jin, Y. (2019). Network design, built and natural environments, and bicycle commuting: evidence from British cities and towns. Transp. Policy, 74, 153–164. https://doi.org/10.1016/j.tranpol.2018.09.007
- Christensen, L., & Jensen, T. (2008). Potentiale for overflytning af korte bilture til cykel og gang. Sel. Proc. Annu. Transp. Conf. Aalb. Univ, 3(1) https://doi.org/10.5278/utd.v3i1.3763
- De Vos, J., Mokhtarian, P. L., Schwanen, T., Acker, V. V., & Witlox, F. (2015). Travel mode choice and travel satisfaction: bridging the gap between decision utility and experienced utility. Transportation, 43, 771–796. https://doi.org/10.1007/s11116-015-9619-9
- den Braver, N. R., Kok, J. G., Mackenbach, J. D., Rutter, H., Oppert, J.-M., Compernolle, S., Twisk, J. W. R., Brug, J., Beulens, J. W. J., & Lakerveld, J. (2020). Neighbourhood drivability: Environmental and individual characteristics associated with car use across Europe. Int. J. Behav. Nutr. Phys. Act, 17(1), 8. https://doi.org/10.1186/s12966-019-0906-2
- Dill, J., & McNeil, N. (2013). Four types of cyclists? examination of typology for better understanding of bicycling behavior and potential. Transp. Res. Rec. J. Transp. Res. Board, 2387(1), 129–138. https://doi.org/10.3141/2387-15
- Dubois, C. (2014). Adapter les quartiers et les bâtiments au réchauffement climatique; une feuille de route pour accompagner les architectes et les désigners urbains québécois. Université de Laval.
- Ewing, R., & Cervero, R. (2001). Travel and the built environment: A synthesis. Transp. Res. Rec. J. Transp. Res. Board, 1780(1), 87–114. https://doi.org/10.3141/1780-10
- Ewing, R., & Handy, S. (2009). Measuring the unmeasurable: Urban design qualities related to walkability. J. Urban Des, 14(1), 65–84. https://doi.org/10.1080/13574800802451155
- Fyhri, A., Heinen, E., Fearnley, N., & Sundfør, H. B. (2017). A push to cycling—exploring the e-bike’s role in overcoming barriers to bicycle use with a survey and an intervention study. Int. J. Sustain. Transp, 11(9), 681–695. https://doi.org/10.1080/15568318.2017.1302526
- Gerike, R., De Nazelle, A., Wittwer, R., & Parkin, J. (2019). Special issue “Walking and cycling for better transport, health and the environment”. Transp. Res. Part Policy Pract., Walking and Cycling for Better Transport, Health and the Environment, 123, 1–6. https://doi.org/10.1016/j.tra.2019.02.010
- Handy, S., Van Wee, B., & Kroesen, M. (2014). Promoting cycling for transport: research needs and challenges. Transp. Rev, 34(1), 4–24. https://doi.org/10.1080/01441647.2013.860204
- Heinen, E., Wee, B. V., & Maat, K. (2010). Commuting by bicycle: an overview of the literature. Transp. Rev, 30(1), 59–96. https://doi.org/10.1080/01441640903187001
- Høye, A., Sørensen, M. W. J., & De Jong, T. (2015). Separate bicycle facilities in urban areas. Effects on safety, mobility, perceived risk and modal share (No. 1447/2015). Institute of Transport Economics.
- Hull, A., & O’Holleran, C. (2014). Bicycle infrastructure: can good design encourage cycling? Urban Plan. Transp. Res, 2:1, 369–406. https://doi.org/10.1080/21650020.2014.955210
- Hulleberg, N., Flügel, S., & Ævarsson, G. (2018). Empirical based infrastructure weights for bicycle route choice (No. 1648/2018). Institute of Transport Economics, Norway.
- Kager, R., Bertolini, L., & te Brömmelstroet, M. (2016). Characterisation of and reflections on the synergy of bicycles and public transport. Transp. Res. Part Policy Pract, 85, 208–219. https://doi.org/10.1016/j.tra.2016.01.015
- Kellstedt, D. K., Spengler, J. O., Foster, M., Lee, C., & Maddock, J. E. (2020). A scoping review of bikeability assessment methods. J. Community Health46, 211–224 (2021). https://doi.org/10.1007/s10900-020-00846-4
- Kirkeby, I. M. (2012). Om at skape arkitektfaglig viten. Nord. J. Archit. Res, 24(2), 70–89.
- Kirkeby, I. M. (2015). Accessible knowledge - knowledge on accessibility. J. Civ. Eng. Archit, 9, 534–546. https://doi.org/10.17265/1934-7359/2015.05.005
- Knapskog, M., Hagen, O. H., Tennøy, A., & Rynning, M. K. (2019). Exploring ways of measuring walkability. Transp. Res. Procedia, 41, 264–282. https://doi.org/10.1016/j.trpro.2019.09.047
- Koglin, T. (2015). Vélomobility and the politics of transport planning. GeoJournal, 80(4), 569–586. https://doi.org/10.1007/s10708-014-9565-7
- Krenn, P. J., Oja, P., & Titze, S. (2015). Development of a bikeability index to assess the bicycle-friendliness of Urban environments. Open Journal of Civil Engineering, 05(04), 451–459. https://doi.org/10.4236/ojce.2015.54045
- Krizek, K. J., Forsyth, A., & Baum, L. (2009). Walking and cycling, international literature review - Final report. Victoria Department of Transport.
- Kyttä, M. (2012). SoftGIS methods in planning evaluation, in: Evaluation for Participation and Sustainability in Planning (pp. 339–359). Routledge.https://doi.org/10.4324/9780203813485-29.
- Lynch, K. (ed). (1960). The Image of the City, Nachdr. Publication of the Joint Center for Urban Studies. MIT PRESS.
- MacCallum, D., Babb, C., & Curtis, C. (2019). Doing Research in Urban and Regional Planning: Lessons in Practical Methods. Routledge.
- Marshall, W. E., & Garrick, N. W. (2010). Effect of street network design on walking and biking. Transp. Res. Rec. J. Transp. Res. Board, 2198(1), 103–115. https://doi.org/10.3141/2198-12
- McLeod, S., Babb, C., & Barlow, S. (2020). How to ‘do’ a bike plan: collating best practices to synthesise a maturity model of planning for cycling. Transp. Res. Interdiscip. Perspect, 5, 100130. https://doi.org/10.1016/j.trip.2020.100130
- Melia, S. (2015). Urban Transport Without the Hot Air (1st ed). UIT Cambridge.
- Muhs, C. D., & Clifton, K. J. (2015). Do characteristics of walkable environments support bicycling? toward a definition of bicycle-supported development. J. Transp. Land Use, 9(2). https://doi.org/10.5198/jtlu.2015.727
- Næss, P. (2012). Urban form and travel behavior: Experience from a nordic context. J. Transp. Land Use, 5(2). https://doi.org/10.5198/jtlu.v5i2.314
- Næss, P. (2016). Built environment, causality and urban planning. Planning Theory & Practice, 17(1), 52–71. https://doi.org/10.1080/14649357.2015.1127994
- Nello-Deakin, S. (2020). Environmental determinants of cycling: not seeing the forest for the trees?. J. Transp. Geogr, 85, 102704. https://doi.org/10.1016/j.jtrangeo.2020.102704
- Newman, P., & Kenworthy, J. (2015). The end of Automobile Dependence. Island Press/Center for Resource Economics.
- Nielsen, T. A. S., & Skov-Petersen, H. (2018). Bikeability – Urban structures supporting cycling. Effects of local, urban and regional scale urban form factors on cycling from home and workplace locations in Denmark. J. Transp. Geogr, 69, 36–44. https://doi.org/10.1016/j.jtrangeo.2018.04.015
- NMLGM. (2017). Urban sustainability and rural strength – In brief — Meld. St. 18 (2016–2017) report to the storting (white paper) (white paper). Norway: Norwegian Ministry of Local Government and Modernisation.
- NMT. (2020). Videreutviklet nullvekstmål fastsatt. Norway: Norwegian Ministry of Transport. www.Regjeringen.no.
- NMTC. (2013). National transport plan 2014–2023 - Meld. St. 26 (2012-2013) (white paper). Norway: Norwegian Ministry of Transport and Communications.
- NMTC. (2017). National transport plan 2018–2029 (Meld. St. 33 (2016–2017)) (white paper). Norway: Norwegian Ministry of Transport and Communications.
- NPRA. (2012). Nasjonal sykkelstrategi - Sats på sykkel! : Grunnlagsdokument for Nasjonal transportplan 2014-2023 (Report), 48. Norwegian Public Roads Administration.
- Pritchard, P., Bucher, D., & Frøyen, Y. (2019). Does new bicycle infrastructure result in new or rerouted bicyclists? A longitudinal GPS study in Oslo. J. Transp. Geogr, 77, 113–125. https://doi.org/10.1016/j.jtrangeo.2019.05.005
- Pucher, J., & Buehler, R. (2009). Integrating bicycling and public transport in North America. J. Public Transp, 12(3), 79–104. https://doi.org/10.5038/2375-0901.12.3.5
- Pucher, J., & Buehler, R. (2010). Walking and cycling for healthy cities. Built Environment, 36(4), 391–414. https://doi.org/10.2148/benv.36.4.391
- Pucher, J., & Buehler, R. (2017). Cycling towards a more sustainable transport future. Transp. Rev, 37(6), 689–694. https://doi.org/10.1080/01441647.2017.1340234
- Rynning, M. K. (2018). Towards a zero-emission mobility: Urban design as a strategy for mobility-mitigation, harmonizing knowledge from research and design practices. Institut Nationale des Science Appliquées Toulouse.
- Salvo, G., Lashewicz, B., Doyle-Baker, P., & McCormack, G. (2018). Neighbourhood built environment influences on physical activity among adults: A systematized review of qualitative evidence. Int. J. Environ. Res. Public. Health, 15(5), 897. https://doi.org/10.3390/ijerph15050897
- Skogheim, R. (2008). Mellom kunsten og kundene Arkitekters yrkessosialisering og profesjonelle praksis (PhD-thesis). University of Oslo.
- Stefansdottir, H. (2014). Pleasurable cycling to work. Urban spaces and the aesthetic experiences of commuting cyclists. Norwegian University of Life Sciences UMB.
- Svorstøl, E.-T., Ellis, O., & Varhelyi, I., A. (2017). Drift og vedlikeholds betydning for gående og syklende: En kunnskapsoppsummering. UA-rapport 99/2017. Urbanet Analyse, Oslo.
- te Brömmelstroet, M., Silva, C., & Bertolini, L. (2014). Assessing Usability of Accessibility Instruments. COST office.
- Tennøy, A., Hansson, L., Lissandrello, E., & Næss, P. (2016). How planners’ use and non-use of expert knowledge affect the goal achievement potential of plans: experiences from strategic land-use and transport planning processes in three Scandinavian cities. Prog. Plan, 109, 1–32. https://doi.org/10.1016/j.progress.2015.05.002
- Vasilev, M., Pritchard, R., & Jonsson, T. (2018). Trialing a road lane to bicycle path redesign—changes in travel behavior with a focus on users’ route and mode choice. Sustainability, 10(12), 4768. https://doi.org/10.3390/su10124768
- Wang, L., & Wen, C. (2017). The relationship between the neighborhood built environment and active transportation among adults: A systematic literature review. Urban Sci, 1(3), 29. https://doi.org/10.3390/urbansci1030029
- Yang, L., Sahlqvist, S., McMinn, A., Griffin, S. J., & Ogilvie, D. (2010). Interventions to promote cycling: systematic review. BMJ, 341(oct18 2), c5293. https://doi.org/10.1136/bmj.c5293