
ABSTRACT
Walking within neighbourhoods had been found to be beneficial in many ways including health, but there is the need to consider factors that will influence walking behaviour for planning purposes. Finding factors of walkability requires more than one tool of measurement since it involves urban form and socio-economy. The space syntax method had been applied in examining urban form (street structure) and the socio-economic factor was measured using regression analysis, within neighbourhoods of contrasting characteristics. This paper examines the syntactical properties relating to the new urbanist area and core area of the city, relating to their walking behaviour, examining the people’s socio-economic characteristics, investigating the individuals’ walking behaviour and factors explaining the variance of walkability in the study area. The paper concludes by using the findings to recommend strategies that planners, designers, and policy-makers can use to design successful transit and pedestrian-oriented developments.
1. Introduction
1.1. Urban form and walkability
Walkability is the degree to which a built environment facilitates and motivates walking. A plethora of literature abounds on the importance of active walking as the main contributor to the global public wellbeing of city dwellers, it is known to regulate blood flow and assist in ameliorating issues on cardiovascular disease and diabetes (Chaix et al., Citation2014; Hallal et al., Citation2012; World Health Organization, Citation2017). Walking for transport instead of the use of cars and automobiles have also been found beneficial to the environment in terms of reduction in the discharge of carbon dioxide and constantly associated with a cutback in other forms of pollution like noise pollution (Dhaka, Citation2008; O’niell et al., Citation2010; Chen et al., Citation2011). Recent advocacy in new urbanism that aims to create activity-friendly communities has shown that neighbourhood environmental attributes are related to residents’ walking for transport (Giles-Corti & Donovan, Citation2016; Sallis et al., Citation2016; Sallis & Owen, Citation2015).
In order to identify environmental features supportive of walking, the neighbourhood features first need to be measurable (operationalized). Over the years, several measurement methods have been developed considering environmental attributes (Brownson et al., Citation2009; Eyler et al., Citation2015). An index consisting of four components (residential density, land use mix, street connectivity, and retail site design) has been measured as attributes of walking for transport (Frank et al., Citation2010; Sugiyama et al. (Citation2019). Southworth (Citation1997) on his own suggests measuring attributes such as connectivity, linkages, safety, path quality, considering varieties of land use near path and path context. Eeing and Handy (Citation2009) measured walkability through the assessment of the physical environment through the gathering of personal perceptions (subjectively) of a and by the auditing of the physical environment that commonly includes features such as “building height, block length, and street and sidewalk width. Observations include the availability of street furniture, landscaping, the physical condition and the cleanliness of area. All these form the theoretical foundation given for the use of space syntax in M. P. Conzen (Citation2010); Ye and Nes (Citation2013, 2014).
Space syntax is a static dynamics network street theory for a quick syntactical analysis of a range of cases rooted in graph theory and the idea of urban morphology. It describes and measures quantitatively the configurational properties of urban space. Space syntax aims at describing the relational properties of urban space and through those relationships convey meaning to individuals using the space. The theory posits that the urban form, viewed as a system, carries movement from every space to every other space within the system (Hillier & Hanson, Citation1984).
The Space syntax approach seeks to identify the spatial conditions of urban streets, neighbourhoods, etc. An understanding of the spatial conditions of pedestrian flow rates and the degree of urban strength are also essential components of the neighbourhood study. This aspect is lacking in most literature on place management studies (Movoa et al., Citation2018; Van Nes, Citation2012). Another strength of space syntax is its frugality, since it reflects the geometry of the street pattern without any other issues like land use and aesthetics. It allows fast and objective analysis in the manual translation of streets to axial lines. It also treats the urban street pattern as the generator of latent centralities in terms of street centralities and also functional centralities and latent flows of pedestrians on its own (D’Acci, Citation2019; Hillier, Citation1996; Hillier & Hanson, Citation1984).
Nigerian cities have neighbourhoods with different urban forms laid out, those representing the new urbanist development neighbourhoods considered as the government-reserved areas (GRAs) which are mainly zoned for residential purpose and the old city neighbourhoods at the city core that is considered as areas of conventional development, the commercial hub with mix-land uses (Durand Andalib, Dunton, Wolch, Pentz et al., Citation2011b; Grasser et al., Citation2013). Hence, the street connectivity will be related to the street layout plans of different dimensions and forms (Badland et al., Citation2008; Koohsari et al., Citation2014).
It is put forward in this paper that the concept of space syntax is used to measure the influence of urban form on walkability, based on the natural moment it can help advance our understanding of the role of street layout in active living research. The theory of natural movement identifies street layout as a primary factor influencing walkability within a city (Dhanani et al., Citation2017; Hillier et al., Citation1993; Karimi, Citation2012; Omer & Goldblatt, Citation2016). This theory provides a link between the city form, function, and walking for transport. A burgeoning literature on the built environment has explored these aspects of new urbanist communities, for example, Brown and Cropper (Citation2001); Kim (Citation2001) researched the relationship between new urbanists and the sense of place. While Berke et al. (Citation2003) studied physical activity, Lund (Citation2003) studied the interaction among residents and Lee and Ahn (Citation2003) studied travel patterns, while Baran et al. (Citation2008) studied walking in new urbanist and sub-Urban neighbourhoods. Indeed, Hillier et al. (Citation1993) have argued that street layout is the primary initiator of walkability, suggesting that integrated streets is a correlate to peoples’ attraction to certain destinations. In this logic, a measure of space syntax is likely to be useful in understanding the role of the street network in supporting walking since it deals with both spatial and functional aspects of the urban system. However, few studies to date have examined relationships between space syntax measures and walking behaviour (Koohsari et al., Citation2013; Ratti, Citation2004; Y. Wang et al., Citation2016; J. Wang et al., Citation2007; Wineman et al., Citation2014; Xie, Citation2011). The aforementioned literature established that few studies have been carried out on urban walking behaviour in cities, this is true of Nigerian cities, where studies have not examined the syntactical properties associated with new urbanist neighbourhoods and core area neighbourhoods related to individual walking behaviour. It is important to note that for inclusivity, studies must be carried out in the new urbanist neighbourhood and the core area neighbourhood due to socio-economic disparities that may influence the walking behaviour of the people at this point the regression analysis seems appropriate means of measurement. There is, therefore, a need to study the influence of the urban form and socio-economy on walking behaviour of the two varied areas, to suggest measures of encouraging walking for incorporation into city plan and policy (Adkins et al., Citation2019, Citation2017).
In this context the research objectives are to (1) Examine the syntactical properties relating to the new urbanist area and core area of the city, relating to their walking behaviour (2) examining the people’s socio-economic characteristics (3) investigating the individuals’ walking behaviour and factors explaining the variance of walkability in the study area (4) Examine the individuals’ preferences towards certain walking behaviors (such as leisure trips and utilitarian walking).
The remainder of the paper will discuss the concept of space syntax as a measure of connectivity, theories, research methodology. This is followed by the results, discussion and then the last section will conclude the research.
1.2. Urban form and space syntax
Lynch (Citation1981) defines urban form as visible and physical appearances, while Kropf (Citation2009) regards urban form as the spatial relationships between physical aspects and human interactions, as well as resource flow. Despite these definitions, the elements of urban physical form are assessed by different theorists. M.R.G. Conzen (Citation1960) regards the elements of the form as the street, parcel patterns, buildings, and land use, while Oliveira (Citation2016) considers the streets, urban blocks, buildings and land parcels as the key elements of urban form. Generally, based on different literature, the physical elements of the urban form should include, the parcel, block, and road network, and factors related to the elements are the land use, street connectivity, density, permeability and accessibility. They are regarded as the result of socio-economic forces in the form of political and planning decisions (Caniggia & Maffei, Citation2001; Ko & Radke, Citation2014).
In the urban system, street connectivity is found to be a component of urban form which influences walkability. It is connected to street layout, influencing the direction of routes between two locations in a street network e.g. home and shopping centres (Koohsari et al., Citation2019). A compact street network is inclined towards more connections and walkability and so be related to the positive, better health conditions, more social and economic benefits (Jacobs, Citation1961; Koohsari et al., Citation2014). Land-use mix refers to having a variety of services, retail outlets and other amenities within a neighbourhood. Durand Andalib, Dunton, Wolch, Pentz et al., Citation2011a) and Grasser et al. (Citation2013) further hypothesized that higher land use mix is conducive to more walking for transport. The presence of specific land uses provides destinations for walking. The missing gap is the concept of behaviour, a lot has been written about factors influencing behaviour like in the works of Xi and Son (Citation2012), Ferrer López et al. (Citation2015), Y. Wang et al. (Citation2016), Owen et al. (Citation2007), and Van Dyck et al. (Citation2013).
The factors related to walking the behaviour of the city dwellers have been postulated by many researchers in literature is built around the city form. Papadimitriou et al. (Citation2009), Xi and Son (Citation2012) explored approaches to route choice in their model, while Jansen-Osmann and Wiedenbauer (Citation2004) suggest that people perceive as longer streets of the route with more turns, but Schlossberg et al. (Citation2007), Berlyne (Citation1974), Hagerhall et al. (Citation2004), specifically focused on perceptions of street shapes. However, authors like Kent (Citation1989), Herzong and Miller (Citation1998), and Matsumoto et al. (Citation1997), Kaplan (Citation1987, 1988), Van Holle et al. (Citation2016) explained that interactions between neighbourhoods in Belgium is related to the socio-economy of the people.
1.3. The theory of natural movement functions with pedestrian movement
Long before the theory of natural movement, most models of walkability were based on the concept of land-use ‘attractors’ rooted in the urban framework; movement was held as being to and from these attractors, in direct proportion to their relative weights (i.e. as in the gravity model: the presence of some utilities are considered more to pull factors). A number of simulated trips are then generated from pairs of origin and destination locations and grouped to produce final pedestrian flow rates. In disparity to this, the theory of natural movement in space syntax is concerned with to-movement from origin to destination within a system. In other words, every space is considered concurrently, both as an origin and a destination. The through-movement potential of space is purely the result of the pattern of the urban network, such as how the individual components of the urban structure, main streets, side streets, squares etc., are interrelated. If this structure of streets is represented as a graph it becomes clear that some streets are likely to feature on more topologically shortest routes than others in terms of accessibility. This measure of global ‘accessibility’ is indicated as ‘integration’ or through-movement potential in space syntax, which is similar to closeness centrality in the graph theory. This measure accounts for the high percentage of pedestrian flow rates in urban environments (Hillier & Iida, Citation2005; Marshall & Garrick, Citation2009). A missing gap is the concept of behaviour, a lot has been written about factors influencing behaviour like in the works of Xi and Son (Citation2012), Y. Wang et al. (Citation2016), Owen et al. (Citation2007), and Van Dyck et al. (Citation2013). The behavioural factors related to the walking of city dwellers have been postulated by many researchers in literature, which was built around environmental attributes. Papadimitriou et al. (Citation2009), Xi and Son (Citation2012) explored approaches to route choice in their model, while Jansen-Osmann and Wiedenbauer (Citation2004) suggest that people perceive as longer the streets of the routes with more turns, but Agrawal et al. (Citation2008), Berlyne (Citation1974), Hagerhall et al. (Citation2004), specifically focused on perceptions of street shapes. However, authors like Kent (Citation1989), Herzong and Miller (Citation1998), and Matsumoto et al. (Citation1997), Kaplan (Citation1987, 1988), D’Acci (Citation2019) made efforts to convince that people preferences are toward more curved streets stimulating curiosity and mystery.
2. Methodology
2.1. Axial lines
To predict the relative flow rates of pedestrians in the study area, a series of discrete lines of potential, free movement, termed axial lines was used to represent the environment by the minimum number of such lines of movement. This is carried out using the DepthMap program (mode of operating DepthMap program using a geo-coded open road map of Akure as having been explained in Turner, Citation2001; ). Each axial line is represented as a node in a graph. In the graph, the integration values are calculated for every line and value of line is then correlated with the number of people observed to be traversing the particular route.
Figure 1. Geo-coded Open Road map of Akure
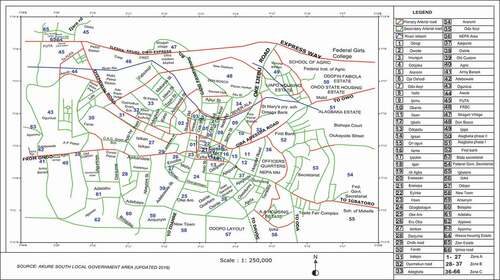
In the analysis of the street network, intersection density was calculated using geographic information systems (GIS) as the ratio of the number of intersections, n = 3 was adapted to the study. Existing road centerline data were used to obtain street network measures from geocoded open road map of Akure (). Street integration was calculated for each street segment using DepthMap X software (Turner, Citation2011). An integration score was assigned to each street segment considering all the other street segments within 1.5 km Euclidean distance from their centre, which is the perceived walkable distance within their neighbourhood. This buffer size corresponds to an area that can be reached from between 10 and 20 min, which agrees with the size of local areas often used in the study of neighbourhood environments and physical activity, this extended from the normal one-kilometre radius to make up for edge effects (Sallis et al., Citation2008).
2.2. Connectivity and depth
In space syntax connectivity the measure referring to the number of the lines directly connected with the given line in an axial map. Here lines with high connectivity values are deemed to be more utilized by traffic than other lines. This idea makes walkability to be predictable to a certain level. The ‘depth’ as a concept was introduced to help comprehend the graph structure. So, the depth of an axial line could be defined as the number of neighboring lines within a given number of steps. Hence both connectivity and depth are defined from a topological point of view. According to Baran et al. (Citation2008) the axial-line-based graph and corresponding connectivity and depth for a line can be calculated as follows: Connectivity = 4 as it has four immediate neighbours lines 2, 3, 4 and 5 connecting with it; Global depth = 1 × 4 + 2 × 5 + 3 × 3 = 23, as the sum of the product of step multiplying the number of lines for each step; Local depth (radius = 2) = 1 × 4 + 2 × 5 = 14, as the sum of the product of step (within 2 steps) multiplying the number of lines for each step (Baran et al., Citation2008).
2.3. Availability of local destinations
For each of the following 12 destination types, participants were asked with use of the questionnaire select their perceived distance to the closest one using the five categories of duration in minutes (defined as minutes of walking:‘1–5 min’; ‘6–10 min’; ‘11–20 min’; ‘20–30 min’; ‘30/min’; ‘do not know’): 1) local shop; 2) supermarket; 3) club/park; 4) greengrocery; 5) library; 6) other schools; 7) bookstore; pharmacy; 8) bus 9) work offices; 10) restaurant/café; 11), market; 12). The number of destination types that each participant report being within a 10-min walking distance, Leisure trips per day, Utilitarian walking trips per day, Linear distance (m)/day; 0–500 m, 501–1000 m, <1000 m, was used. Also, the following was asked for socio-economic characteristics: age, gender, educational attainment, work status, household income, and car ownership.
2.4. Statistical analyses
Socio-economic characteristics and the walking behaviour of household heads were investigated in the study area by neighbourhood type of residents in Akure south local government area with 800 copies of questionnaires. However, only 378 copies of questionnaires were returned as valid for use in the new urbanist area and 380 for the core area respectively. The residents in the new urbanist area were in Alagbaka estate, Ijapo estate, Odofin Fabiola and Ondo state housing estate (government reserved area (GRA) and the core area were in Fanibi area, Ajipowo area, Army Barracks area.
The method uses data acquired for socio-economic and walking behavioral characteristics of household heads to explain the variance of walkability in the study area, the analysis was conducted with the use of linear regression, in the SPSS environment.
3. Study area
`
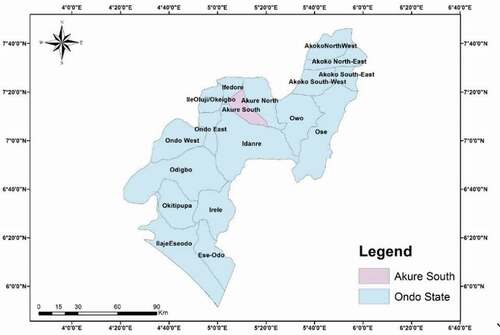
Akure is a traditional city of the Yoruba’s and it is known to have existed before the advent of the British colonial rule in Nigeria. The city is situated in the southwestern part of Nigeria. It lies approximately on latitude 70° 15ʹ North of the Equator and latitude 50° 15ʹ East of the Greenwich meridian. It is a medium-sized urban centre, which was made the provincial headquarters of Ondo province in 1939. It became both the capital city of Ondo province and Akure local government council headquarters in 1976.It is located about 420 kilometres southwest of Abuja, the Federal capital of Nigeria (). The area of research was limited to neighbourhoods at the city core of Akure and the areas that are well planned with modern houses, like the Alagbaka estate, Ijapo estate, Odofin Fabiola (termed the GRA) and Ondo state housing estate and the Conventional parts of the city at the fringes like Fanibi area, Ajipowo area, Army Barracks area. City core with a mixture of modern and relics of old buildings. These areas are crisscrossed by major roads, like Oda Road, Ondo Road, Oyemekun road and Oba-Adeshida Road (). The syntactical character of the two areas despite their shared characteristics, show key differences that make them prototypical of old conventional and new urbanist developments. These differences include the following: Average plot sizes (single-family homes in plot sizes of 30/36 meter squared for the new urbanist area versus 18/36 meter squared for the core area neighbourhoods), while the core area has mixed land uses of residential and commercial in single buildings, row houses and multi-family units.
Figure 2. Map of Ondo State showing Akure
4. Data analysis and interpretation
To predict the relative flow rate of pedestrians in a complex environment, such as in the selected areas, the environment needs to be modelled as a series of discrete lines of potential, unobstructed movement, termed axial lines. The model aim is to represent the urban environment by the least number of such lines of movement. The process of reducing an environment to its key axes of movement can be conducted algorithmically from a base map of building footprints. presents an axial map of Akure.
Figure 3. Axial map of the pedestrian network for the new urbanist area, ‘A’ and the core area, ‘B’; the highest control lines are shown in red and the lower control lines are blue and the lowest lines are shown in sky blue.)
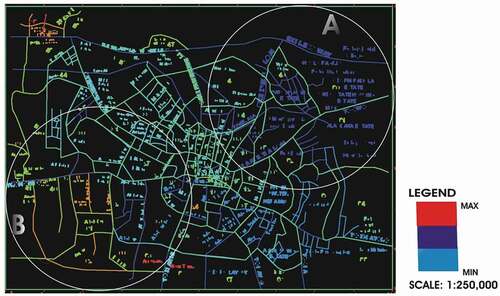
The interpretation of the axial map shown in , depicts that the red colour for the core area, is an area of high integration, so it has high connectivity and the propensity for the pedestrian to walk. While the new urbanist area (A) shows blue, indicating integration, the remaining area shown in blue, indicating very low connectivity. Also, the area ‘A’ with blue remote zones are areas of wealthy people (i.e. the GRA), characterized by modernization where walking behaviour is expected to be highly encouraged, but was surprisingly the axial map analysis showed this area to be of low walkability influence. This could mean that other intrinsic factors could have led to this outcome. Hence factors such as the socio-economic characteristic of the people should be considered as this could also influence the walkability of the people.
These arguments are corollaries to the number of axial lines. The axial line of the area ‘A’, is represented with 138 axial lines, while the part ‘B’ area of the map is more integrated with 65 axial lines identified, while the other areas within the map like the core area have low integration as shown by the axial lines (; ).
Table 1. Summary attributes of the axial map
The results could also be interpreted using the space syntax idea of centrality using the logics of integration which represents to-centrality. In calculating the total direction of change in direction to all the streets in the city. The area ‘A’ shows more changes in direction and hence higher global integration value, while the area ‘B’ shows a lower number in direction of changes (). This lies in assessing the local integration of the built part of the city. This is where the issues of socio-economy can be incorporated, hence the topological value found here is one, which is quite different from the ones for the United States, which is two and Arab countries five (Hillier, Citation2001; Karimi, Citation1998). Hence this is described as being very shallow in contrast to the United States orthogonal grid describe as topologically shallow and the Arab cities topologically deep systems.
Observing the axial map for angular integration, when broken from junction to junction, shows that most of the roads in the ‘A’ area are more angular than the ‘B’ area, where most of the roads meet at an angle close to 90° (Turner, Citation2011). This angular relationship has been found to play a great role in the way in which residents orientate themselves in deciding which route to take when heading to a destination, the area ‘B’ with junctions at 90° and 180° degrees with straight long streets, tend to influence the peoples’ walkability because the residents can conserve linearity with minimal angular deviation angles of road junctions. This agrees with Dalton et al., Citation2013 and Da’Achi, 2019, on the choice of routes. Contrary to the residents in the area ‘A’, where junction at rare angles as 30°, 60° with short curvy streets. The curvy streets with abrupt changes in angle tend to disorientate the pedestrian up to the level of getting lost. hence the street in area ‘B’ will encourage more walkability than the streets in area ‘A’.
4.1. Syntactical properties of the study area
Syntactical characteristics of the studied neighbourhoods for pedestrian networks are shown in . Comparisons between the new urbanist (A) area and the core area (B) confirms the very distinct morphology of each, where the new urbanist area shows longer and more axial lines than the core area. This was not the expectation since the pedestrian networks in the core area are in contrast in terms of the number of axial lines, pointing to the fact that there are no paths designed for pedestrian use at any street in the core area, but one could find wider roads with pedestrian workways at the new urbanist area (, ).
The comparison between the neighbourhoods indicates also the substantial differences in their global and local integration properties. The new urbanist area has a grid with less depth, 4.52 and much less segregated streets than the core area with 5.2, and this indicates higher global integration values. This also confirms that the street design pattern of the new urbanist area is more permeable and provides easier syntactic accessibility between streets than that of the core area. These findings signify the differences in the spatial structure of the two areas. However, the reality on the ground is that the people in the core area seem to walk more to areas of utility than in the new urbanist area. This is in contrast to the general expectation of the street influence. So, if the structure of the streets is not influential to this walking behaviour, then it suggests that there can be other variables, that should be considered in understanding this walking behaviour.
4.2. Exploring the socio-economic factors influencing walking behaviour
shows the socio-economic characteristics of the sampled participants. More than two-thirds of the final sample were male, 73.8% for the new urbanist area and 62.4% for the core area. The number employed outside their home area for the new urbanist area is 82.8% while the core area had 54.8%. Significantly more of the people in the new urbanist area were more educated with university degrees, 74.5%, while in the core area 46.1% of the people had degrees. The people in the new urbanist area earned more income per day than those in the core area, where 74.4% earned more than N1000 per day as opposed to 45.3% of the people in the core area. As for the average linear distance walked per day by the people in the new urbanist area, only 30% walked more than 1000 m per day, which was less than that of the core area of about 65% walk more than 1000 m per day, this could be related to the rate of car ownership, which is higher in the new urbanist area.
Table 2. Percentage values of socio-economic characteristics of the sampled participants
While more than 57% of the people in the new urbanist area had more than two cars and as few as 3% had no car, the core area has 22% of people without cars and only 50% had at least one car. When the walking destination was considered, it was found that people in the new urbanist area make more leisure trips (43.2%) than the people at the core area in which 19.6% make such trips. While walking for health was also higher as much as 44.8% of the participants in the new urbanist area than in the core area with 24.4% making such a trip. The utilitarian trip’s destination at the new Urbanist area was less at 12% than the core area of 77.8%.
4.3. The factors of the variance of walkability between the new urbanist area and the core area
shows the results of the linear regression analysis for the new urbanist area. It indicates the level of variability of factors of walkability. Here variables of ten regression models were inputted, with each a factor as the dependent variable. The model outcome for distance travel per day shows the significance value at 0.00 more than alpha, 0.05; therefore, the value is not significant and hence a bad predictor of walkability, [F (1, 443) =88.48, P = .000]. Similarly, the occupation and employment status also show significant value of .000, indicating also bad predictors, [F (1, 443) =40.00, P = .000 and F (1, 443) =52.86, P = .000, respectively].
Table 3. Summary of the model result of linear regression the new urbanist area
However, factors of Utilitarian destination show a significant value of .002 which is less than 0.05, which is a good predictor where 32.6% of all the walkability at the new Urbanist area can be explained by it [F (1, 443) =9.444, P = .002], the factor of Age also shows sign of a good predictor with a significant value of .005, given as, [F (1, 443) =8.054, P = .005], it accounts for 33.6% of the variability in walkability in the area. Gender issue was also found to be a significant predictor of walkability here since the p-value is .027 and less than the alpha 0.005, and accounts for the variability of 34.2% walkability in the area, [F (1, 443) =4.914, P = .027].
The leisure trip factor was also a good predictor with a p-value of .019 and accounting for 34.9% variability of the walkability of the area. However, the health factor shows a very significant p-value of .028, able to account for the highest variability of 35.5% of the walkability of the area.
shows the results of the linear regression for the core area. It indicates the level of variability of factors of walkability. Here variables of nine regression models were also inputted, with each a factor as the dependent variable. The model outcome for distance travel per day shows the significance value at 0.00 more than alpha, 0.05; therefore, the value is not significant and hence a bad predictor of walkability, [F (1, 443) =88.48, P = .000]. Similarly, the factors of occupation, employment were not significant, since their p-values were more than 0.005, [F (1, 443) =68.138, P = .000; F (1, 443) =54.623, P = .000, respectively]. Hence, they are bad predictors.
Table 4. Summary of the model result of linear regression of the core area
However, the factor of Utilitarian destination here too is significant at .019 which is less than 0.05, which is a good predictor where 36.1% of all the walkability at the new urbanist area can be explained [F (1, 443) =5.008, P = .019], the factor of Age also shows sign of a good predictor with a significant value of .004, given as, [F (1, 443) =9.012, P = .004], it accounts for 33.6% of the variability in walkability of the area. Gender issue was also found to be a significant predictor of walkability here since the p-value is .001 and less than 0.005, and accounts for the variability of 35.0% walkability in the area, [F (1, 443) =7.006, P = .001].
The leisure trip factor was also a good predictor with a p-value of .040 and accounting for 35.5% variability of the walkability of the area. However, the health factor shows a low significant p-value of .0003, but able to account for the variability of 32.5% of the walkability of the area [F (1, 443) =4.610, P = .003].
However, it would have been observed that R-squared values are low for this model, which is indicative of weak explanatory power, though statistically significant. This could be explained by missing important predictor variables of urban form that has have been explained earlier, hence a justification that neither the urban form variables nor the socio-economic variables alone can predict the walking behaviour of the people. The variables of the two factors must be considered simultaneously in predicting neighbourhood walkability.
5. Discussion
This study had examined the syntactical properties relating to neighbourhoods in the new Urbanist and core area, exploring the factors influencing the peoples’ walking behaviour. It attempts to find how two different measures of the street network intersection density and street integration are associated with encouraging walking and the factors accounting for the variance associated with walking in two neighbourhoods. Findings showed that in both areas, street networks measure were positively associated with frequency of walking. The axial map shows that the core area has streets of high integration, therefore high connectivity and the propensity for pedestrian walking. While the new urbanist area showed less integrated streets, characterized by modernization where walking is expected to be high but was shown to be low from the axial map analysis. This indicates that there were other factors responsible for this outcome that were not included in the analysis. These factors were found to be related to the socio-economic characteristics of the people as found in previous studies by Badland et al., Citation2008; Baran et al., Citation2008; Cervero et al., Citation2009; Saelens et al., Citation2012; Wineman et al., Citation2014. It confirms that people living in areas with well-connected streets are likely to walk more for transport. It was also found that the core area has a higher elderly adult population with low to mid-income groups, have a smaller number of cars, more areas of destinations like utilities, shops, markets close to their homes due to great land-use mix leading to more walking trips to nearby destinations. In contrast to the new Urbanist area with high a population of youth, more cars and purely residential with most utilities not too close. This finding confirmed the multi-country study on overall pattern of activity-supportive neighbourhood environment design for Utilitarian walking trips per day and lower sedentary time among adults by Oyeyemi et al. (Citation2019). It can thus be concluded that, the core area has the propensity to encourage more walking as opposed to the use of cars (Van Holle et al., Citation2016).
It was also found that walking destination plays a strong role in place walkability, where a high percentage of the people in the new urbanist area making more trips for leisure per day, (43.2%), only 19.6% at the core area. This is clearly due to the presence of more places of leisure (clubs, hotels and parks) in the new urbanist area than the core area. Also walking for health is found to be more rampant in the new urbanist area, where 44.8% of the people testified more than the 24.4% of the people in the core area. This is easily attributable to the high level of education and the rate of enlightenment of the people in the former, which is higher than those in the latter area respectively.
Furthermore, examining the factors of variance in walking behaviour among the two areas studied, the model outcome reveals that age, education level, employment outside the home area were very weak predictors of walkability at both neighbourhoods, but car ownership is a good predictor of walkability at both areas accounting for 33.6% explanation of walkability. This Suggests that car ownership has correlations with overall walkability in the areas.
The Utilitarian destination accounts for 32.6% explanation of the reason for walking for transport at the new urbanist area and 36.1% at the core area. Car ownership also accounts for 33.6% explanation of the variance of walking for transport at the new urbanist area and 33.6% at the core area. Gender was found to be another strong factor in explaining the variance of walking for transport at the new urbanist area, accounting for explaining 33.6% of the variance while at the core area, it explains 35%.
Walking for health is a high predictor at the new urbanist area accounting for 34.9% in explaining the walkability of the area as compared to the 32.5% for the core area. This corroborates the influence of these factors as aforementioned in the area. While the leisure trip factor accounts for 35.5% in explaining walkability at both new urbanist and core areas.
Overall, the study results suggest that planners will need to encourage walking for transport by focusing on creating a functional mixed land use, where Utilitarian destinations should also be established within walking distance to the peoples’ residence, a possible workplace should also be designed within walking distance for a certain threshold of the population in neighbourhoods. Utilities should be placed at short walking distances from the peoples’ residence. The planners should consider factors of variance that can explain walkability peculiar to particular areas in the urban design as opposed to traditional stereotypes, where assumptions are made without statistical backings and inputs from the people. Improving neighbourhood aesthetics is also a significantly important reason for making walking more pleasant, creating a neighbourhood sense of place and perhaps encouraging recreational walking as these designs may influence people’s decision of whether or not to walk, to a walking destination. Pedestrians walking to destinations such as shopping, local services or schools must be prioritized fast and safe routes Presence of sidewalks, tree cover and other types of urban form elements must display a warning or danger signals for pedestrian movement, even though conditions varied somewhat across the neighbourhoods, besides, street crossings should be the key focus for designers since these frequently represent the ultimate tangible and psychological walking barrier and trip delay for pedestrians.
However, since there is no legal binding force on important actions that supports all the aforementioned suggestions, there is the need to give these actions a tooth by incorporation into the legal framework by the state and local authorities. For example, walking strategies should be developed in the form of a Walking Plan to address the environmental, socio-economic and health benefits of a more walkable city. Furthermore, Transport Action Plan for transport and public health policy which takes a ‘whole street approach’ based on Healthy Street Indicators to make streets more inviting for walking should be considered. This plan should consider four main activities such as i.e. building and managing streets for people, planning and designing for walking, integrating walking with public transport, and leading a culture of change. It should also consolidate the political will to achieve this proposal by the creation of a special task force with a mandate to optimize a multimodal transport system, organizing commonality between public transport and individual modes of transport, and encouraging active travel.
6. Conclusion
Walking has become a universal and multidisciplinary policy topic, like walking and other pedestrian activities take place on a daily basis, but peoples’ ability to walk depends on personal attitudes and capabilities. Findings suggest that pedestrians tend to value quick routes over any other explicit characteristic of the pedestrian environment for a trip to the walking destination. It was also revealed that building basic path infrastructures offer direct and safe connections to popular destinations. Also, a link between walkability and the connectivity of neighbourhood, land use planning, and social aspects of accessibility was pertinent in planning. The need for legal backing for all suggested actions to enhance walkability was stressed. This could be achieved by carrying out a Transport Action Plan for transport and public health policy.
Disclosure statement
No potential conflict of interest was reported by the author(s).
Additional information
Funding
References
- Adkins, A., Barillas-Longoria, G., Martínez, D. N., & Ingram, M. (2019). Differences in social and physical dimensions of perceived walkability in Mexican American and nonhispanic white walking environments in Tucson, Arizona. J., Trans. Health, 14, 100585. https://doi.org/10.1016/j.jth.2019.100585
- Adkins, A., Makarewicz, C., Scanze, M., Ingram, M., & Luhr, G. (2017). Contextualizing walkability: Do relationships between built environments and walking vary by socioeconomic context? J. Am. Plan. Assoc, 83(3), 296–314. https://doi.org/10.1080/01944363.2017.1322527
- Agrawal, A. W., Schlossberg, M., & Irvin, K. (2008). How far, by which route and why? A spatial analysis of pedestrian preference. Journal of Urban Design, 13(1), 81–98. https://doi.org/10.1080/13574800701804074
- Alabi, M. O. (2015). Determinants of land use Dynamics in North Central Nigeria. Ph.D. Thesis Department of Urban and Regional Planning, University of Nigeria.
- Badland, H. M., Schofield, G. M., & Garrett, N. (2008). Travel behavior and objectively measured urban design variables: Associations for adults traveling to work. Health & Place, 14(1), 85–95. https://doi.org/10.1016/j.healthplace.2007.05.002
- Baran, P. K., Rodríguez, D. A., & Khattak, A. J. (2008). Space syntax and walking in a new urbanist and suburban neighbourhoods. Journal of Urban Design, 13(1), 5–28. https://doi.org/10.1080/13574800701803498
- Berke, P., MacDonald, J., White, N., Holmes, M., Line, D., Oury, K., & Ryznar, R. (2003). Greening development to protect watersheds: Does new urbanism make a difference? Journal of the American Planning Association, 69(4), 397–413. https://doi.org/10.1080/01944360308976327
- Berlyne, D. E. (1974). Studies in the new experimental aesthetics: Steps toward an objective psychology of aesthetic appreciation. Halsted Press.
- Brown, B. B., & Cropper, V. L. (2001). New urban and standard suburban subdivisions: Evaluating psychological and social goals. Journal of the American Planning Association, 67(4), 402–419. https://doi.org/10.1080/01944360108976249
- Brownson, R. C., Hoehner, C. M., Day, K., Forsyth, A., & Sallis, J. F. (2009). Measuring the built environment for physical activity: State of the science. Am. J. Prev. Med, 36(4), e12. https://doi.org/10.1016/j.amepre.2009.01.005
- Caniggia, G., & Maffei, G. (2001). Architectural composition and building typology: Interpreting basic building. Alinea.
- Cervero, R., Sarmiento, O. L., Jacoby, E., Gomez, L. F., & Neiman, A. (2009). Influences of built environments on walking and cycling: Lessons from Bogota. International Journal of Sustainable Transportation, 3(4), 203–226. https://doi.org/10.1080/15568310802178314
- Chaix, B., Kestens, Y., Duncan, S., Merrien, C., Thierry, B., Pannier, B., Brondeel, R., Lewin, A., & Karusisi, N. (2014). Active transportation and public transportation use to achieve physical activity recommendations: A combined GPS, acceleration and mobility survey study. Int. J. Behavioral; Nutr. Phys. Act, 11(1), 124. https://doi.org/10.1186/s12966-014-0124-x
- Chen, Y., Li, X., Zheng, Y., & Liu, X. (2011). Estimating the relationship between urban form and energy consumption: A case study in the Pearl River Delta, 2005-2008. Landscape and Planning, 102(1), 33–42. https://doi.org/10.1016/j.landurbplan.2011.03.007
- Conzen, M. P. (2010). ‘The elusive common denominator in understanding urban form’. Urban Morphology, 14, 55–58. https://doi.org/10.1007/978-3-319-76126-8_8
- Conzen, M. R. G. (1960). Alnwick, Northumberland: A study in town-plan analysis. Institute of British Geographers Publication.
- D’Acci, L. (2019). Aesthetical cognitive perceptions of urban street form. Pedestrian preferences toward straight or curvy route shapes. Journal of Urban Design, 24(6), 896–912. Retrieved from www.tandfonline.com/doi/full/10.1080/13574809.2018.1554994. https://doi.org/10.1080/13574809.2018.1554994
- Dalton, A. M., Jones, A. P., Panter, J. R., and Ogilvie. (2013). Neighbourhood, route and work place -Related environmental characteristics predict adults' mode of travel to work. Journal of Environmental, Travel Mode and the Commute to Work, 8(6), 1–8, 0067575.
- Dhaka, S. (2008). Climate change and cities: The making of a climate friendly future. In P. Droege (Ed.), Urban energy transmission from fossil fuels to renewable power (pp. 172–182). Elsevier.
- Dhanani, A., L. Tarkhanyan, and L. Vaughan. (2017). Estimating pedestrian demand for active transport evaluation and planning. Transportation Research Part A: Policy and Practice 103: 54–69.
- Durand, C. P., Andalib, M., Dunton, G. F., Wolch, J., & Pentz, M. A. (2011a). A systematic review of built environment factors related to physical activity and obesity risk: Implications for smart growth urban planning. Obes. Rev, 12(5), e173–e182. https://doi.org/10.1111/j.1467-789X.2010.00826.x
- Durand, C. P., Andalib, M., Dunton, G. F., Wolch, J., & Pentz, M. A. (2011b). A systematic review of built environment factors related to physical activity and obesity risk: Implications for smart growth urban planning. Obes. Rev, 12(5), e173–e182. https://doi.org/10.1112/j.1467-789X.2010.00826.x
- Eeing, R., and Handy, S (2009). Measuring the unmeasurable: Urban design qualities related to walkability. Journal of Urban Design, 14(1), 65–84. https://doi.org/10.1080/13574800802451155
- Eyler, A. A., Blanck, H. M., Gittelsohn, J., Karpyn, A., McKenzie, T. L., Partington, S., Slater, S. J., & Winters, M. (2015). Physical activity and food environment assessments. Am. J. Prev. Med, 48(5), 639–645. https://doi.org/10.1016/j.amepre.2014.10.008
- Ferrer López, S., Ruiz Sánchez, T., & Mars, L. (2015). A qualitative study on the role of the built environment for short walking trips. Transportation Research. Part F, Traffic Psychology and Behaviour, 33, 141–160. https://doi.org/10.1016/j.trf.2015.07.014.
- Frank, L. D., Sallis, J. F., Saelens, B. E., Leary, L., Cain, K., Conway, T. L., & Hess, P. M. (2010). The development of a walkability index: Application to the neighbourhood quality of life study. Br. J. Sports Med, 44(13), 924–933. https://doi.org/10.1136/bjsm.2009.058701
- Giles-Corti, B., & Donovan, R. J. (2016). Socioeconomic status differences in recreational physical activity levels and real and perceived access to a supportive physical environment. Preventive Medicine, 35(6), 601–611. https://doi.org/10.1006/pmed.2002.1115.
- Grasser, G., Van Dyck, D., Titze, S., & Stronegger, W. (2013). Objectively measured walkability and active transport and weight-related outcomes in adults: A systematic review. Int. J. Public Health, 58(4), 615–625. https://doi.org/10.1007/s00038-012-0435-0
- Hagerhall, C. M., Purcell, T., & Taylor, R. (2004). Fractal dimension of landscape silhouette outlines as a predictor of landscape preference. Journal of Environmental Psychology, 21(1), 83–92. https://doi.org/10.1006/jevp.2000.0186.
- Hallal, P. C., Aderson, L. B., Bull, F. C., Guthhold, R., Haskell, W. J., & Ekelund, U. (2012). Global physical activity levels: surveillance progress pitfalls and proposal. Lancet, 380(9838), 247–257. https://doi.org/10.1016/S0140-6736(12)60646-1
- Herzog, T., & Miller, E. (1998). The role of mystery in perceived danger and environmental preference. Environmental and Behavior, 30(4), 429–449. https://doi.org/10.1177/001391659803000401
- Herzong, T., & Miller, E. (1998). The role of mystery in perceived danger and environmental preference. Environmental and Behavior, 30(4), 429–449. https://doi.org/10.1177/001391659803000401
- Hillier, B. (1996). Space is the Machine: A Configurational Theory of Architecture. Cambridge University Press.
- Hillier, B. (2001). A theory of the city as object: Or how spatial laws mediate the social construction of urban space. In: Proceedings space syntax 3rd international symposium (pp. 3–23). Atlanta: UCL Press.
- Hillier, B., & Hanson, J. (1984). The Sociallogic of space. Cambridge University Press.
- Hillier, B., & Iida, S. (2005). Network effects and psychological effects: A theory of urban movement. Proceedings of the 5th international space syntax symposium. Atlanta Georgia, USA: UCL Press.
- Hillier, B., Penn, A., Hanson, J., Grajewski, T., & Xu, J. (1993). Natural movement: Or, configuration and attraction in urban pedestrian movement. Environ. Plan. B: Plan. Des, 20(1), 29–66. https://doi.org/10.1068/b200029
- Jacobs, J. (1961). The Death and Life of the Great American Cities. Random House.
- Jansen-Osmann, P., & Wiedenbauer, G. (2004). The representation of landmarks and routes in children and adults: A study in a virtual environment. Journal of Environmental Psychology, 24(3), 347–357. https://doi.org/10.1016/j.jenvp.2004.08.003
- Kaplan, S. (1987). Aesthetics, affect, and cognition: environmental preference from an evolutionary perspective. Environment and Behavior, 19(1), 3–32. https://doi.org/10.1177/0013916587191001
- Kaplan, S. (1988). Where cognition and affect meet: A theoretical analysis of preference. In J. L. Nasar (Ed.), Environmental aesthetics: Theory, research and applications (pp. 56–63). Cambridge University Press.
- Karimi, K. (1998). Continuity and change in old cities; an analysis investigation of the spatial structure in Iranian and English historic cities before and after modernization, PhD thesis, The Bartlett School, University College London.
- Karimi, K. (2012). A configurational approach to analytical urban design: ‘Space Syntax’ methodology. Urban Design International, 17(4), 297–318.
- Kent, R. (1989). The role of mystery in preferences for shopping malls. Landscape Journal: Design, Planning and Management, 8(1), 28. https://doi.org/10.3368/lj.8.1.28
- Kim, Y. O. (2001). The role of spatial configuration in spatial cognition. In: Proceedings of the 3rd international space syntax symposium (pp. 49.1–49.21). Atlanta: Georgia Institute of Technology.
- Ko, Y., & Radke, J. D. (2014). The effect of urban form and residential cooling energy use in Sacramento, California. Environment and Planning. B, Planning & Design, 41(4), 573–593. https://doi.org/10.1068/b12038p
- Koohsari, M. J., Karakiewicz, J. A., & Kaczynski, A. T. (2013). Public open space and walking: The role of proximity, perceptual qualities of the surrounding built environment, and street configuration. Environ. Behav, 45(6), 706–736. https://doi.org/10.1177/0013916512440876
- Koohsari, M. J., Oka, K., Owen, N., & Sugiyama, T. (2019). Natural movement: A space syntax theory linking urban form and function with walking for transport. Journal of Health and Place, 58 (2019), 102072. Elsevier Ltd. https://doi.org/10.1016/j.healthplace.2019.01.002
- Koohsari, M. J., Sugiyama, T., Lamb, K. E., Villanueva, K., & Owen, N. (2014). Street connectivity and walking for transport: Role of neighborhood destinations. Preventive Medicine, 66, 118–122. https://doi.org/10.1016/j.ypmed.2014.06.019
- Kropf, K. (2009). Aspects of urban form. Urban Morphology, 13(2), 105–120. https://www.researchgate.net/publication/289348372_Aspects_of_urban_form/references#fullTextFileContent
- Lee, C. M., and Ahm, K. H. (2003). Is Kentlands better than Radburn? The American Garden City and the new Urbanist paradigms. Journal of the American Planning Association, 69(1), 50–71. https://doi.org/10.1080/01944360308976293
- Lund, H. (2003). Testing the claims of new urbanism. Journal of the American Planning Association, 69(4), pp. 414–429. https://doi.org/10.1080/01944360308976328
- Lynch, K. (1981). Good city form. MIT Press.
- Marshall, W., & Garrick, N. (2009). The shape of sustainable street networks for neighbourhoods and cities. In: Congress for the new urbanism XVII, Denver, CO: Routledge, Taylor and Frances group.
- Matsumoto, N., Koyanagi, E., & Seta, S. (1997). Physical and mental factors of anticipation in the streetscape. Conference proceedings of the international conference on environment-behavior studies for the 21st century (pp. 283–286). Tokyo: The university of Tokyo , Japan.
- Movoa, S., Eagleson, S., Badland, H. M., Gunn, L., Boulange, C., Stewart., J., & Giles–Corti, B. (2018). Identifying appropriate land use mix measures for use in a natural walkability index. Journal of Transportation, Land Use, 11(1), 681–700. https://doi.org/10.5198/jtlu.2018.1132
- O’neill, B. G., Dalton, M., Fuchs, R., Jiang, L., Pachuri, S., & Zigova, K. (2010). Global demographic trends and future carbon emissions. Proceedings of National Academy of Sciences 107(41), 17521–17526.
- O’neill, B. G., Dalton, M., Fuchs, R., Jiang, L., Pachuri, S., & Zigova, K. (2010). Global demographic trends and future carbon emissions. Proceedings of the national academy of sciences (Vol. 107, pp. 17521–17526). New York: Y.K. International Institute for Applied Systems Analysis.
- Oliveira, V. (2016). Urban morphology: An introduction to the study of the physical form of cities (pp. 1197–1199). Cham, Switzerland: Springer.
- Omer, I., and Goldblatt, R. (2016). Spatial patterns of retail activity and street network structure in New and Traditional Israeli cities. Journal of Geography, 37, 629–649. https://doi.org/10.1080/0272638.2015.1101258
- Owen, N., Cerin, E., Leslie, E., duToit, L., Coffee, N., Frank, L. D., & Sallis, J. F. (2007). Neighbourhood walkability and the walking behavior of Australian adults. American Journal of Preventive Medicine, 33(5), 387–395. https://doi.org/10.1016/j.amepre.2007.07.025
- Oyeyemi, L. O., Kolo, M. S., Rufai, A. A., Oyeyemi, A. Y., Omotara, A. B., & Sallis, J. F. (2019). Associations of neighbourhood walkability with sedentary time in Nigerian older adults. International Journal of Environmental Research and Public Health, 16(11), 2–12. https://doi.org/10.3390/ijerph16111879
- Papadimitriou, E., Yannis, G., & Golias, J. (2009). A critical assessment of pedestrian behaviour models. Transportation Research. Part F, Traffic Psychology and Behaviour, 12(3), 242–255. https://doi.org/10.1016/j.trf.2008.12.004
- Ratti, C. (2004). Space syntax: Some inconsistencies. Environment and Planning. B, Planning & Design, 31(4), 487–499. https://doi.org/10.1068/b3019
- Saelens, B. E., Sallis, J. F., Black, J. B., & Chen, D. (2003). Neighborhood-based differences in physical activity: An environmental scale evaluation. American Journal of Public Health, 93(9), 1552–1558. https://doi.org/10.2105/AJPH.93.9.1552
- Saelens, B. E., Sallis, J. F., Myron, F. F., & Rodriquez, D. A. (2012). Role of built environments on physical activity. Obesity and Cardiovascular Diseases. Built Environment and Activity, 729–738. https://doi.org/10.1161/CIRCULATIONAHA.110.969022
- Sallis, J. F., Owen, N., & Fisher, E. B. (2008). Ecological models of health behavior. In K. Glanz, B. Rimer, & K. Viswanath (Eds.), Health Behavior and Health Education: Theory, Research, and Practice (4th ed, pp. 465–482). Jossey-Bass.
- Sallis, J. F., & Owen, N. (2015). Ecological models of health behavior. In K. Glanz, B. K. Rimer, & K. Viswanath (Eds.), Health Behavior Theory. San Francisco (pp. 43–64). Jossey-Bass. Jossey-Bass.
- Sallis, J. F., Cerin, E., Conway, T. L., Adams, M. A., Frank, L. D., Pratt, M., Salvo, D., Schipperijn, J., & Smith, G. (2016). Physical activity in relation to urban environments in 14 cities worldwide: Across-sectional study. Lancet, 387(10034), 2207–2217. https://doi.org/10.1016/S0140-6736(15)01284-2
- Schlossberg, M., Agrawal, A. W., Bekkouche, V. L., & Irvin, K. (2007). How Far, By Which Route, and Why? A Spatial Analysis of Pedestrian Preference, (Mineta Transportation Institute, San Jose State University).
- Southworth, M. (1997). Walkable suburbs? an evaluation of neotraditional communities at the Urban Edge. Journal of the American Planning Association, 63(1), 28–44. https://doi.org/10.1080/01944369708975722
- Sugiyama, T., Neuhaus, M., Cole, R., Giles-Corti, B., & Owen, N. (2019). Destination and route attributes associated with adults’ walking: A review. Med. Sci. Sports Exerc, 44(7), 1275–1286. https://doi.org/10.1249/MSS.0b013e318247d286
- Turner, A. (2001). Angular analysis. Proceedings, 3rd international space syntax symposium (pp. 30.1–30.11). Atlanta: Georgia Institute of Technology. G.A.
- Turner, A. (2011). Angular analysis. In Proceedings, 3rd international Space Syntax symposium, Atlanta, 30, 1–30.
- Vallance, J. K., Gardiner, P. A., Lynch, B. M., D’Silva, A., Boyle, T., Taylor, L. M., Johnson, S. T., Buman, M. P., & Owen, N. (2018). Evaluating the evidence on sitting, smoking, and health: is sitting really the new smoking? American Journal of Public Health, 108(11), 1478–1482. https://doi.org/10.2105/AJPH.2018.304649
- Van Dyck, D., Cerin, E., Conway, T. L., De Bourdeaudhuij, I., Owen, N., Kerr, J., & Sallis, J. F. (2013). Perceived neighbourhood environmental attributes associated with adults’ leisure time physical activity: findings from Belgium, Australia and the USA. Health & Place, 19, 59–68. https://doi.org/10.1016/j.healthplace.2012.09.017
- Van Holle, V., Van Cauwenberg, J., De Bourdeaudhuij, I., Deforche, B., Van De Weghe, N., & Van Dyck, D. (2016). Interactions between neighbourhood social environment and walkability to explain Belgian older adults’ physical activity and sedentary time. Int J. Environ. Res. Public Health, 13(6), 569. https://doi.org/10.3390/ijerph13060569
- Van Nes, A. (2012). Between heaven and earth. Christian Norberg-Schulz’s contribution to the phenomenology of place and architecture. Environmental and Architectural Phenomenology, 23(1), 7–12. https://pdfcookie.com/documents/environmental-amp-achitectural-phenology-vol-2012-3-issues-9025qy9e821k
- Wang, J., Zhu, Q., & Qizhi, M. (2007). The three-dimensional extension of space syntax. Proceedings, 6th international space syntax symposium (pp. 048.01–048.16). Istanbul: ROULEDGE, OXON, U.K.
- Wang, Y., Chau, C. K., Ngb, W. Y., & Leung, T. M. (2016). A review on the effects of physical built environment attributes on enhancing walking and cycling activity levels within residential neighbourhoods. Cities, 50, 1–15. https://doi.org/10.1016/j.cities.2015.08.004
- Wineman, J. D., Marans, R. W., Schulz, A. J., Van Der Westhuizen, D. L., Mentz, G. B., & Max, P. (2014). Designing healthy neighbourhoods: Contributions of the built environment to physical activity in Detroit. J. Plan. Educ. Res, 34(2), 180–189. https://doi.org/10.1177/0739456X14531829
- World Health Organization. (2017). Physical inactivity: A global public health problem. http://www.who.int/dietphysicalactivity/factsheet_inactivity/en/
- Xi, H., & Son, Y. J. (2012). Two-level modeling framework for pedestrian route choice and walking behaviors. Simulation Modelling Practice and Theory, 22, 28–46. https://doi.org/10.1016/j.simpat.2011.11.002
- Xie, Z. (2011). Exploration of the potential use of space syntax analysis in 3D parametric design: the case of Quamzhou, Thesis, University College London.
- Ye, Y., & Nes, V. (2013). Measuring urban maturation processes in Dutch and Chinese new towns: Combining street network configuration with building density and degree of land use diversification through GIS. Journal of Space Syntax, 4, 18–37. https://doi.org/10.1016/j.healthplace.2012.09.017